| Param | Original file | Final file |
|---|---|---|
| Filename | modeM0/AS1A11_097T17_9000005222_36573cztM0_level2.evt | modeM0/AS1A11_097T17_9000005222_36573cztM0_level2_quad_clean.evt |
| Size (bytes) | 948,859,200 | 123,589,440 |
| Size | 904.9 MB | 117.9 MB |
| Events in quadrant A | 5,241,226 | 775,018 |
| Events in quadrant B | 5,502,173 | 773,429 |
| Events in quadrant C | 6,385,482 | 747,120 |
| Events in quadrant D | 10,872,002 | 692,600 |
| Mode M0 | |||
|---|---|---|---|
| Quadrant | BADHDUFLAG | Total packets | Discarded packets |
| A | 0 | 22748 | 4 |
| B | 0 | 23603 | 3 |
| C | 0 | 25684 | 3 |
| D | 0 | 40088 | 3 |
| Mode M9 | |||
|---|---|---|---|
| Quadrant | BADHDUFLAG | Total packets | Discarded packets |
| A | 0 | 41 | 0 |
| B | 0 | 41 | 0 |
| C | 0 | 41 | 0 |
| D | 0 | 41 | 0 |
| Mode SS | |||
|---|---|---|---|
| Quadrant | BADHDUFLAG | Total packets | Discarded packets |
| A | 0 | 224 | 0 |
| B | 0 | 224 | 0 |
| C | 0 | 224 | 0 |
| D | 0 | 224 | 0 |
| Quadrant | Total seconds | Saturated seconds | Saturation percentage |
|---|---|---|---|
| A | 10892 | 18 | 0.165259% |
| B | 10892 | 76 | 0.697760% |
| C | 10892 | 346 | 3.176643% |
| D | 10892 | 1103 | 10.126698% |
Noise dominated data is calculated using 1-second bins in cleaned event files. If a bin has >2000 counts, and if more than 50% of those come from <1% of pixels, then it is considered to be noise-dominated and hence unusable.
| Quadrant | # 1 sec bins | Bins with >0 counts | Bins with >2000 counts | High rate bins dominated by noise | Noise dominated (total time) | Noise dominated (detector-on time) | Marked lightcurve |
|---|---|---|---|---|---|---|---|
| A | 15010 | 10895 | 0 | 0 | 0.00% | 0.00% | 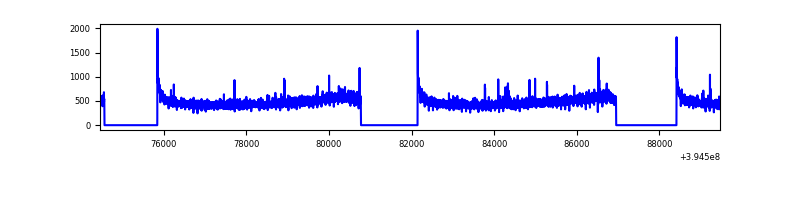 |
| B | 15010 | 10895 | 40 | 40 | 0.27% | 0.37% | 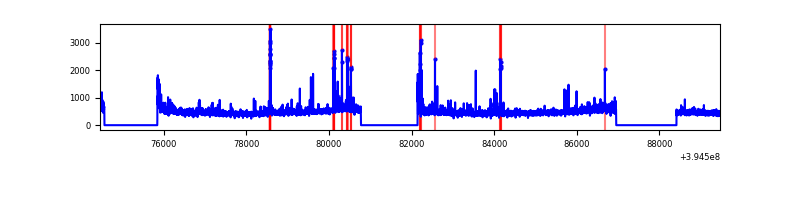 |
| C | 15010 | 10895 | 241 | 241 | 1.61% | 2.21% | 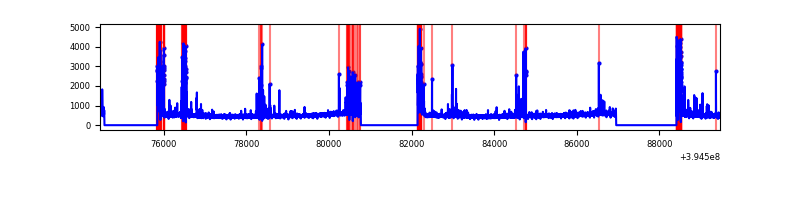 |
| D | 15010 | 10895 | 675 | 675 | 4.50% | 6.20% | 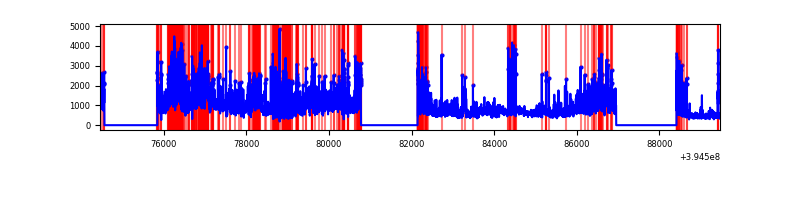 |
Top three noisy pixels from each quadrant. If the there are fewer than three noisy pixels in the level2.evt file, extra rows are filled as -1
| Pixel properties | Quadrant properties | ||||||
|---|---|---|---|---|---|---|---|
| Quadrant | DetID | PixID | Counts | Sigma | Mean | Median | Sigma |
| A | 10 | 83 | 357427 | 1426.72 | 1244 | 1219 | 249.7 |
| A | 15 | 223 | 34964 | 135.16 | 1244 | 1219 | 249.7 |
| A | 13 | 254 | 16469 | 61.08 | 1244 | 1219 | 249.7 |
| B | 5 | 255 | 200315 | 837.33 | 1233 | 1197 | 237.8 |
| B | 0 | 219 | 157538 | 657.44 | 1233 | 1197 | 237.8 |
| B | 5 | 172 | 71514 | 295.69 | 1233 | 1197 | 237.8 |
| C | 0 | 10 | 738022 | 2648.28 | 1197 | 1205 | 278.2 |
| C | 15 | 214 | 456252 | 1635.54 | 1197 | 1205 | 278.2 |
| C | 14 | 254 | 447421 | 1603.8 | 1197 | 1205 | 278.2 |
| D | 1 | 20 | 2727344 | 9481.89 | 1172 | 1141 | 287.5 |
| D | 12 | 235 | 1016434 | 3531.25 | 1172 | 1141 | 287.5 |
| D | 12 | 16 | 938944 | 3261.73 | 1172 | 1141 | 287.5 |
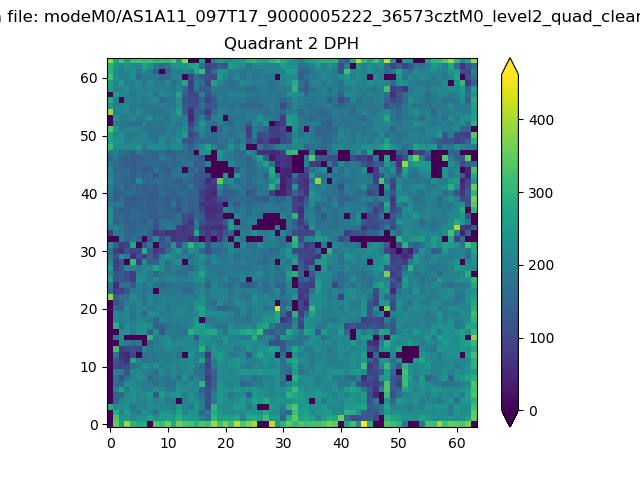
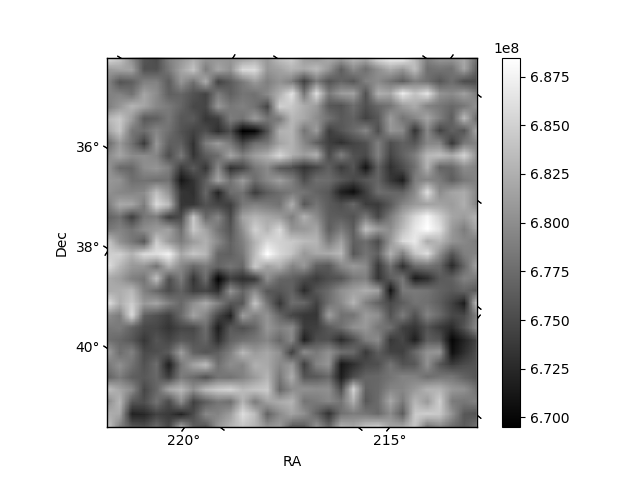
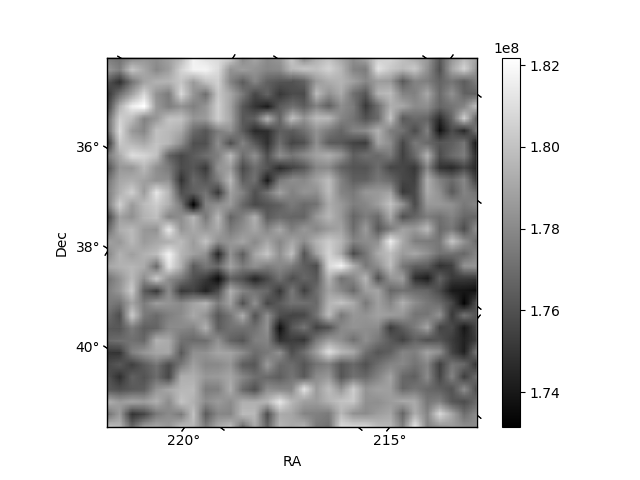
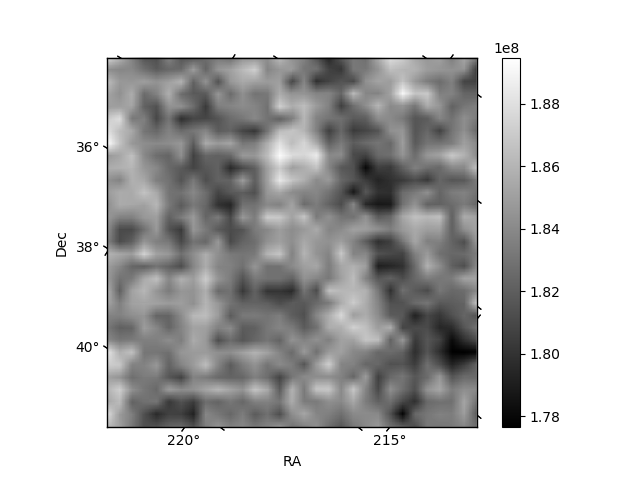
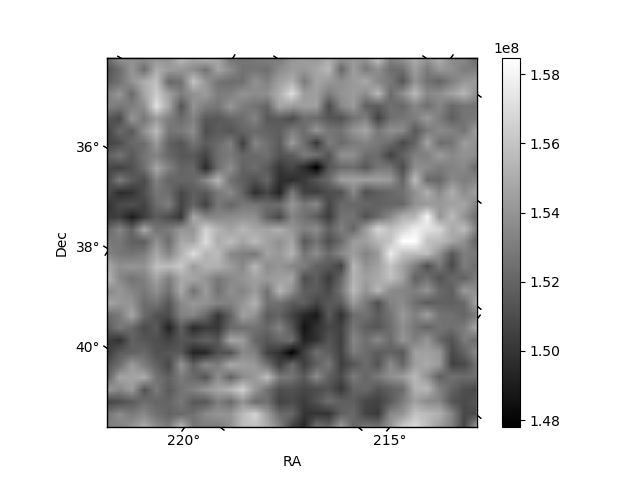
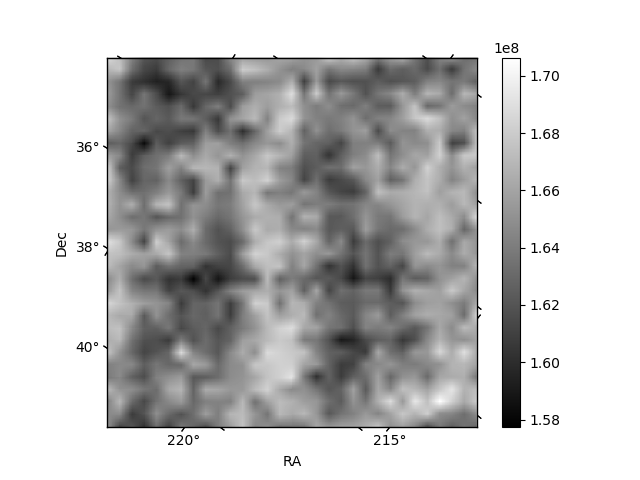
Histogram calculated using DETX and DETY for each event in the final _common_clean file
| Quadrant A | 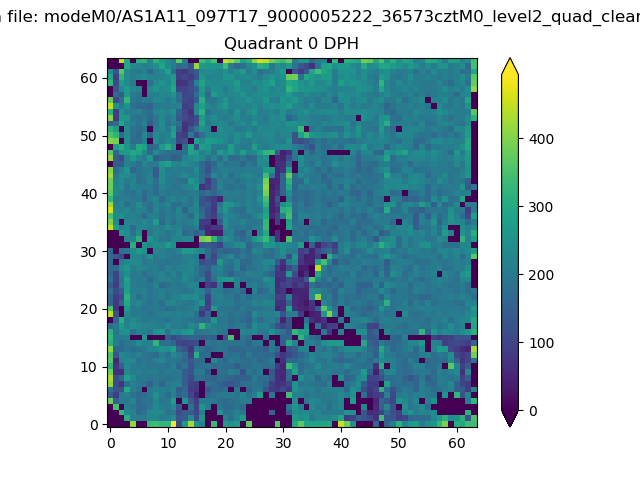 |
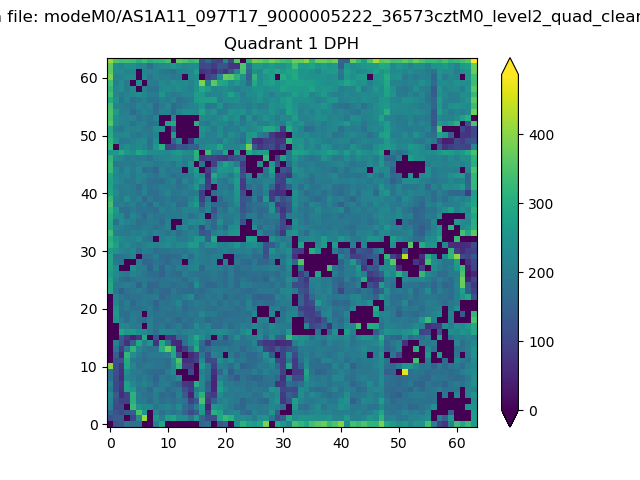 |
Quadrant B |
|---|---|---|---|
| Quadrant D | 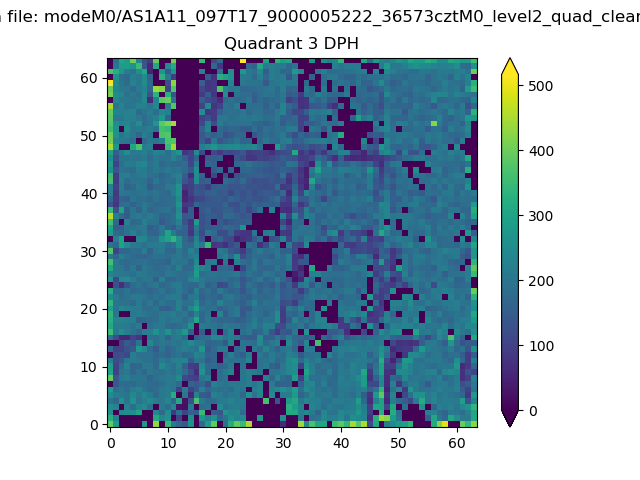 |
 |
Quadrant C |
| Plot type | Count rate plots | Images |
|---|---|---|
| Comparison with Poisson distribution Blue bars denote a histogram of data divided into 1 sec bins. Red curve is a Poisson curve with rate = median count rate of data. |
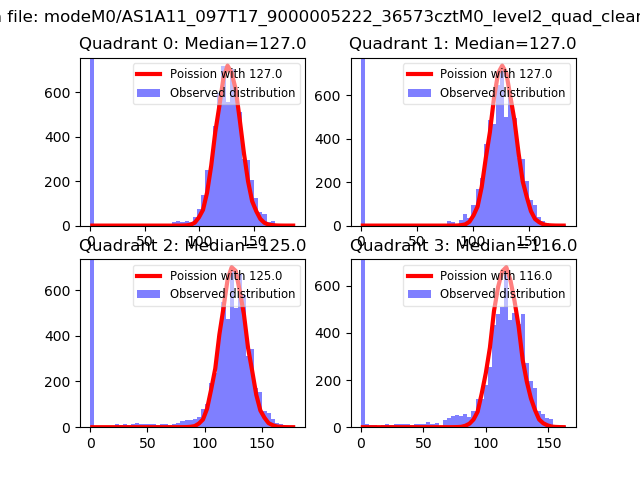 |
 |
| Quadrant-wise count rates Data is divided into 100 sec bins |
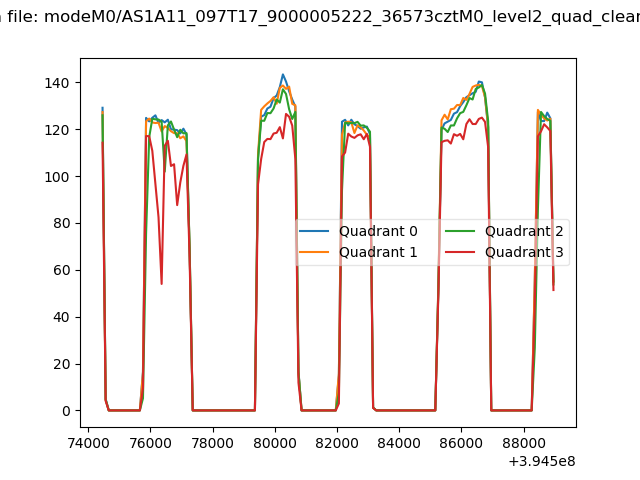 |
|
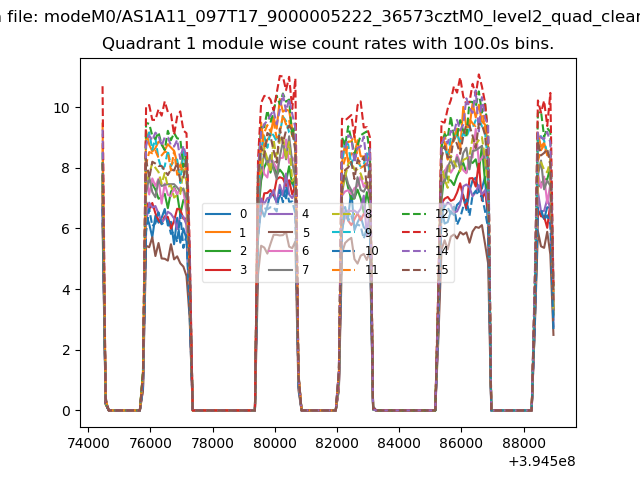
| Module-wise count rates for Quadrant A Data is divided into 100 sec bins |
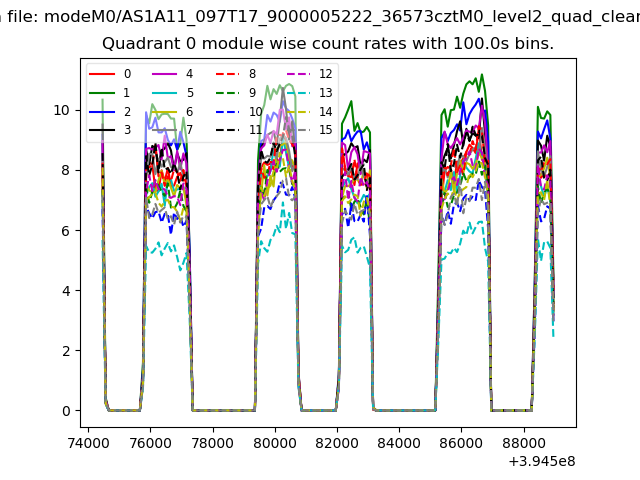 |
 |
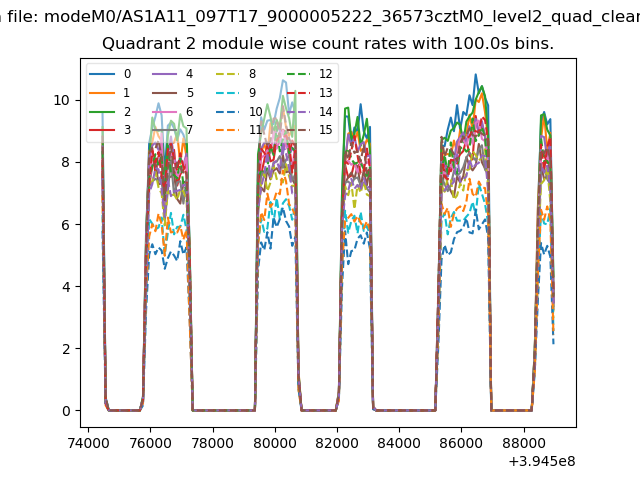
| Module-wise count rates for Quadrant B Data is divided into 100 sec bins |
 |
 |
| Module-wise count rates for Quadrant C Data is divided into 100 sec bins |
 |
 |
| Module-wise count rates for Quadrant D Data is divided into 100 sec bins |
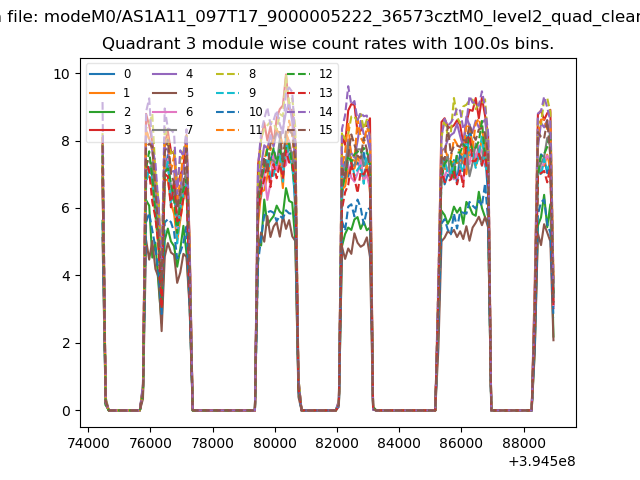 |
 |
| Parameter | Plot |
|---|---|
| CZT HV Monitor | 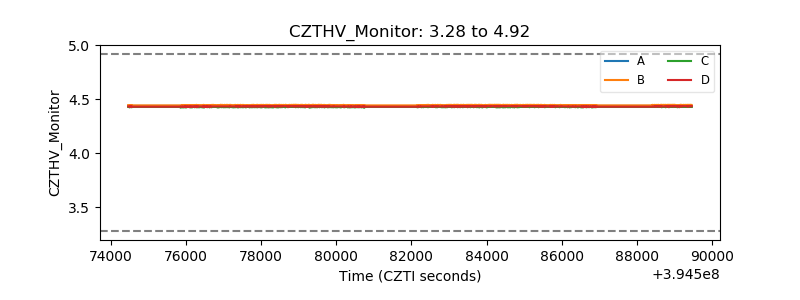 |
| D_VDD | 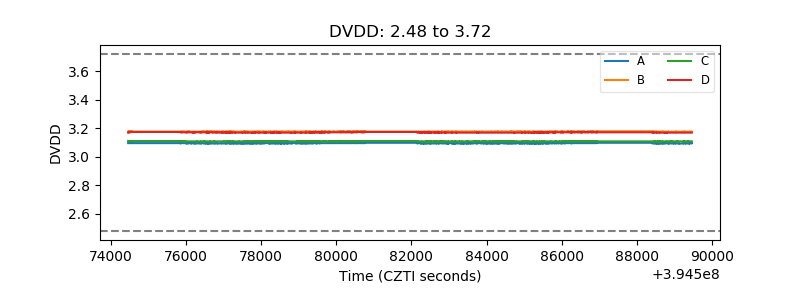 |
| Temperature 1 | 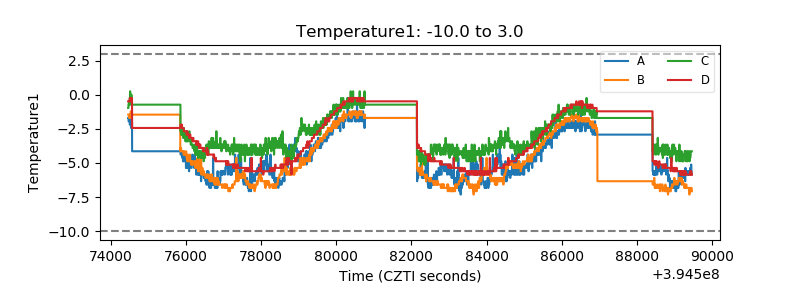 |
| Veto HV Monitor | 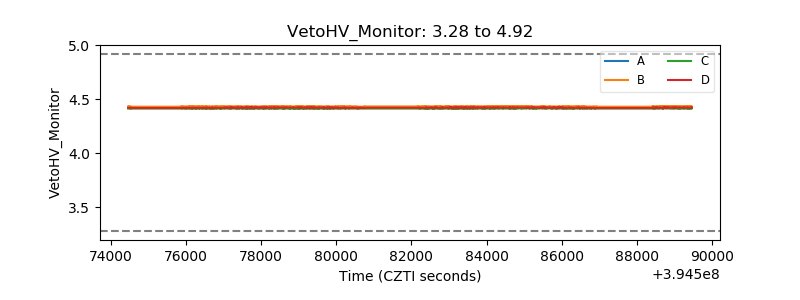 |
| Veto LLD | 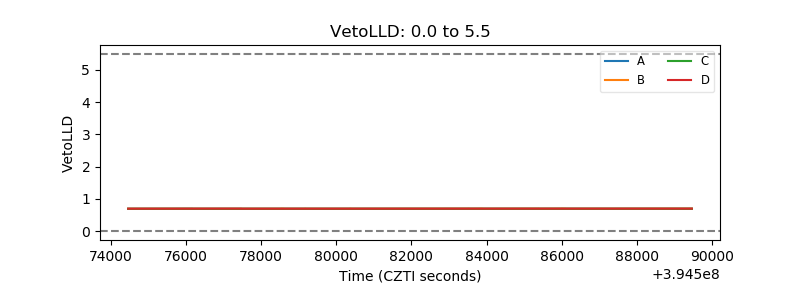 |
| Alpha Counter | 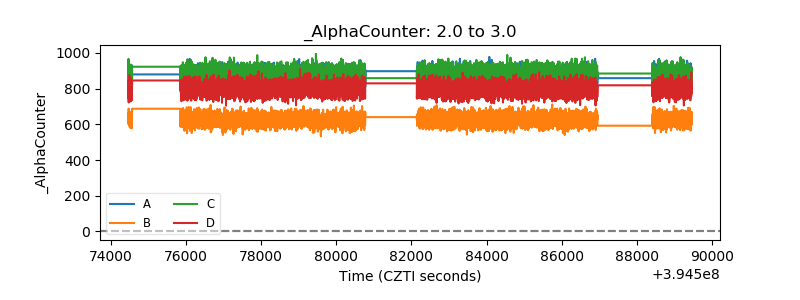 |
| _CPM_Rate | 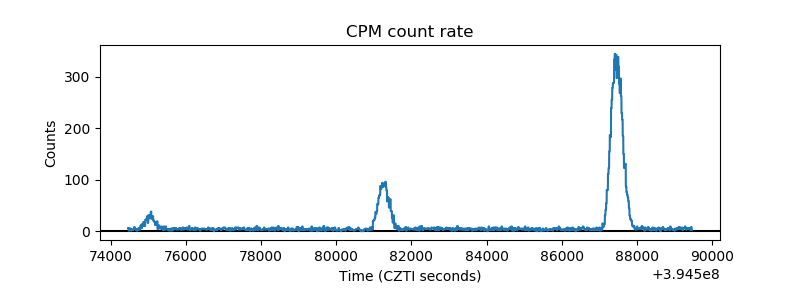 |
| CZT Counter | 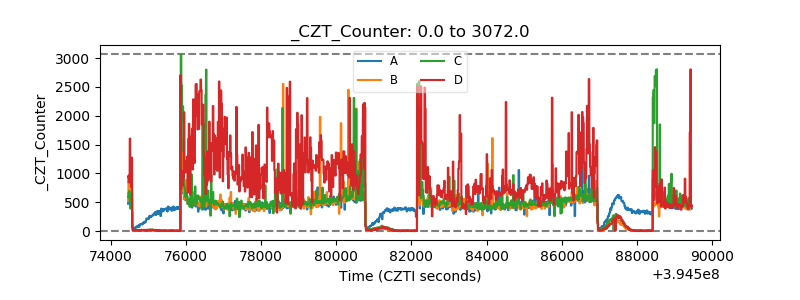 |
| +2.5 Volts monitor |  |
| +5 Volts monitor | 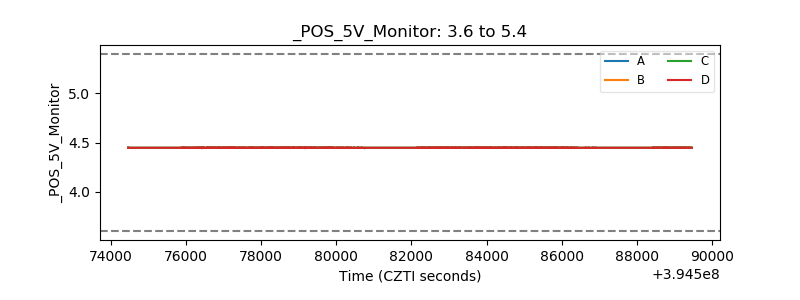 |
| _ROLL_ROT | 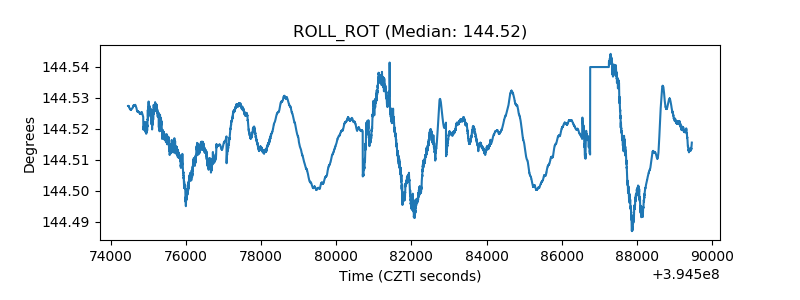 |
| _Roll_DEC | 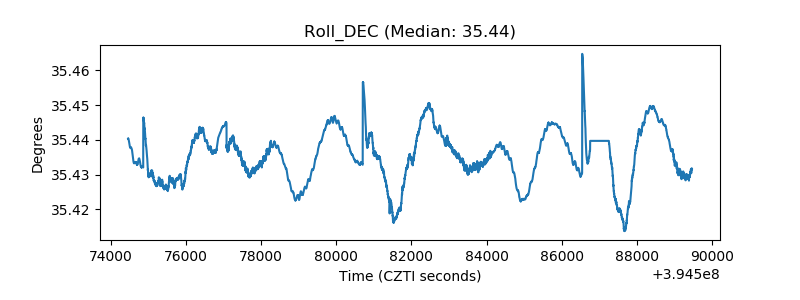 |
| _Roll_RA | 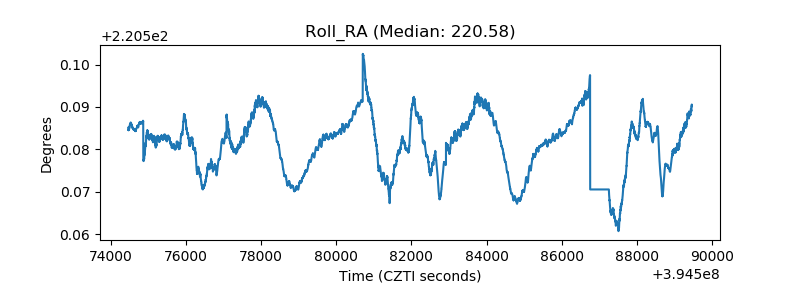 |
| Veto Counter | 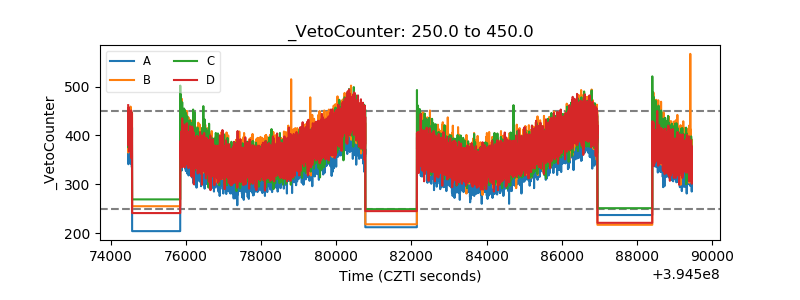 |