| Param | Original file | Final file |
|---|---|---|
| Filename | modeM0/AS1A11_097T17_9000005222_36574cztM0_level2.evt | modeM0/AS1A11_097T17_9000005222_36574cztM0_level2_quad_clean.evt |
| Size (bytes) | 488,666,880 | 66,818,880 |
| Size | 466.0 MB | 63.7 MB |
| Events in quadrant A | 3,008,859 | 410,028 |
| Events in quadrant B | 2,994,297 | 412,217 |
| Events in quadrant C | 3,810,250 | 395,462 |
| Events in quadrant D | 4,569,569 | 376,869 |
| Mode M0 | |||
|---|---|---|---|
| Quadrant | BADHDUFLAG | Total packets | Discarded packets |
| A | 0 | 12829 | 3 |
| B | 0 | 12858 | 2 |
| C | 0 | 15083 | 2 |
| D | 0 | 17902 | 2 |
| Mode M9 | |||
|---|---|---|---|
| Quadrant | BADHDUFLAG | Total packets | Discarded packets |
| A | 0 | 30 | 0 |
| B | 0 | 30 | 0 |
| C | 0 | 30 | 0 |
| D | 0 | 30 | 0 |
| Mode SS | |||
|---|---|---|---|
| Quadrant | BADHDUFLAG | Total packets | Discarded packets |
| A | 0 | 128 | 0 |
| B | 0 | 128 | 0 |
| C | 0 | 128 | 0 |
| D | 0 | 128 | 0 |
| Quadrant | Total seconds | Saturated seconds | Saturation percentage |
|---|---|---|---|
| A | 6130 | 10 | 0.163132% |
| B | 6130 | 16 | 0.261011% |
| C | 6130 | 184 | 3.001631% |
| D | 6130 | 373 | 6.084829% |
Noise dominated data is calculated using 1-second bins in cleaned event files. If a bin has >2000 counts, and if more than 50% of those come from <1% of pixels, then it is considered to be noise-dominated and hence unusable.
| Quadrant | # 1 sec bins | Bins with >0 counts | Bins with >2000 counts | High rate bins dominated by noise | Noise dominated (total time) | Noise dominated (detector-on time) | Marked lightcurve |
|---|---|---|---|---|---|---|---|
| A | 9204 | 6132 | 0 | 0 | 0.00% | 0.00% | 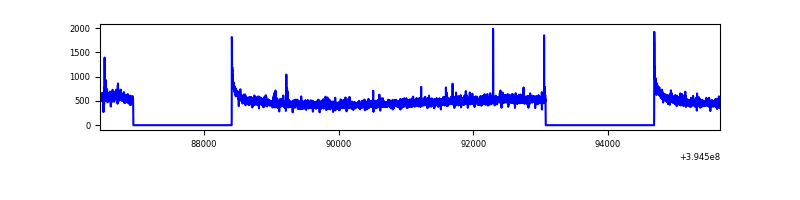 |
| B | 9204 | 6132 | 5 | 5 | 0.05% | 0.08% | 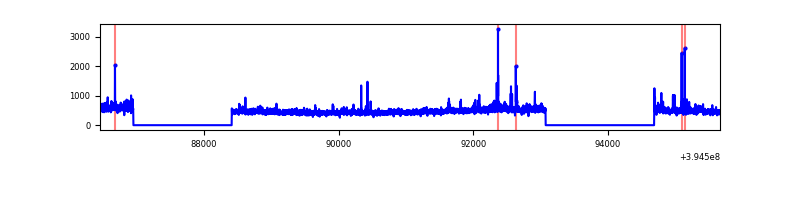 |
| C | 9204 | 6132 | 127 | 127 | 1.38% | 2.07% | 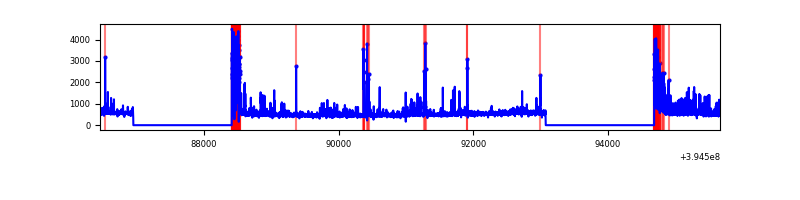 |
| D | 9204 | 6132 | 260 | 260 | 2.82% | 4.24% | 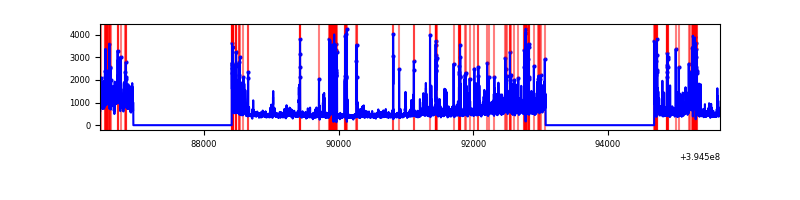 |
Top three noisy pixels from each quadrant. If the there are fewer than three noisy pixels in the level2.evt file, extra rows are filled as -1
| Pixel properties | Quadrant properties | ||||||
|---|---|---|---|---|---|---|---|
| Quadrant | DetID | PixID | Counts | Sigma | Mean | Median | Sigma |
| A | 10 | 83 | 211959 | 1461.97 | 713 | 700 | 144.5 |
| A | 15 | 223 | 17914 | 119.13 | 713 | 700 | 144.5 |
| A | 13 | 210 | 10786 | 69.8 | 713 | 700 | 144.5 |
| B | 5 | 255 | 66744 | 482.44 | 709 | 689 | 136.9 |
| B | 0 | 219 | 34472 | 246.74 | 709 | 689 | 136.9 |
| B | 5 | 172 | 21462 | 151.72 | 709 | 689 | 136.9 |
| C | 0 | 10 | 673663 | 4166.29 | 689 | 693 | 161.5 |
| C | 15 | 214 | 260877 | 1610.77 | 689 | 693 | 161.5 |
| C | 14 | 254 | 144570 | 890.73 | 689 | 693 | 161.5 |
| D | 13 | 249 | 604621 | 3656.29 | 677 | 659 | 165.2 |
| D | 12 | 235 | 461087 | 2787.36 | 677 | 659 | 165.2 |
| D | 12 | 16 | 196277 | 1184.24 | 677 | 659 | 165.2 |
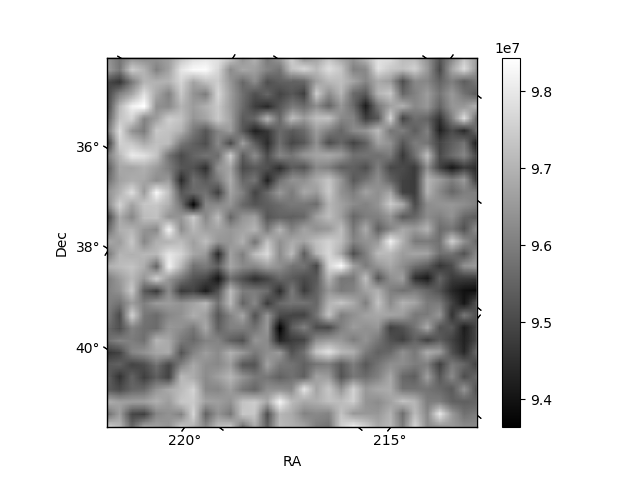
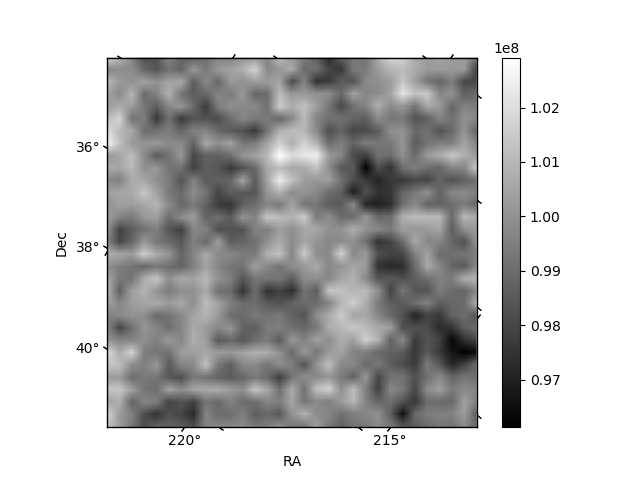
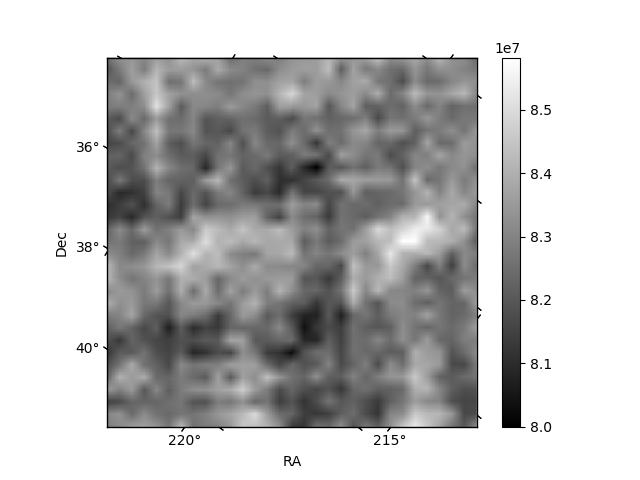
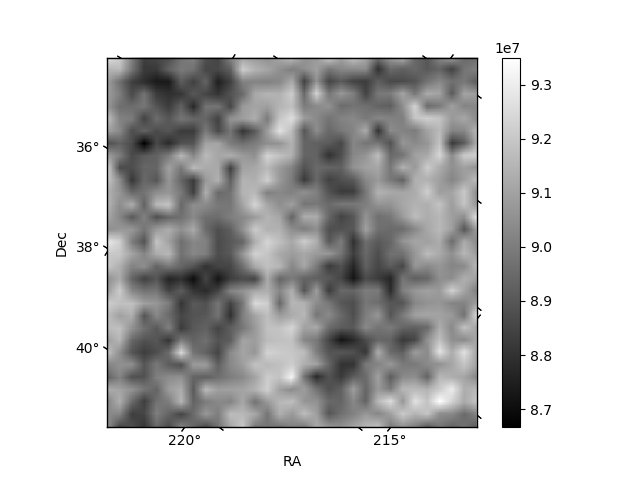
Histogram calculated using DETX and DETY for each event in the final _common_clean file
| Quadrant A | 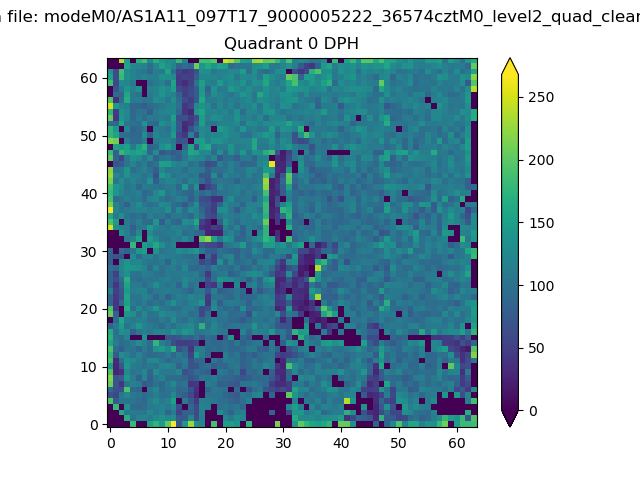 |
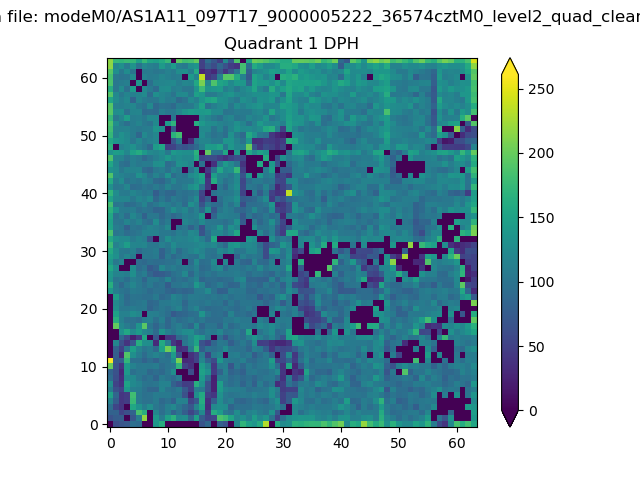 |
Quadrant B |
|---|---|---|---|
| Quadrant D | 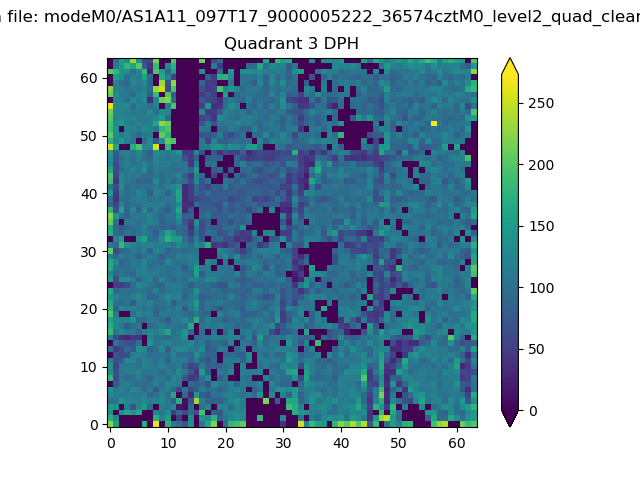 |
 |
Quadrant C |
| Plot type | Count rate plots | Images |
|---|---|---|
| Comparison with Poisson distribution Blue bars denote a histogram of data divided into 1 sec bins. Red curve is a Poisson curve with rate = median count rate of data. |
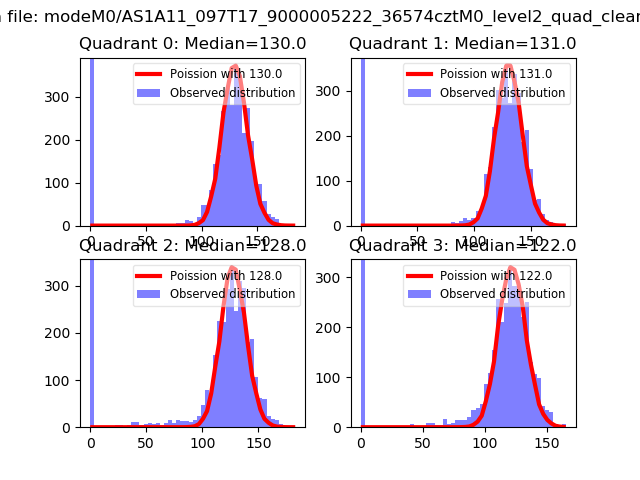 |
 |
| Quadrant-wise count rates Data is divided into 100 sec bins |
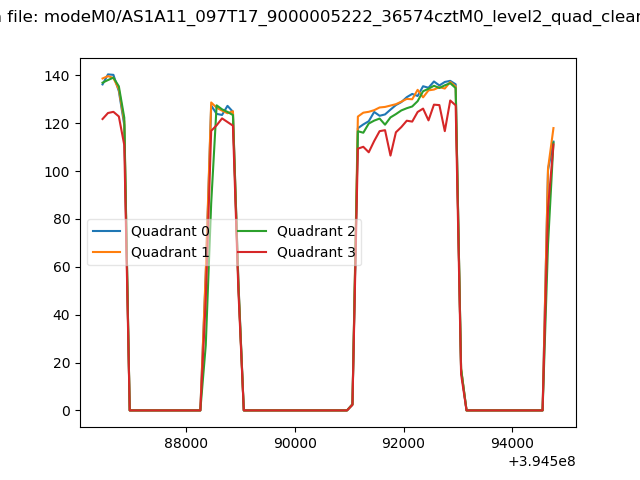 |
|
| Module-wise count rates for Quadrant A Data is divided into 100 sec bins |
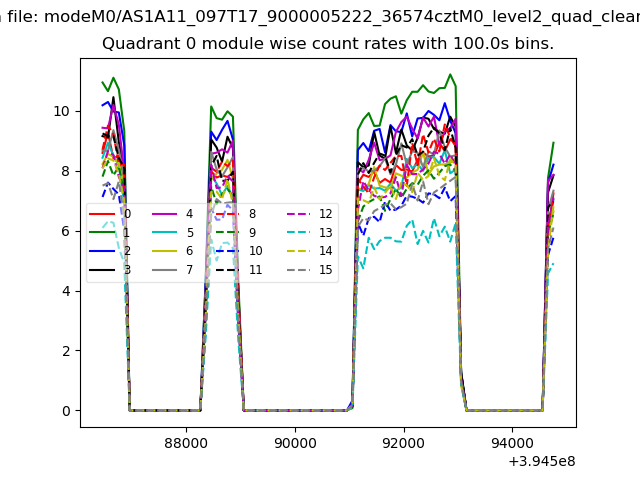 |
 |
| Module-wise count rates for Quadrant B Data is divided into 100 sec bins |
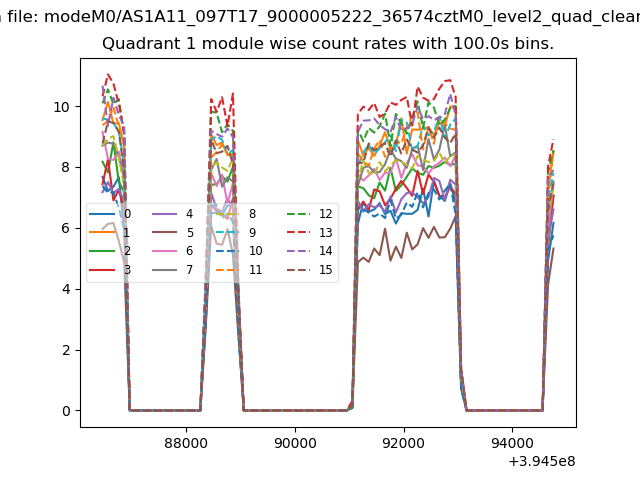 |
 |
| Module-wise count rates for Quadrant C Data is divided into 100 sec bins |
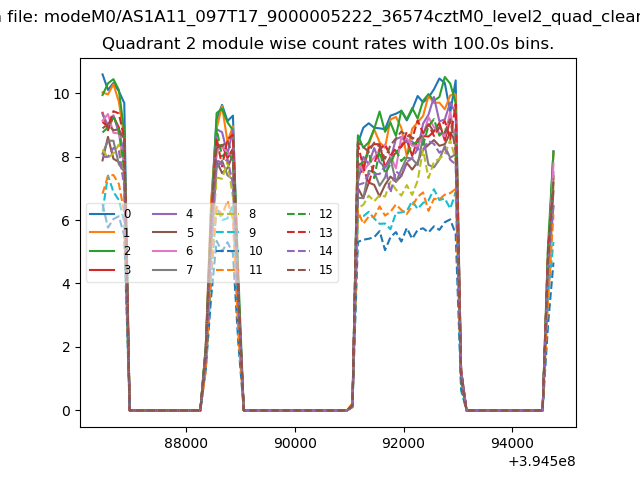 |
 |
| Module-wise count rates for Quadrant D Data is divided into 100 sec bins |
 |
 |
| Parameter | Plot |
|---|---|
| CZT HV Monitor | 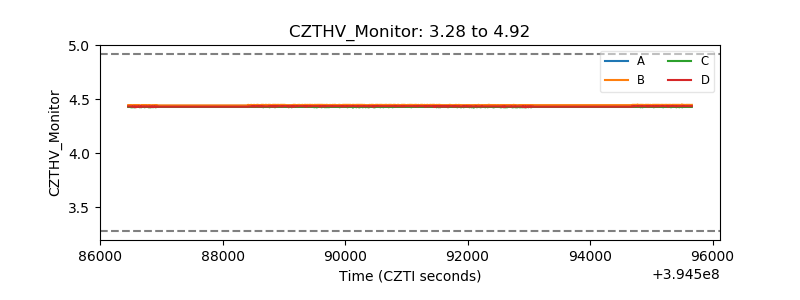 |
| D_VDD | 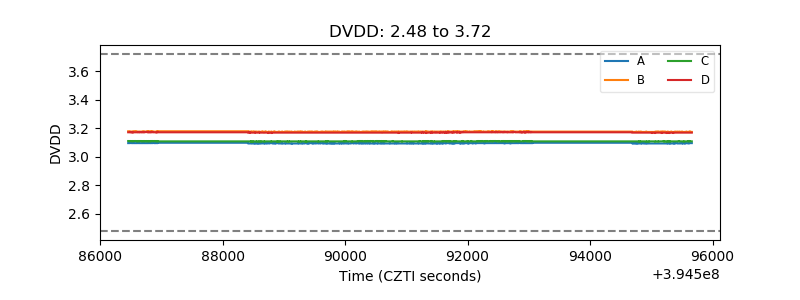 |
| Temperature 1 | 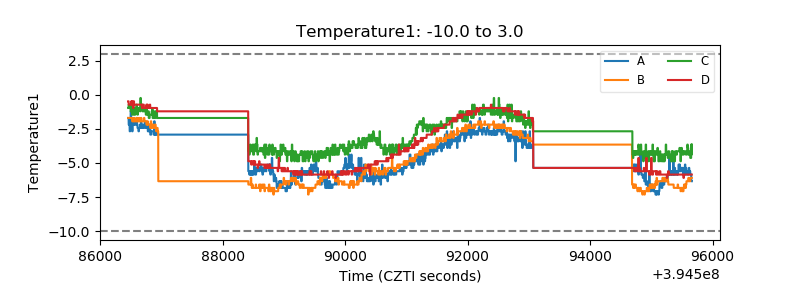 |
| Veto HV Monitor | 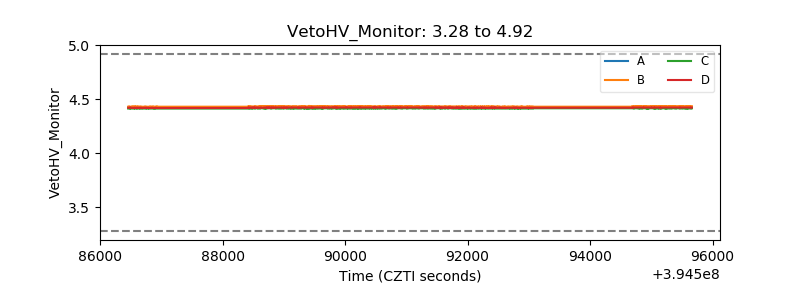 |
| Veto LLD | 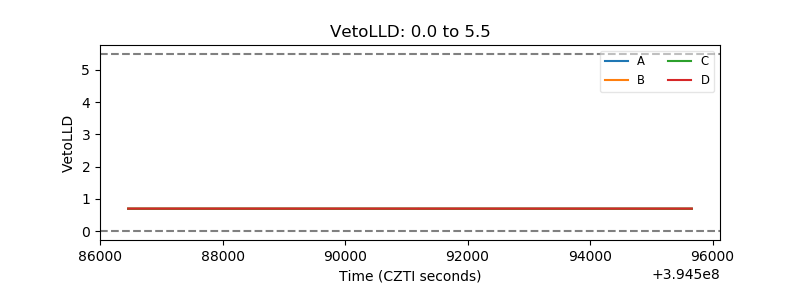 |
| Alpha Counter | 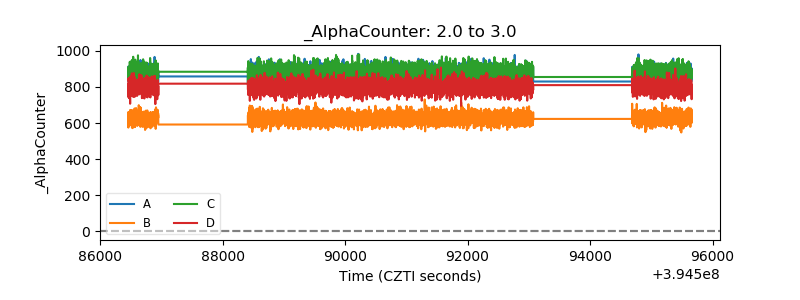 |
| _CPM_Rate | 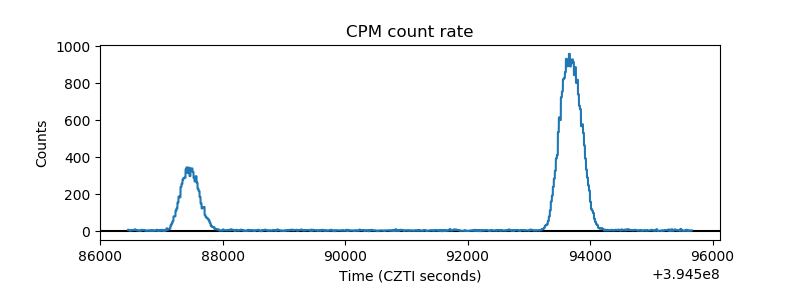 |
| CZT Counter |  |
| +2.5 Volts monitor |  |
| +5 Volts monitor |  |
| _ROLL_ROT |  |
| _Roll_DEC |  |
| _Roll_RA |  |
| Veto Counter |  |