| Param | Original file | Final file |
|---|---|---|
| Filename | modeM0/AS1A11_097T17_9000005222_36575cztM0_level2.evt | modeM0/AS1A11_097T17_9000005222_36575cztM0_level2_quad_clean.evt |
| Size (bytes) | 446,408,640 | 52,413,120 |
| Size | 425.7 MB | 50.0 MB |
| Events in quadrant A | 2,774,105 | 308,656 |
| Events in quadrant B | 2,816,454 | 309,486 |
| Events in quadrant C | 3,716,772 | 300,614 |
| Events in quadrant D | 3,840,121 | 284,377 |
| Mode M0 | |||
|---|---|---|---|
| Quadrant | BADHDUFLAG | Total packets | Discarded packets |
| A | 0 | 11634 | 3 |
| B | 0 | 11861 | 2 |
| C | 0 | 14551 | 2 |
| D | 0 | 15145 | 2 |
| Mode M9 | |||
|---|---|---|---|
| Quadrant | BADHDUFLAG | Total packets | Discarded packets |
| A | 0 | 18 | 0 |
| B | 0 | 18 | 0 |
| C | 0 | 18 | 0 |
| D | 0 | 19 | 0 |
| Mode SS | |||
|---|---|---|---|
| Quadrant | BADHDUFLAG | Total packets | Discarded packets |
| A | 0 | 112 | 0 |
| B | 0 | 112 | 0 |
| C | 0 | 112 | 0 |
| D | 0 | 112 | 0 |
| Quadrant | Total seconds | Saturated seconds | Saturation percentage |
|---|---|---|---|
| A | 5477 | 11 | 0.200840% |
| B | 5477 | 30 | 0.547745% |
| C | 5477 | 156 | 2.848275% |
| D | 5477 | 208 | 3.797699% |
Noise dominated data is calculated using 1-second bins in cleaned event files. If a bin has >2000 counts, and if more than 50% of those come from <1% of pixels, then it is considered to be noise-dominated and hence unusable.
| Quadrant | # 1 sec bins | Bins with >0 counts | Bins with >2000 counts | High rate bins dominated by noise | Noise dominated (total time) | Noise dominated (detector-on time) | Marked lightcurve |
|---|---|---|---|---|---|---|---|
| A | 7180 | 5478 | 2 | 2 | 0.03% | 0.04% | 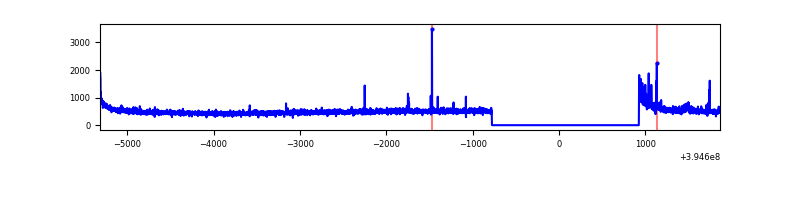 |
| B | 7180 | 5478 | 14 | 14 | 0.19% | 0.26% | 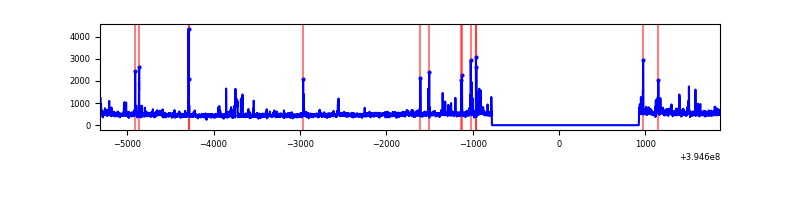 |
| C | 7180 | 5478 | 135 | 135 | 1.88% | 2.46% | 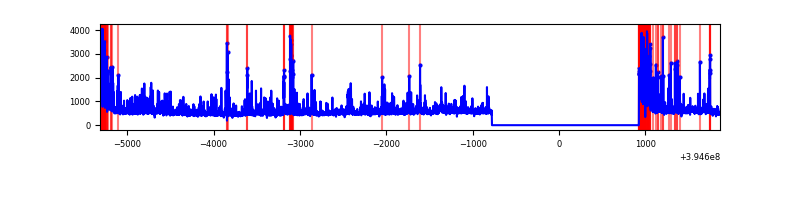 |
| D | 7180 | 5478 | 153 | 153 | 2.13% | 2.79% | 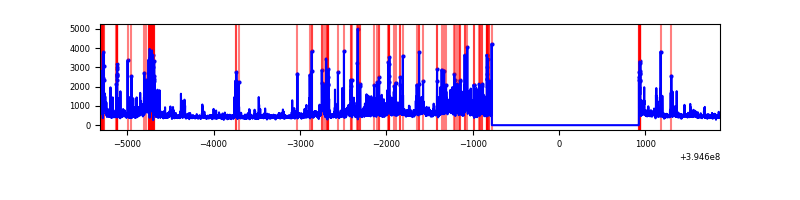 |
Top three noisy pixels from each quadrant. If the there are fewer than three noisy pixels in the level2.evt file, extra rows are filled as -1
| Pixel properties | Quadrant properties | ||||||
|---|---|---|---|---|---|---|---|
| Quadrant | DetID | PixID | Counts | Sigma | Mean | Median | Sigma |
| A | 10 | 83 | 199148 | 1519.28 | 647 | 636 | 130.7 |
| A | 15 | 223 | 51763 | 391.29 | 647 | 636 | 130.7 |
| A | 9 | 143 | 12350 | 89.65 | 647 | 636 | 130.7 |
| B | 5 | 255 | 161849 | 1319.2 | 641 | 625 | 122.2 |
| B | 0 | 213 | 34943 | 280.8 | 641 | 625 | 122.2 |
| B | 0 | 190 | 21333 | 169.44 | 641 | 625 | 122.2 |
| C | 0 | 10 | 756222 | 5178.87 | 622 | 628 | 145.9 |
| C | 15 | 214 | 233448 | 1595.76 | 622 | 628 | 145.9 |
| C | 14 | 254 | 168320 | 1149.37 | 622 | 628 | 145.9 |
| D | 12 | 235 | 639500 | 4273.5 | 617 | 602 | 149.5 |
| D | 13 | 249 | 300414 | 2005.4 | 617 | 602 | 149.5 |
| D | 12 | 16 | 116991 | 778.51 | 617 | 602 | 149.5 |
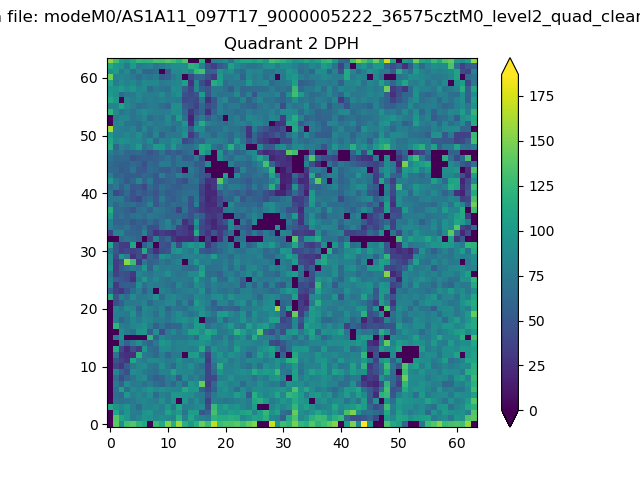
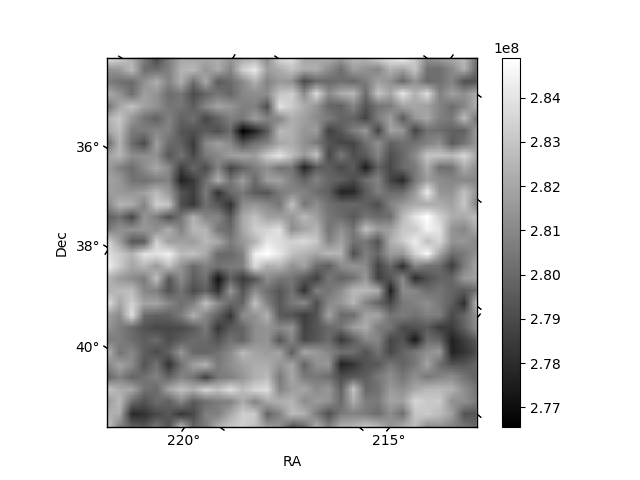
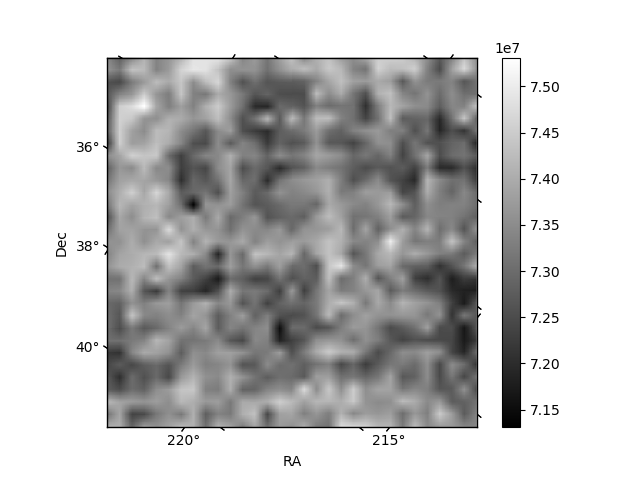
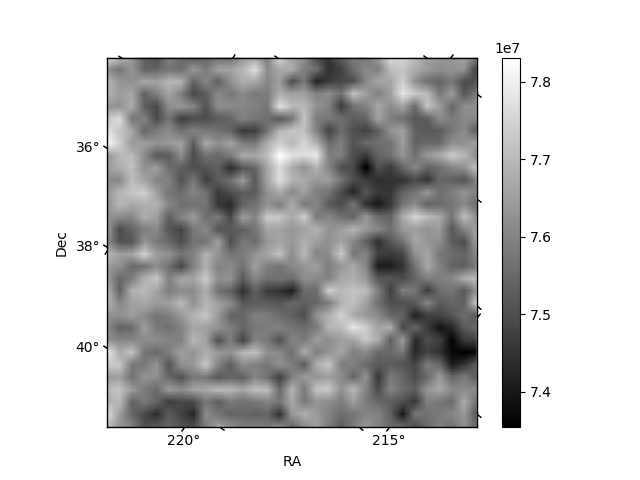
Histogram calculated using DETX and DETY for each event in the final _common_clean file
| Quadrant A | 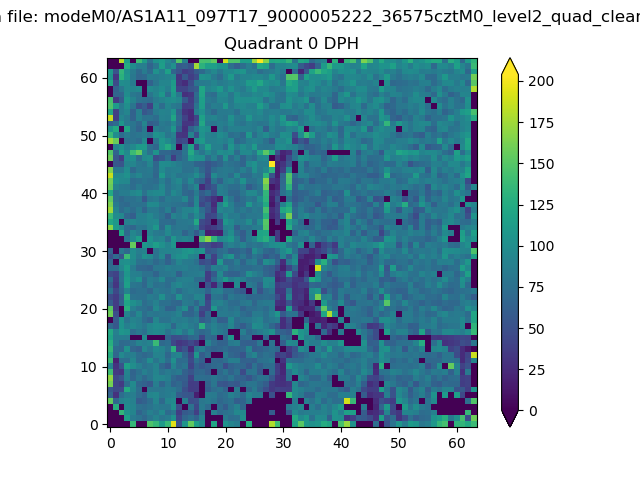 |
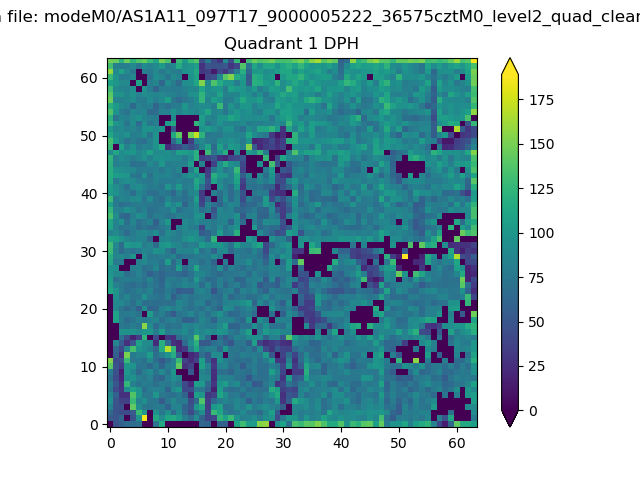 |
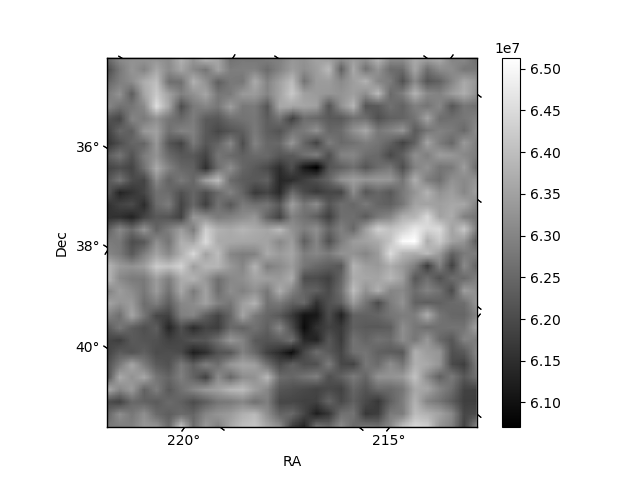
Quadrant B |
|---|---|---|---|
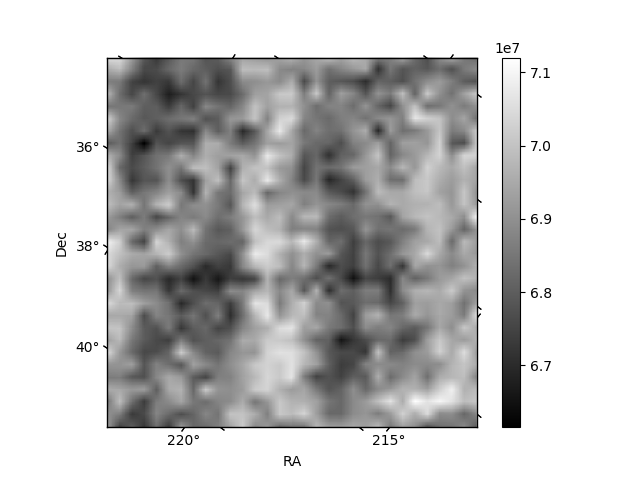
| Quadrant D | 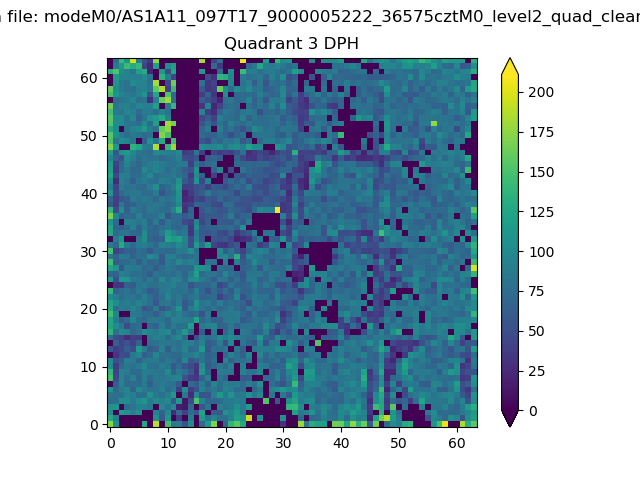 |
 |
Quadrant C |
| Plot type | Count rate plots | Images |
|---|---|---|
| Comparison with Poisson distribution Blue bars denote a histogram of data divided into 1 sec bins. Red curve is a Poisson curve with rate = median count rate of data. |
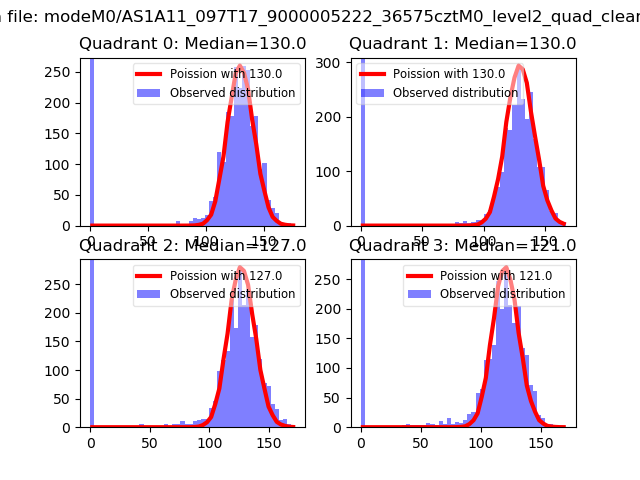 |
 |
| Quadrant-wise count rates Data is divided into 100 sec bins |
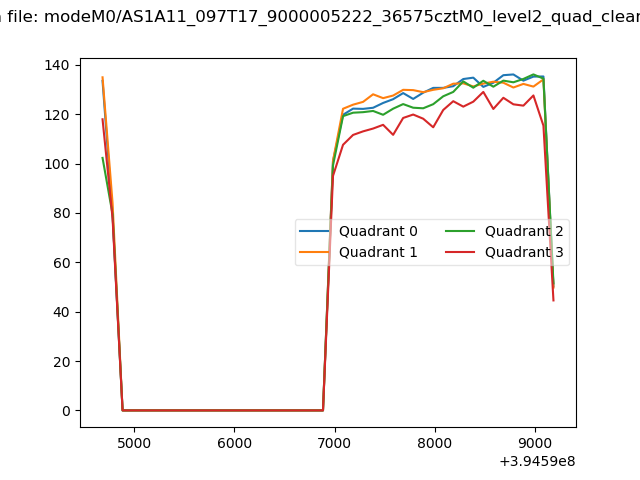 |
|
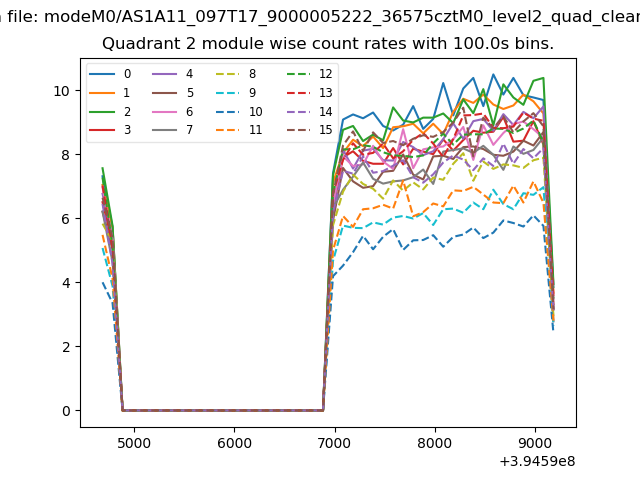
| Module-wise count rates for Quadrant A Data is divided into 100 sec bins |
 |
 |
| Module-wise count rates for Quadrant B Data is divided into 100 sec bins |
 |
 |
| Module-wise count rates for Quadrant C Data is divided into 100 sec bins |
 |
 |
| Module-wise count rates for Quadrant D Data is divided into 100 sec bins |
 |
 |
| Parameter | Plot |
|---|---|
| CZT HV Monitor | 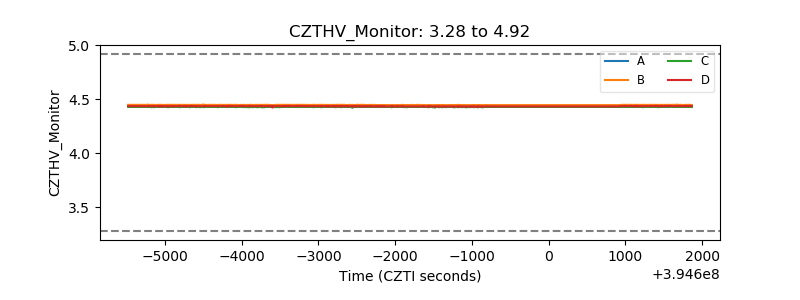 |
| D_VDD | 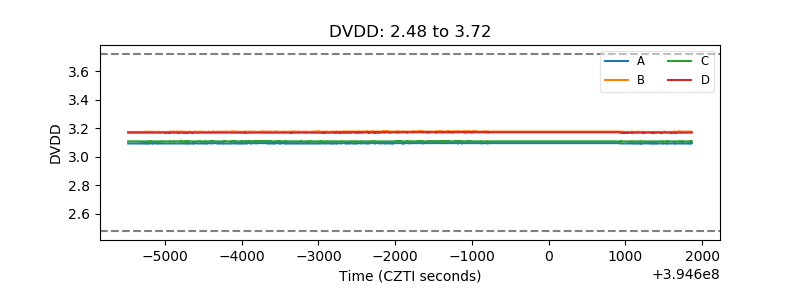 |
| Temperature 1 | 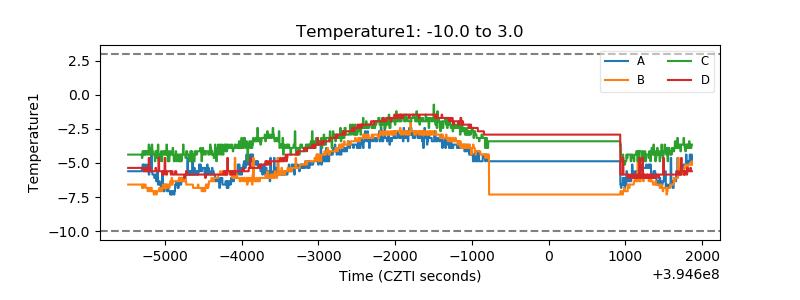 |
| Veto HV Monitor | 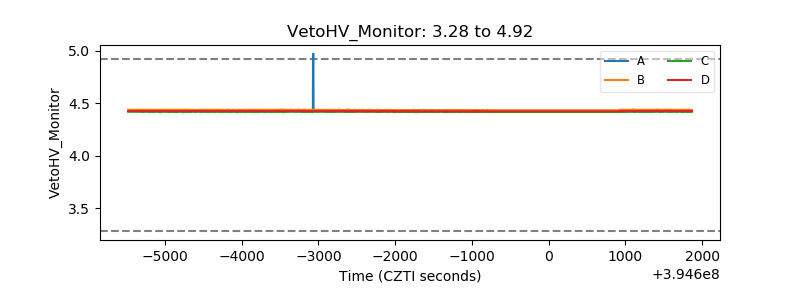 |
| Veto LLD | 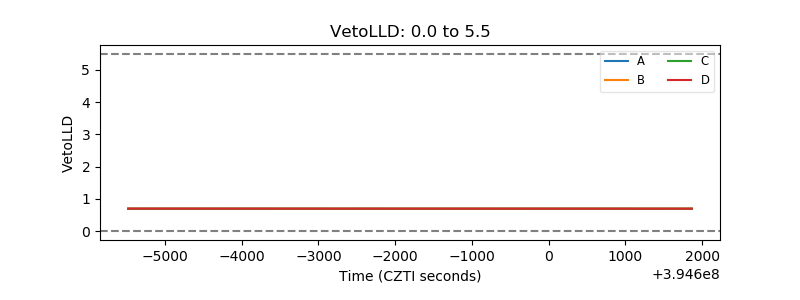 |
| Alpha Counter | 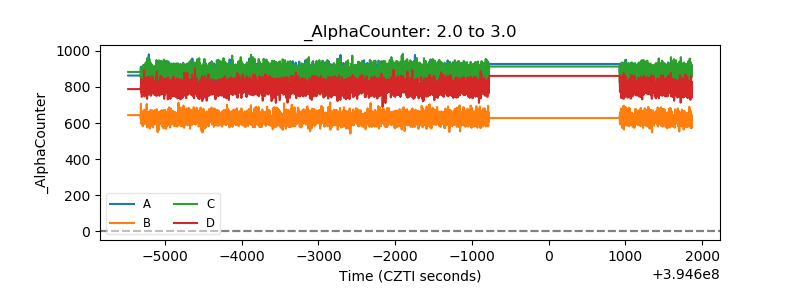 |
| _CPM_Rate | 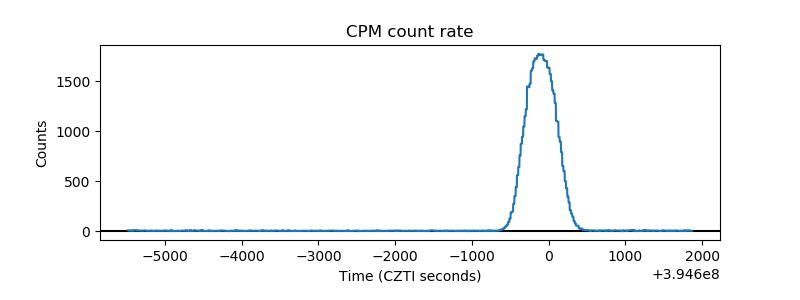 |
| CZT Counter |  |
| +2.5 Volts monitor |  |
| +5 Volts monitor |  |
| _ROLL_ROT | 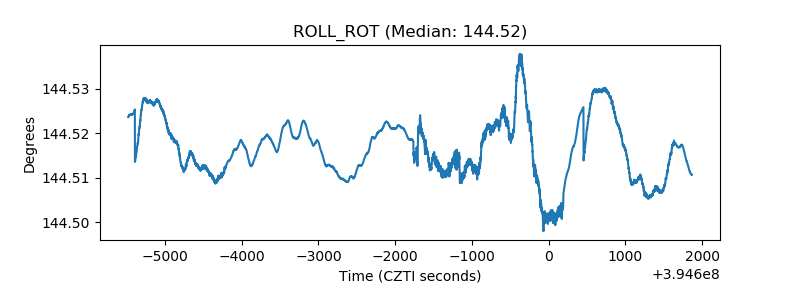 |
| _Roll_DEC | 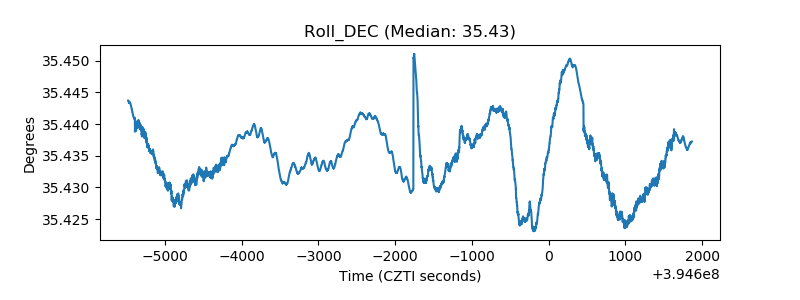 |
| _Roll_RA | 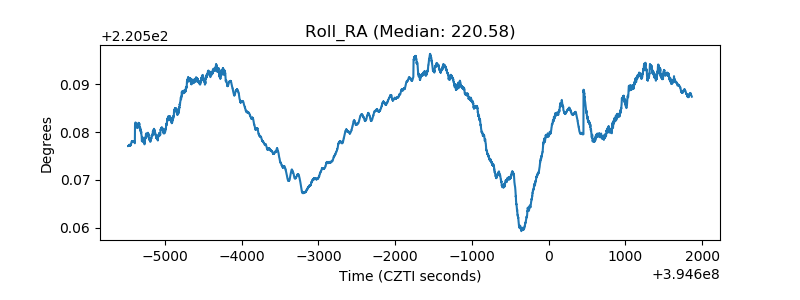 |
| Veto Counter | 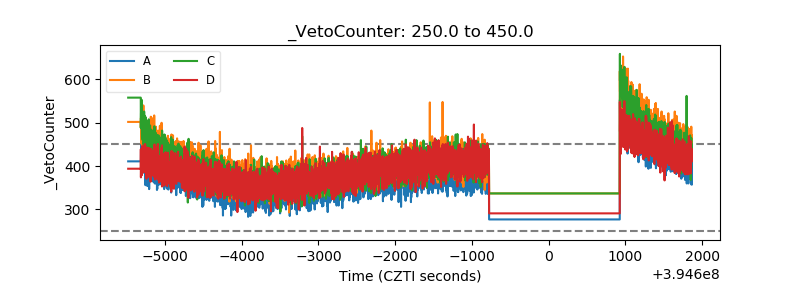 |