| Param | Original file | Final file |
|---|---|---|
| Filename | modeM0/AS1A11_097T17_9000005222_36577cztM0_level2.evt | modeM0/AS1A11_097T17_9000005222_36577cztM0_level2_quad_clean.evt |
| Size (bytes) | 465,350,400 | 55,802,880 |
| Size | 443.8 MB | 53.2 MB |
| Events in quadrant A | 2,984,892 | 337,678 |
| Events in quadrant B | 2,874,886 | 342,185 |
| Events in quadrant C | 3,618,669 | 332,374 |
| Events in quadrant D | 4,246,967 | 297,640 |
| Mode M0 | |||
|---|---|---|---|
| Quadrant | BADHDUFLAG | Total packets | Discarded packets |
| A | 0 | 12049 | 3 |
| B | 0 | 11783 | 2 |
| C | 0 | 13992 | 2 |
| D | 0 | 16190 | 2 |
| Mode M9 | |||
|---|---|---|---|
| Quadrant | BADHDUFLAG | Total packets | Discarded packets |
| A | 0 | 24 | 0 |
| B | 0 | 24 | 0 |
| C | 0 | 24 | 0 |
| D | 0 | 25 | 0 |
| Mode SS | |||
|---|---|---|---|
| Quadrant | BADHDUFLAG | Total packets | Discarded packets |
| A | 0 | 110 | 0 |
| B | 0 | 110 | 0 |
| C | 0 | 110 | 0 |
| D | 0 | 110 | 0 |
| Quadrant | Total seconds | Saturated seconds | Saturation percentage |
|---|---|---|---|
| A | 5420 | 27 | 0.498155% |
| B | 5420 | 13 | 0.239852% |
| C | 5420 | 209 | 3.856089% |
| D | 5420 | 365 | 6.734317% |
Noise dominated data is calculated using 1-second bins in cleaned event files. If a bin has >2000 counts, and if more than 50% of those come from <1% of pixels, then it is considered to be noise-dominated and hence unusable.
| Quadrant | # 1 sec bins | Bins with >0 counts | Bins with >2000 counts | High rate bins dominated by noise | Noise dominated (total time) | Noise dominated (detector-on time) | Marked lightcurve |
|---|---|---|---|---|---|---|---|
| A | 7243 | 5421 | 9 | 9 | 0.12% | 0.17% | 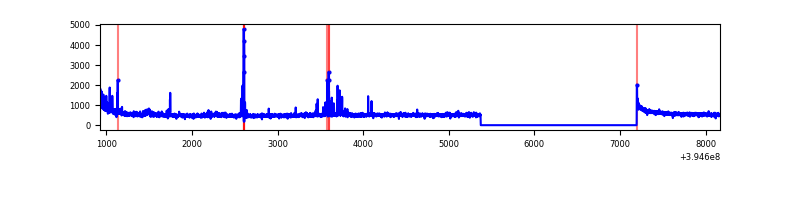 |
| B | 7243 | 5421 | 3 | 3 | 0.04% | 0.06% | 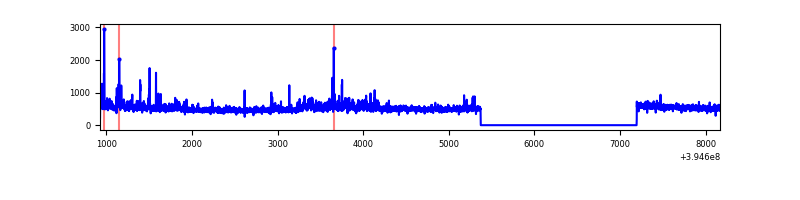 |
| C | 7243 | 5421 | 155 | 155 | 2.14% | 2.86% | 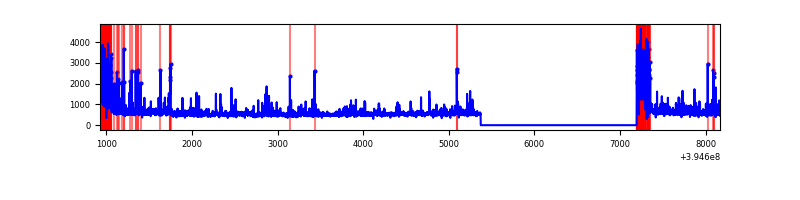 |
| D | 7243 | 5421 | 296 | 296 | 4.09% | 5.46% | 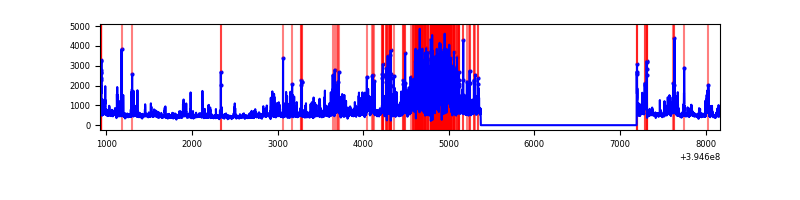 |
Top three noisy pixels from each quadrant. If the there are fewer than three noisy pixels in the level2.evt file, extra rows are filled as -1
| Pixel properties | Quadrant properties | ||||||
|---|---|---|---|---|---|---|---|
| Quadrant | DetID | PixID | Counts | Sigma | Mean | Median | Sigma |
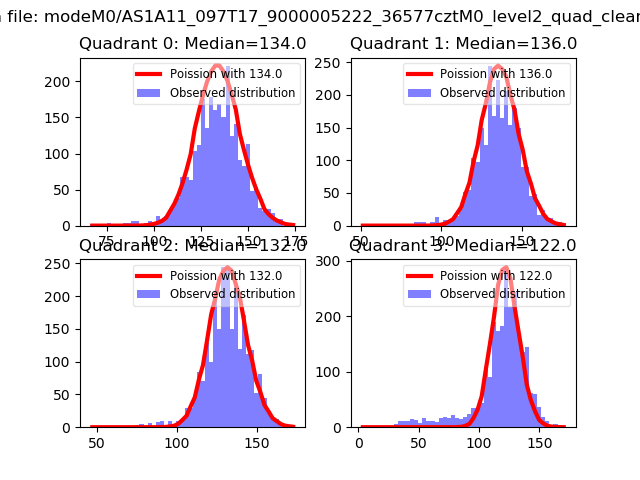
| A | 10 | 83 | 199819 | 1474.91 | 670 | 659 | 135.0 |
| A | 15 | 223 | 122589 | 902.97 | 670 | 659 | 135.0 |
| A | 9 | 143 | 61213 | 448.44 | 670 | 659 | 135.0 |
| B | 0 | 213 | 119759 | 933.96 | 668 | 651 | 127.5 |
| B | 5 | 255 | 50578 | 391.49 | 668 | 651 | 127.5 |
| B | 0 | 219 | 20340 | 154.39 | 668 | 651 | 127.5 |
| C | 0 | 10 | 703013 | 4771.27 | 634 | 641 | 147.2 |
| C | 15 | 214 | 230244 | 1559.71 | 634 | 641 | 147.2 |
| C | 0 | 207 | 118190 | 798.52 | 634 | 641 | 147.2 |
| D | 12 | 235 | 985467 | 6487.89 | 628 | 613 | 151.8 |
| D | 13 | 249 | 210982 | 1385.84 | 628 | 613 | 151.8 |
| D | 12 | 16 | 157411 | 1032.93 | 628 | 613 | 151.8 |
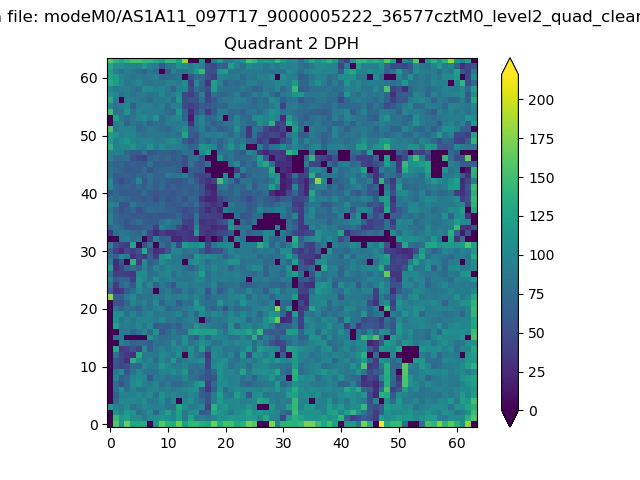
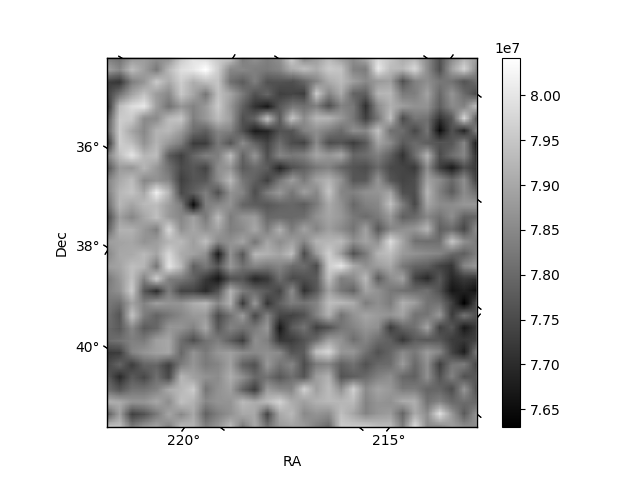
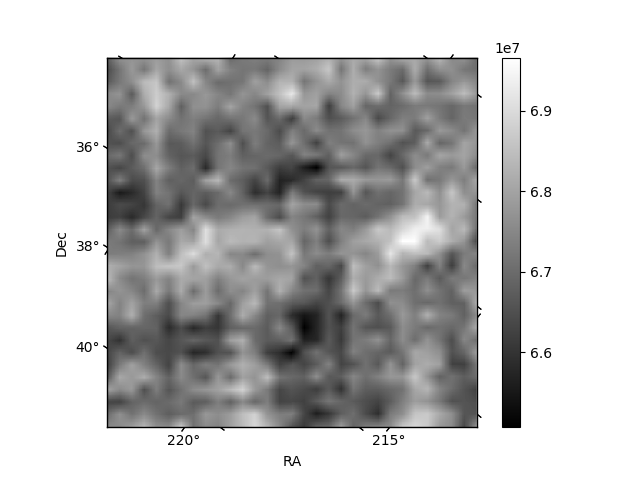
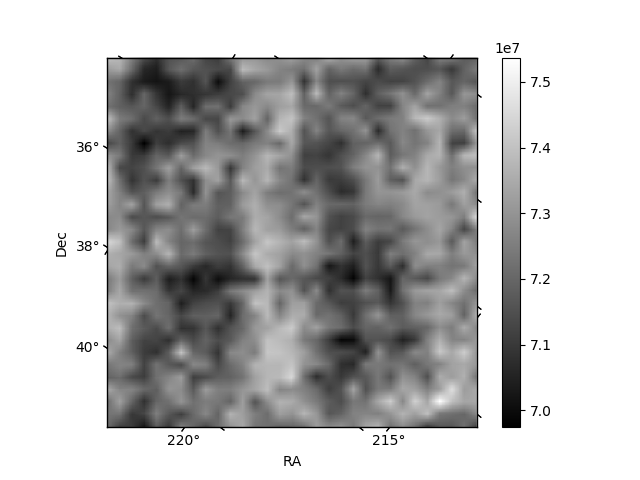
Histogram calculated using DETX and DETY for each event in the final _common_clean file
| Quadrant A | 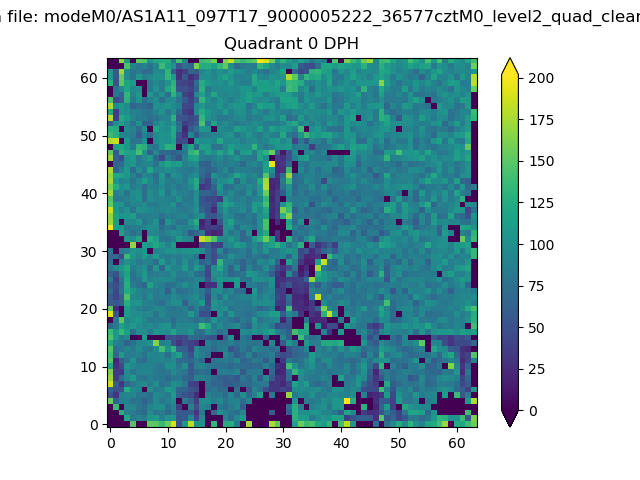 |
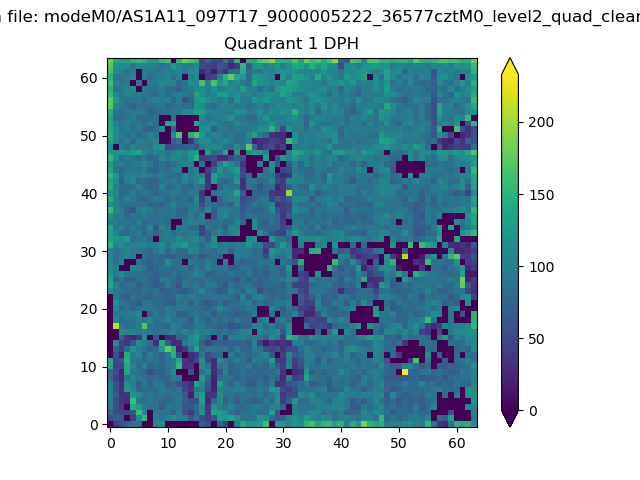 |
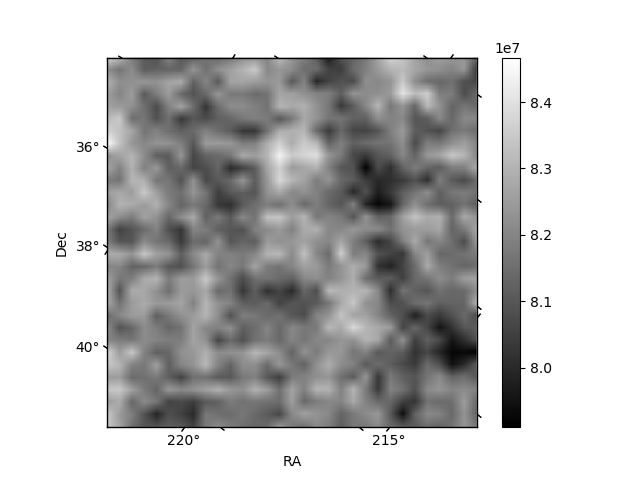
Quadrant B |
|---|---|---|---|
| Quadrant D | 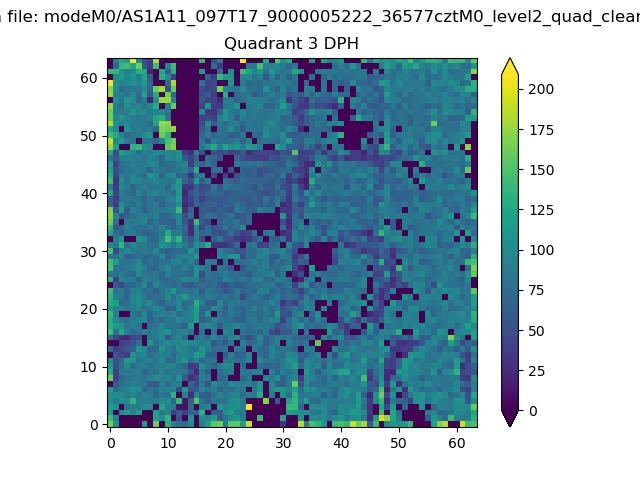 |
 |
Quadrant C |
| Plot type | Count rate plots | Images |
|---|---|---|
| Comparison with Poisson distribution Blue bars denote a histogram of data divided into 1 sec bins. Red curve is a Poisson curve with rate = median count rate of data. |
 |
 |
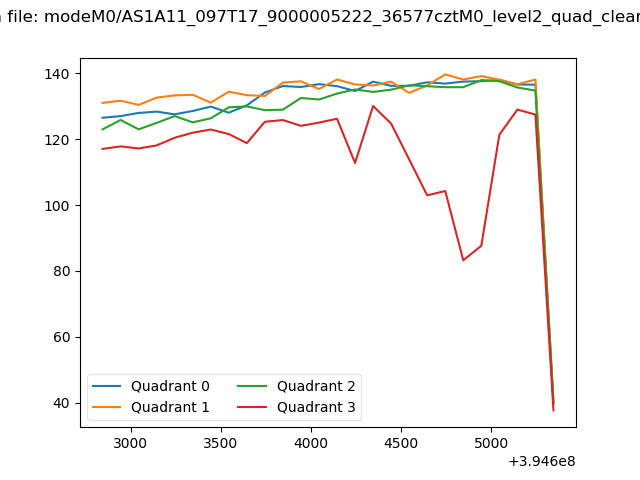
| Quadrant-wise count rates Data is divided into 100 sec bins |
 |
|
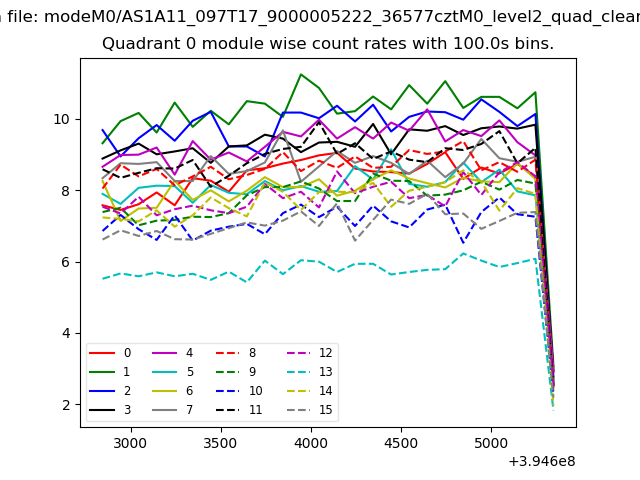
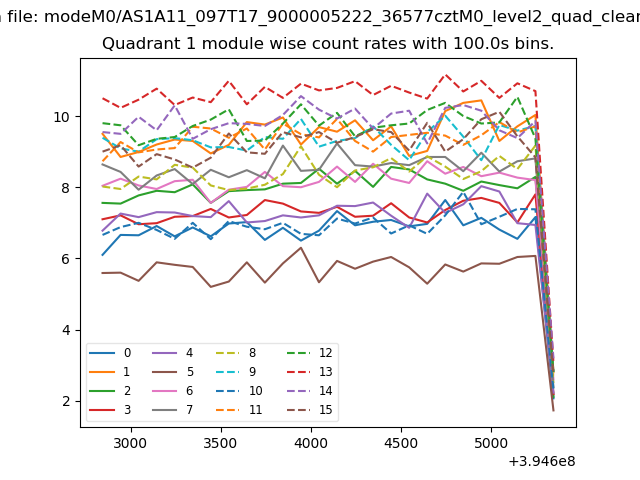
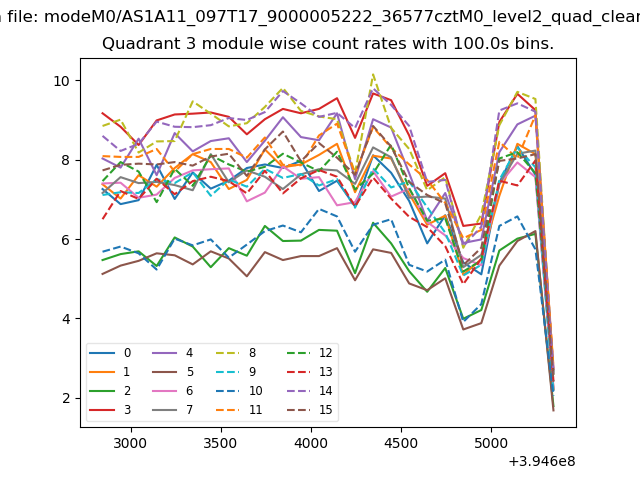
| Module-wise count rates for Quadrant A Data is divided into 100 sec bins |
 |
 |
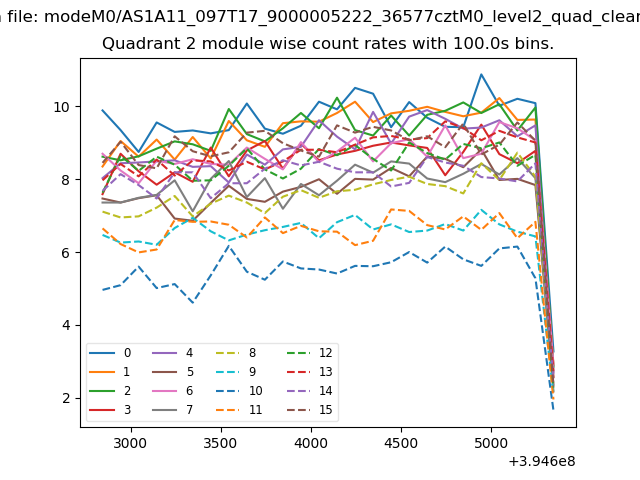
| Module-wise count rates for Quadrant B Data is divided into 100 sec bins |
 |
 |
| Module-wise count rates for Quadrant C Data is divided into 100 sec bins |
 |
 |
| Module-wise count rates for Quadrant D Data is divided into 100 sec bins |
 |
 |
| Parameter | Plot |
|---|---|
| CZT HV Monitor | 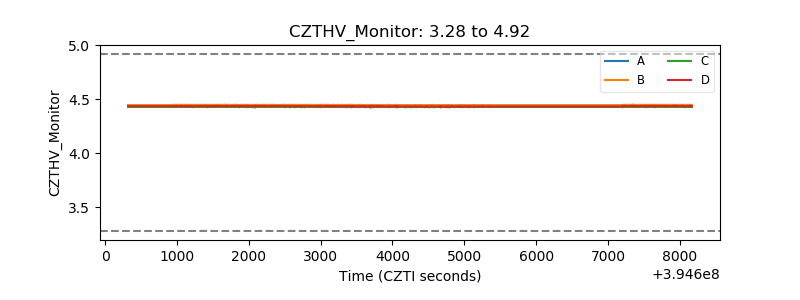 |
| D_VDD | 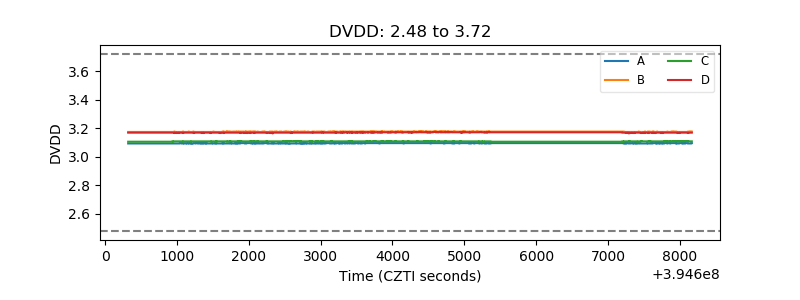 |
| Temperature 1 |  |
| Veto HV Monitor | 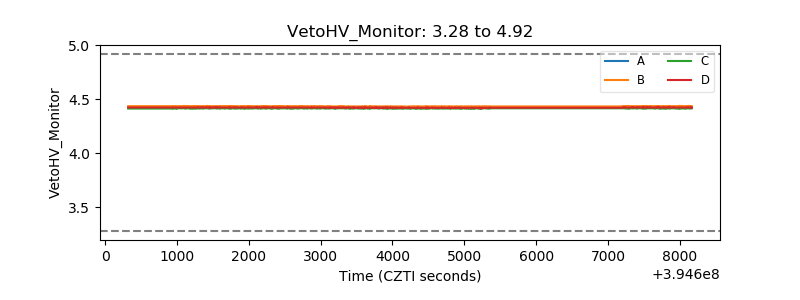 |
| Veto LLD | 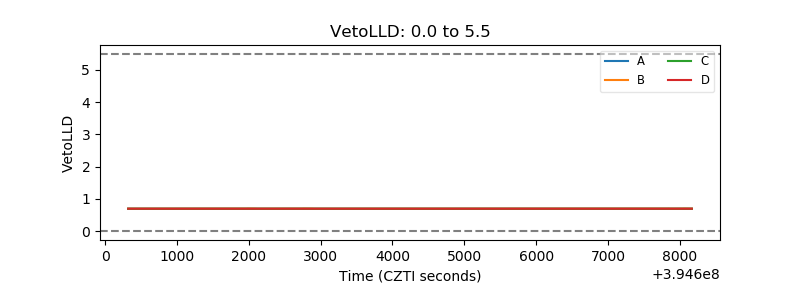 |
| Alpha Counter | 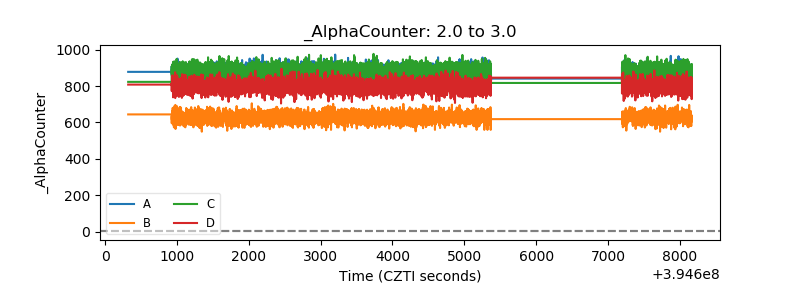 |
| _CPM_Rate | 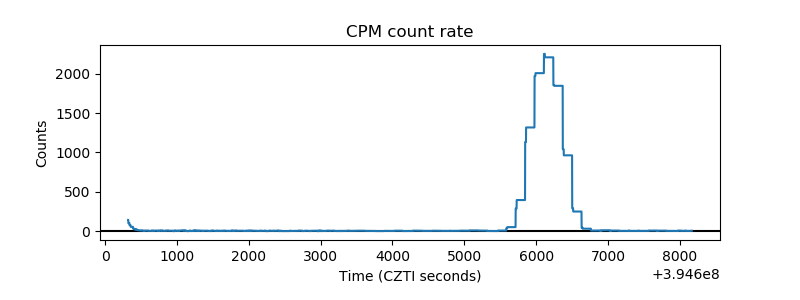 |
| CZT Counter | 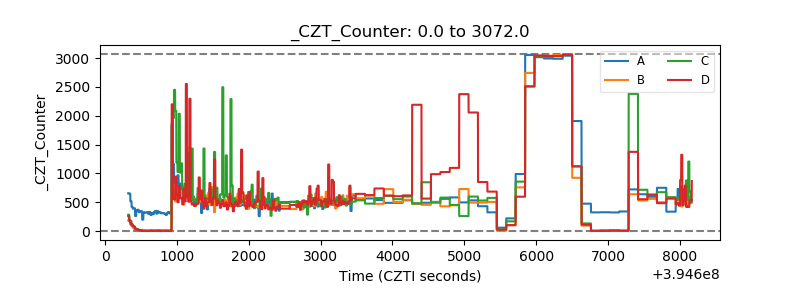 |
| +2.5 Volts monitor | 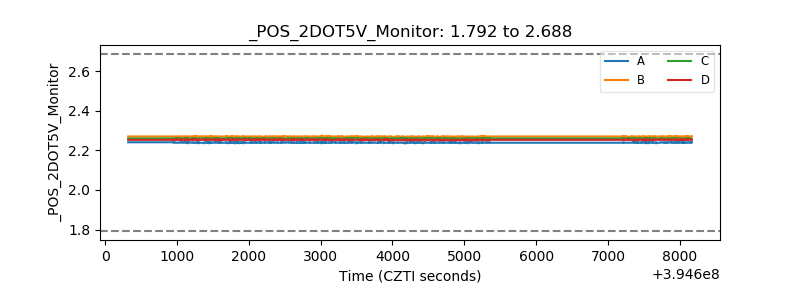 |
| +5 Volts monitor | 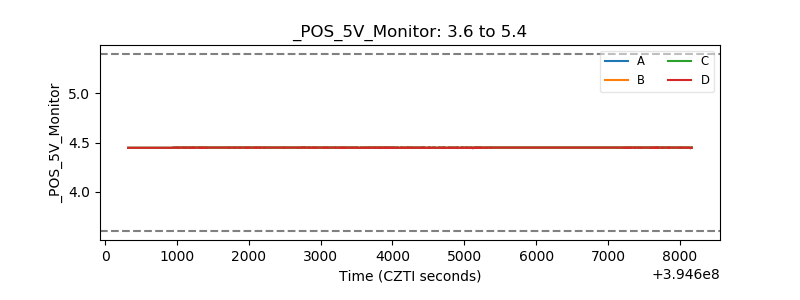 |
| _ROLL_ROT | 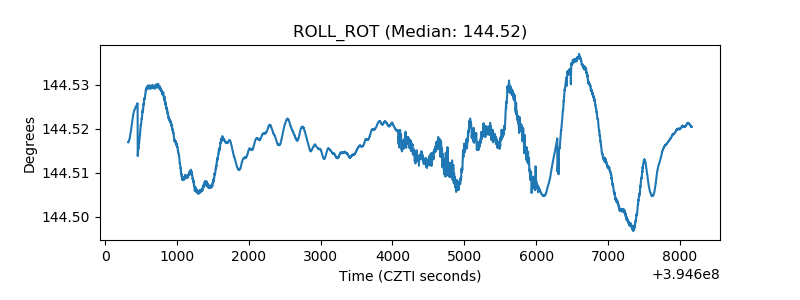 |
| _Roll_DEC |  |
| _Roll_RA | 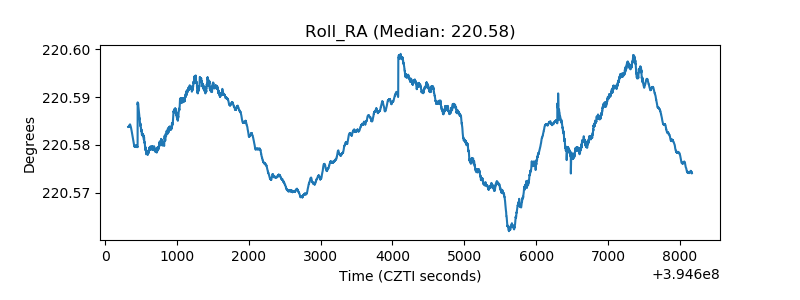 |
| Veto Counter | 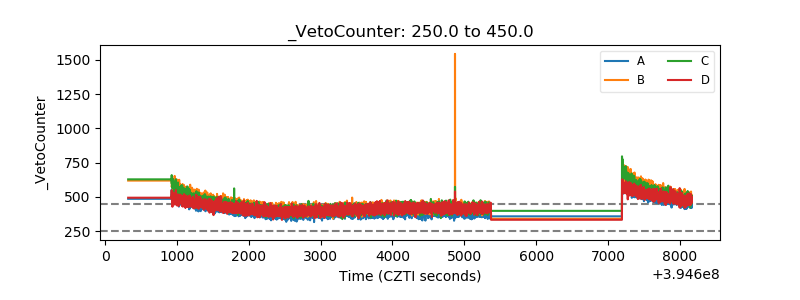 |