| Param | Original file | Final file |
|---|---|---|
| Filename | modeM0/AS1A11_097T17_9000005222_36578cztM0_level2.evt | modeM0/AS1A11_097T17_9000005222_36578cztM0_level2_quad_clean.evt |
| Size (bytes) | 461,131,200 | 62,867,520 |
| Size | 439.8 MB | 60.0 MB |
| Events in quadrant A | 2,905,770 | 394,961 |
| Events in quadrant B | 2,730,516 | 400,044 |
| Events in quadrant C | 3,690,283 | 384,597 |
| Events in quadrant D | 4,288,557 | 362,001 |
| Mode M0 | |||
|---|---|---|---|
| Quadrant | BADHDUFLAG | Total packets | Discarded packets |
| A | 0 | 11650 | 3 |
| B | 0 | 11042 | 2 |
| C | 0 | 14102 | 2 |
| D | 0 | 16226 | 2 |
| Mode M9 | |||
|---|---|---|---|
| Quadrant | BADHDUFLAG | Total packets | Discarded packets |
| A | 0 | 29 | 0 |
| B | 0 | 29 | 0 |
| C | 0 | 29 | 0 |
| D | 0 | 30 | 0 |
| Mode SS | |||
|---|---|---|---|
| Quadrant | BADHDUFLAG | Total packets | Discarded packets |
| A | 0 | 106 | 0 |
| B | 0 | 106 | 0 |
| C | 0 | 106 | 0 |
| D | 0 | 106 | 0 |
| Quadrant | Total seconds | Saturated seconds | Saturation percentage |
|---|---|---|---|
| A | 5163 | 10 | 0.193686% |
| B | 5163 | 7 | 0.135580% |
| C | 5163 | 254 | 4.919620% |
| D | 5163 | 257 | 4.977726% |
Noise dominated data is calculated using 1-second bins in cleaned event files. If a bin has >2000 counts, and if more than 50% of those come from <1% of pixels, then it is considered to be noise-dominated and hence unusable.
| Quadrant | # 1 sec bins | Bins with >0 counts | Bins with >2000 counts | High rate bins dominated by noise | Noise dominated (total time) | Noise dominated (detector-on time) | Marked lightcurve |
|---|---|---|---|---|---|---|---|
| A | 7136 | 5164 | 4 | 4 | 0.06% | 0.08% | 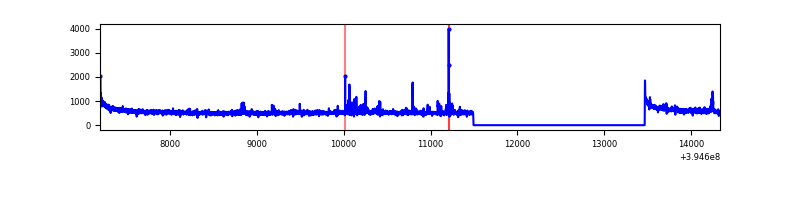 |
| B | 7136 | 5164 | 0 | 0 | 0.00% | 0.00% | 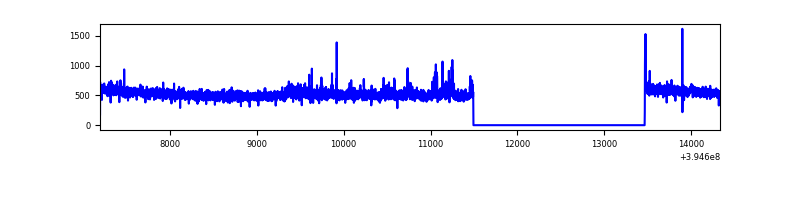 |
| C | 7136 | 5164 | 188 | 188 | 2.63% | 3.64% | 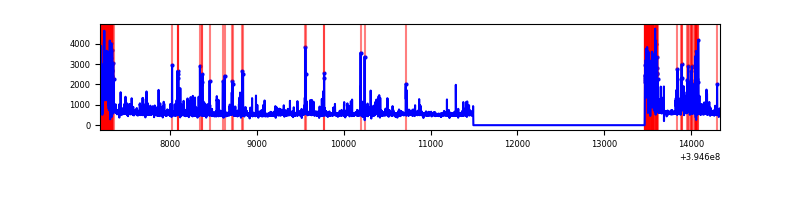 |
| D | 7136 | 5164 | 215 | 215 | 3.01% | 4.16% | 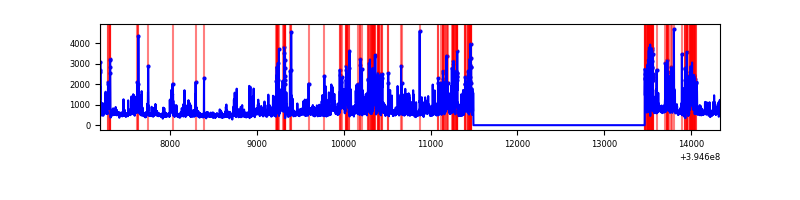 |
Top three noisy pixels from each quadrant. If the there are fewer than three noisy pixels in the level2.evt file, extra rows are filled as -1
| Pixel properties | Quadrant properties | ||||||
|---|---|---|---|---|---|---|---|
| Quadrant | DetID | PixID | Counts | Sigma | Mean | Median | Sigma |
| A | 10 | 83 | 196977 | 1464.62 | 674 | 664 | 134.0 |
| A | 15 | 223 | 92085 | 682.06 | 674 | 664 | 134.0 |
| A | 9 | 143 | 12421 | 87.71 | 674 | 664 | 134.0 |
| B | 0 | 213 | 41691 | 327.5 | 665 | 650 | 125.3 |
| B | 0 | 189 | 27656 | 215.5 | 665 | 650 | 125.3 |
| B | 12 | 111 | 14997 | 114.49 | 665 | 650 | 125.3 |
| C | 0 | 10 | 857287 | 5965.74 | 626 | 633 | 143.6 |
| C | 15 | 214 | 217922 | 1513.2 | 626 | 633 | 143.6 |
| C | 14 | 254 | 134671 | 933.44 | 626 | 633 | 143.6 |
| D | 12 | 235 | 667454 | 4316.15 | 637 | 618 | 154.5 |
| D | 2 | 250 | 248248 | 1602.81 | 637 | 618 | 154.5 |
| D | 12 | 16 | 217211 | 1401.92 | 637 | 618 | 154.5 |
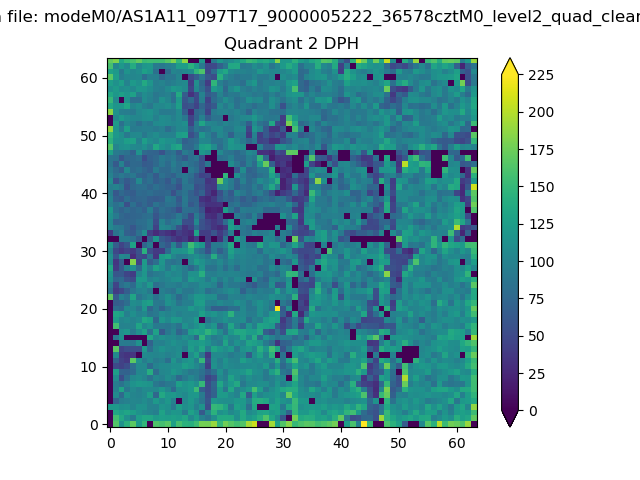
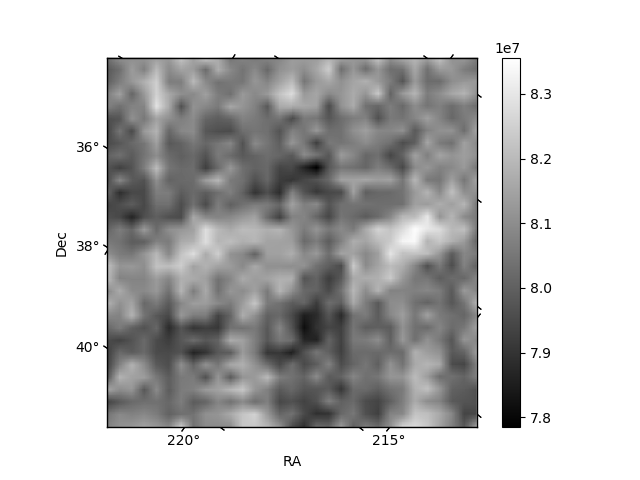
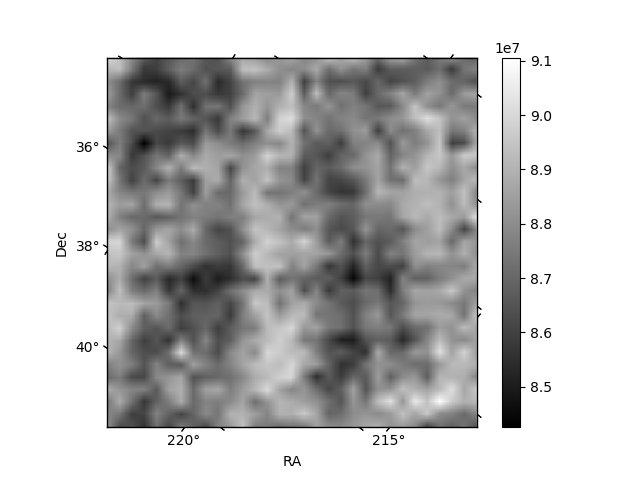
Histogram calculated using DETX and DETY for each event in the final _common_clean file
| Quadrant A | 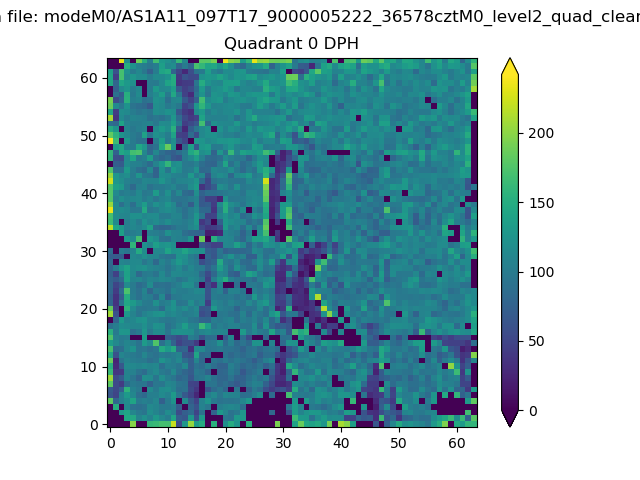 |
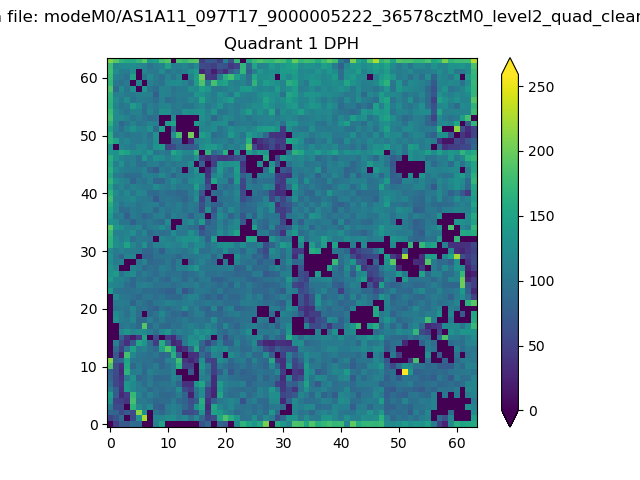 |
Quadrant B |
|---|---|---|---|
| Quadrant D | 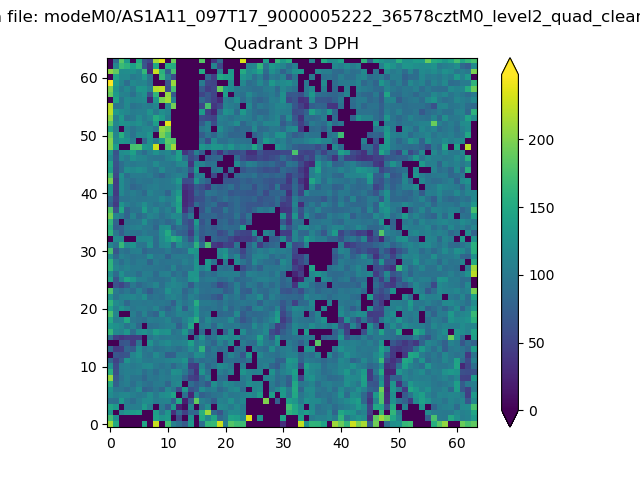 |
 |
Quadrant C |
| Plot type | Count rate plots | Images |
|---|---|---|
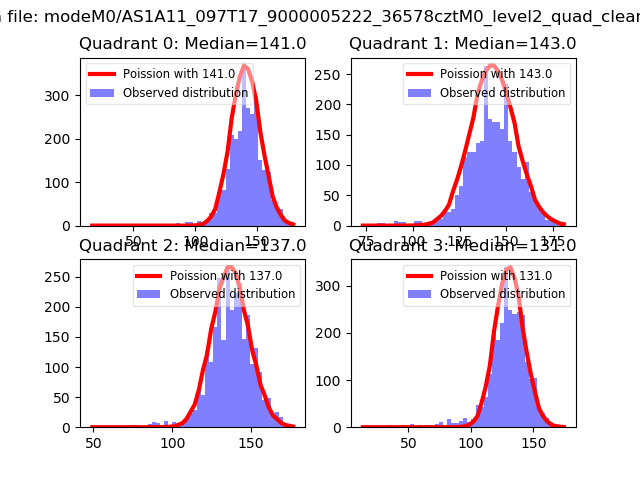
| Comparison with Poisson distribution Blue bars denote a histogram of data divided into 1 sec bins. Red curve is a Poisson curve with rate = median count rate of data. |
 |
 |
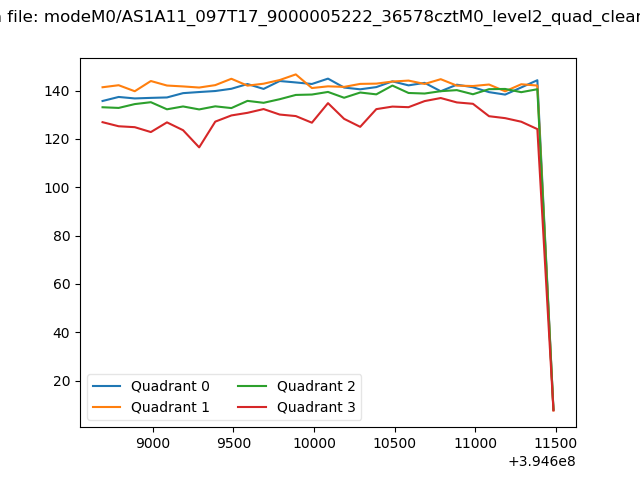
| Quadrant-wise count rates Data is divided into 100 sec bins |
 |
|
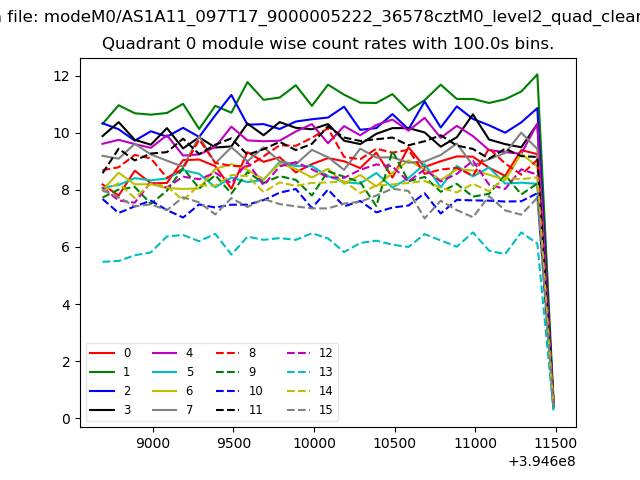
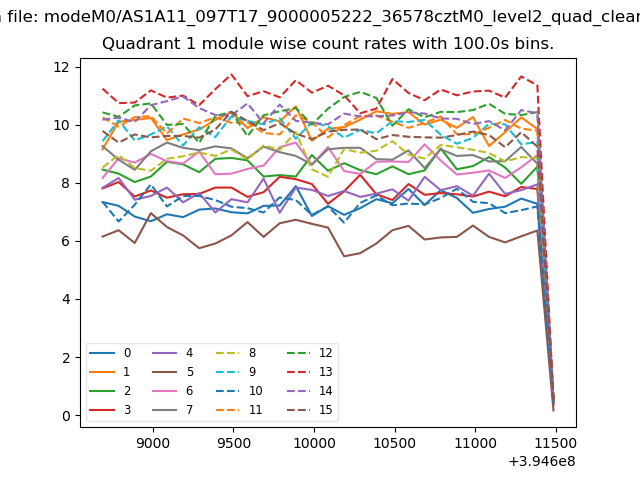
| Module-wise count rates for Quadrant A Data is divided into 100 sec bins |
 |
 |
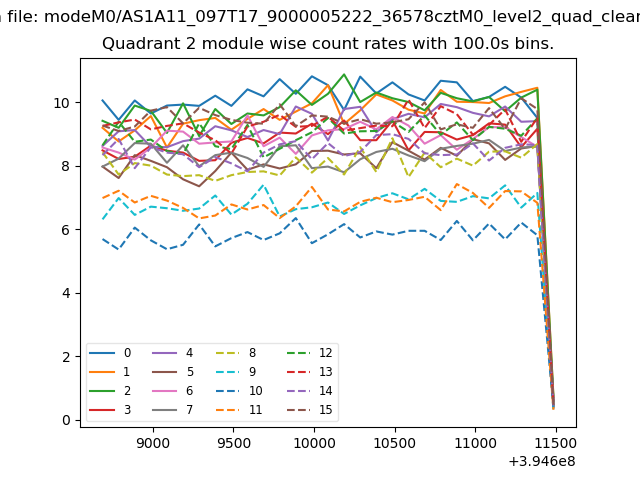
| Module-wise count rates for Quadrant B Data is divided into 100 sec bins |
 |
 |
| Module-wise count rates for Quadrant C Data is divided into 100 sec bins |
 |
 |
| Module-wise count rates for Quadrant D Data is divided into 100 sec bins |
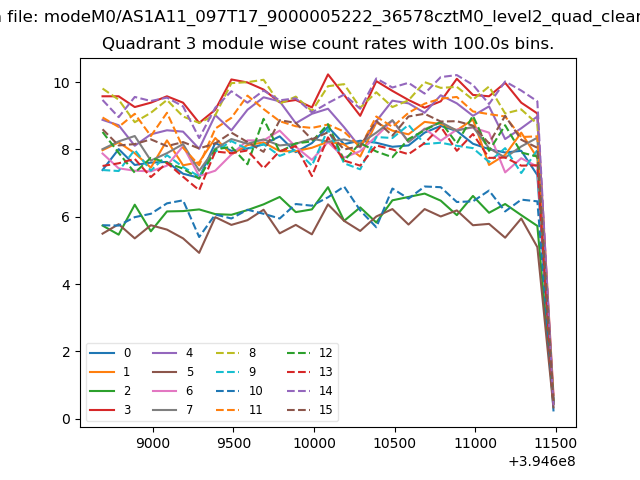 |
 |
| Parameter | Plot |
|---|---|
| CZT HV Monitor | 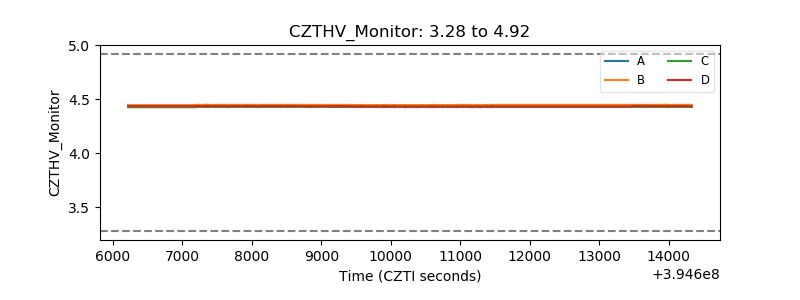 |
| D_VDD | 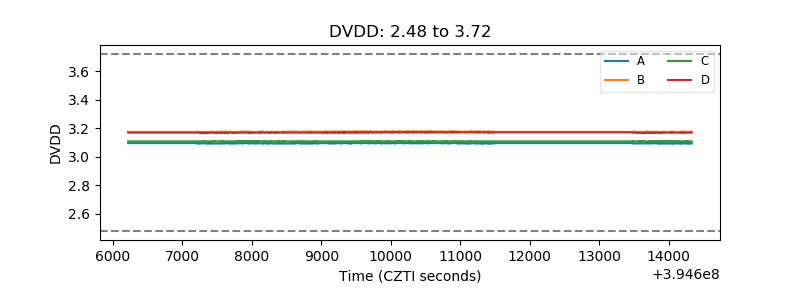 |
| Temperature 1 | 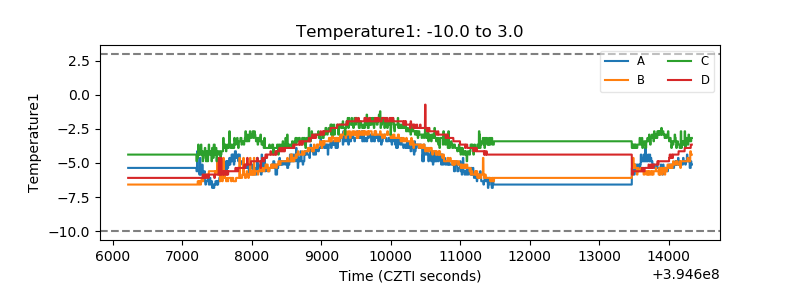 |
| Veto HV Monitor | 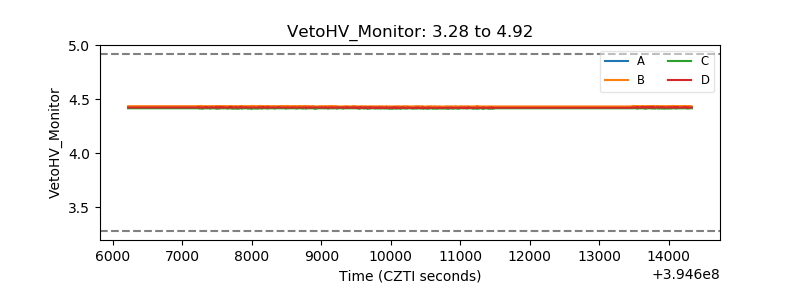 |
| Veto LLD | 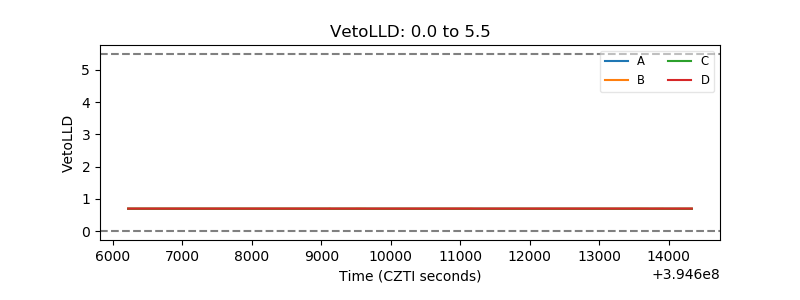 |
| Alpha Counter | 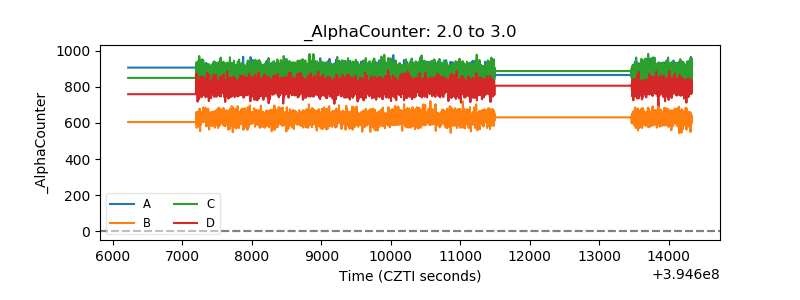 |
| _CPM_Rate | 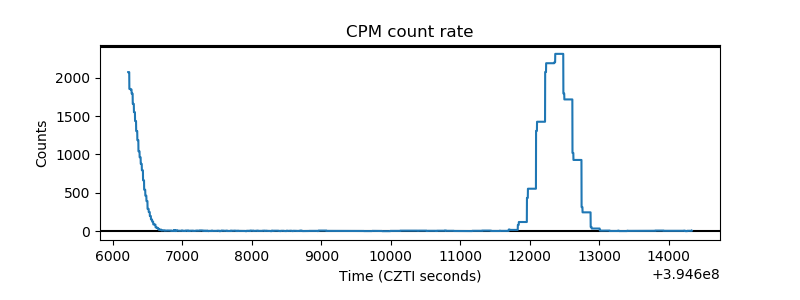 |
| CZT Counter | 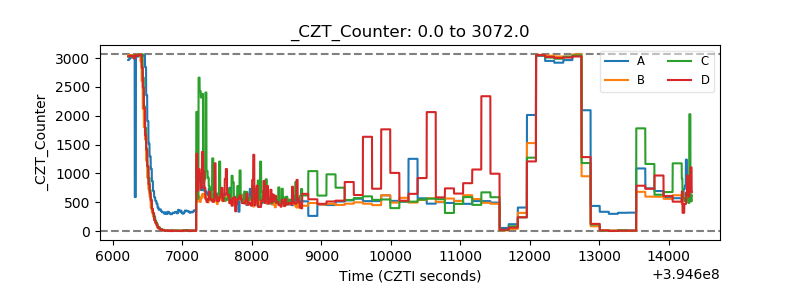 |
| +2.5 Volts monitor |  |
| +5 Volts monitor |  |
| _ROLL_ROT |  |
| _Roll_DEC | 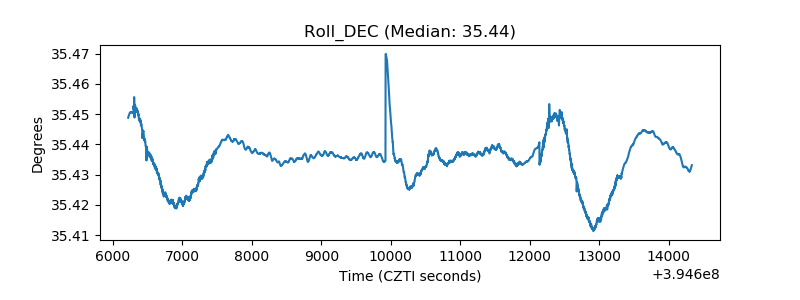 |
| _Roll_RA |  |
| Veto Counter |  |