| Param | Original file | Final file |
|---|---|---|
| Filename | modeM0/AS1A11_097T17_9000005222_36579cztM0_level2.evt | modeM0/AS1A11_097T17_9000005222_36579cztM0_level2_quad_clean.evt |
| Size (bytes) | 480,824,640 | 73,563,840 |
| Size | 458.6 MB | 70.2 MB |
| Events in quadrant A | 2,931,173 | 487,300 |
| Events in quadrant B | 2,873,733 | 490,712 |
| Events in quadrant C | 3,546,965 | 470,164 |
| Events in quadrant D | 4,872,806 | 430,368 |
| Mode M0 | |||
|---|---|---|---|
| Quadrant | BADHDUFLAG | Total packets | Discarded packets |
| A | 0 | 11608 | 3 |
| B | 0 | 11481 | 2 |
| C | 0 | 13571 | 2 |
| D | 0 | 17977 | 2 |
| Mode M9 | |||
|---|---|---|---|
| Quadrant | BADHDUFLAG | Total packets | Discarded packets |
| A | 0 | 33 | 0 |
| B | 0 | 33 | 0 |
| C | 0 | 33 | 0 |
| D | 0 | 34 | 0 |
| Mode SS | |||
|---|---|---|---|
| Quadrant | BADHDUFLAG | Total packets | Discarded packets |
| A | 0 | 100 | 0 |
| B | 0 | 100 | 0 |
| C | 0 | 100 | 0 |
| D | 0 | 100 | 0 |
| Quadrant | Total seconds | Saturated seconds | Saturation percentage |
|---|---|---|---|
| A | 4981 | 53 | 1.064043% |
| B | 4981 | 35 | 0.702670% |
| C | 4981 | 225 | 4.517165% |
| D | 4981 | 422 | 8.472194% |
Noise dominated data is calculated using 1-second bins in cleaned event files. If a bin has >2000 counts, and if more than 50% of those come from <1% of pixels, then it is considered to be noise-dominated and hence unusable.
| Quadrant | # 1 sec bins | Bins with >0 counts | Bins with >2000 counts | High rate bins dominated by noise | Noise dominated (total time) | Noise dominated (detector-on time) | Marked lightcurve |
|---|---|---|---|---|---|---|---|
| A | 7044 | 4982 | 34 | 34 | 0.48% | 0.68% | 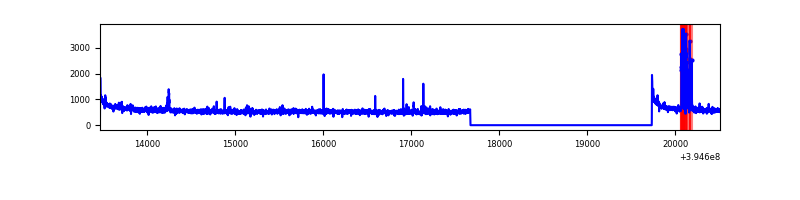 |
| B | 7044 | 4982 | 13 | 13 | 0.18% | 0.26% | 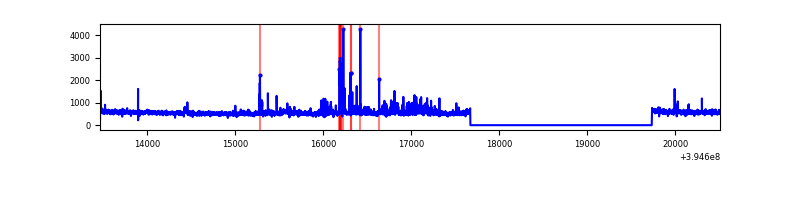 |
| C | 7044 | 4982 | 167 | 167 | 2.37% | 3.35% | 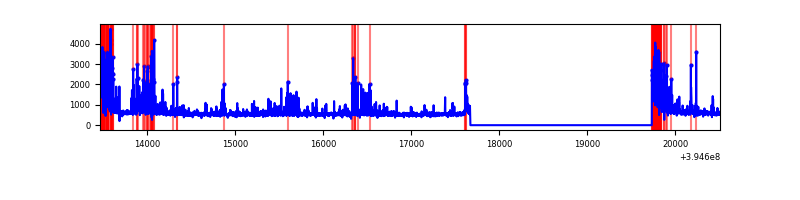 |
| D | 7044 | 4982 | 360 | 360 | 5.11% | 7.23% | 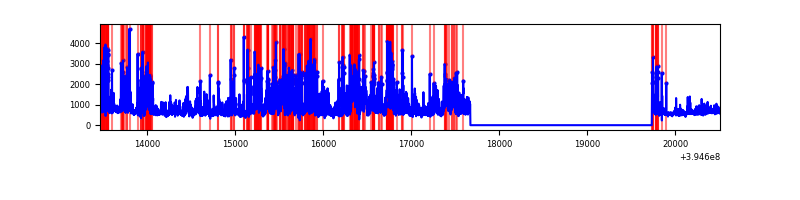 |
Top three noisy pixels from each quadrant. If the there are fewer than three noisy pixels in the level2.evt file, extra rows are filled as -1
| Pixel properties | Quadrant properties | ||||||
|---|---|---|---|---|---|---|---|
| Quadrant | DetID | PixID | Counts | Sigma | Mean | Median | Sigma |
| A | 10 | 83 | 193116 | 1463.65 | 664 | 655 | 131.5 |
| A | 15 | 223 | 155468 | 1177.34 | 664 | 655 | 131.5 |
| A | 9 | 143 | 12801 | 92.37 | 664 | 655 | 131.5 |
| B | 0 | 190 | 87507 | 713.03 | 655 | 641 | 121.8 |
| B | 0 | 213 | 76045 | 618.94 | 655 | 641 | 121.8 |
| B | 0 | 189 | 65280 | 530.58 | 655 | 641 | 121.8 |
| C | 0 | 10 | 765068 | 5410.82 | 618 | 626 | 141.3 |
| C | 15 | 214 | 212175 | 1497.37 | 618 | 626 | 141.3 |
| C | 14 | 254 | 79790 | 560.33 | 618 | 626 | 141.3 |
| D | 12 | 235 | 1188709 | 7936.36 | 622 | 606 | 149.7 |
| D | 2 | 250 | 241161 | 1606.87 | 622 | 606 | 149.7 |
| D | 10 | 199 | 235430 | 1568.59 | 622 | 606 | 149.7 |
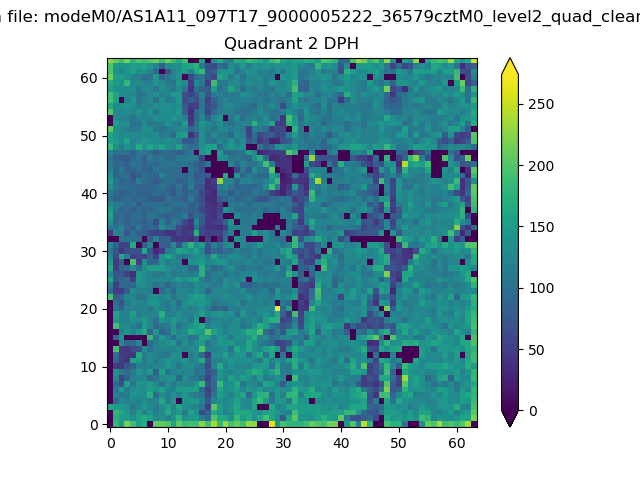
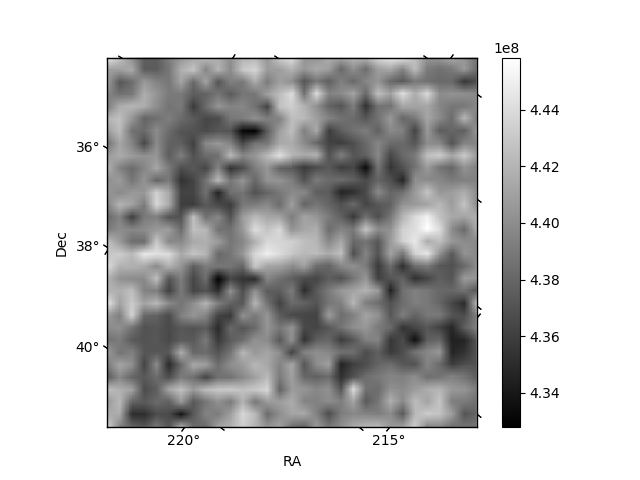
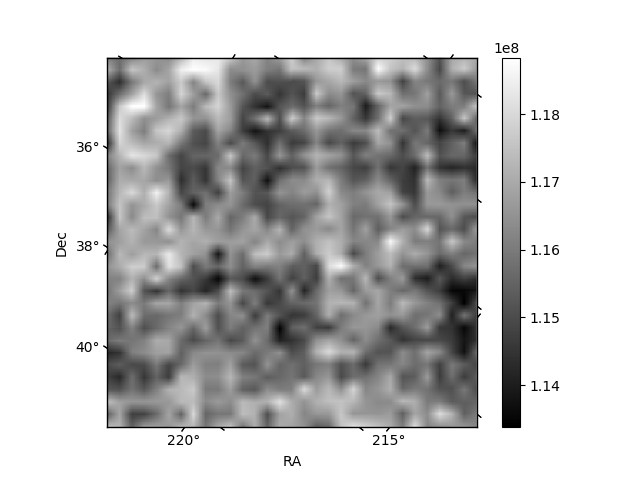
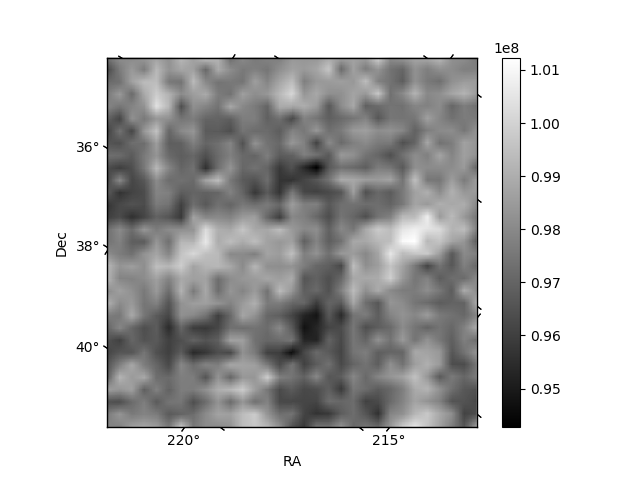
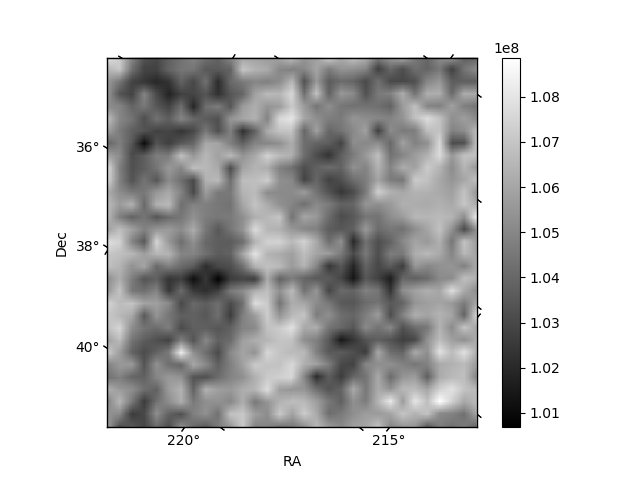
Histogram calculated using DETX and DETY for each event in the final _common_clean file
| Quadrant A | 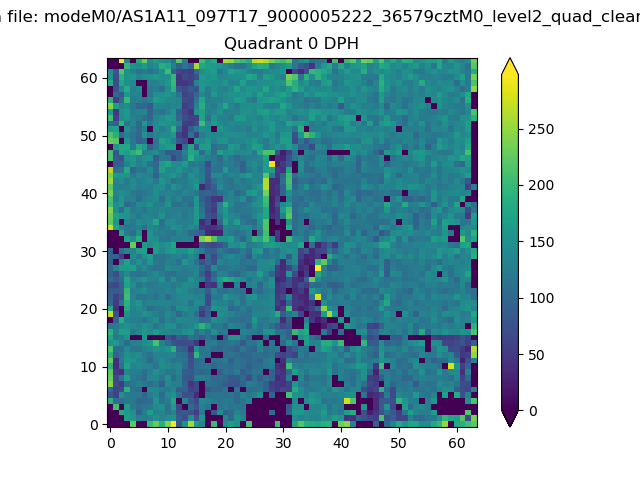 |
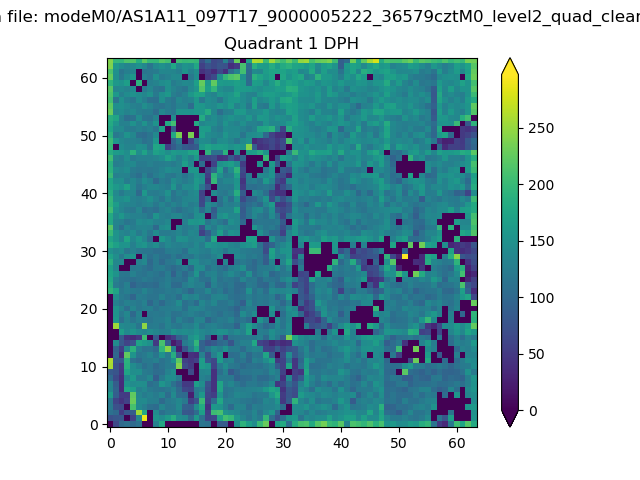 |
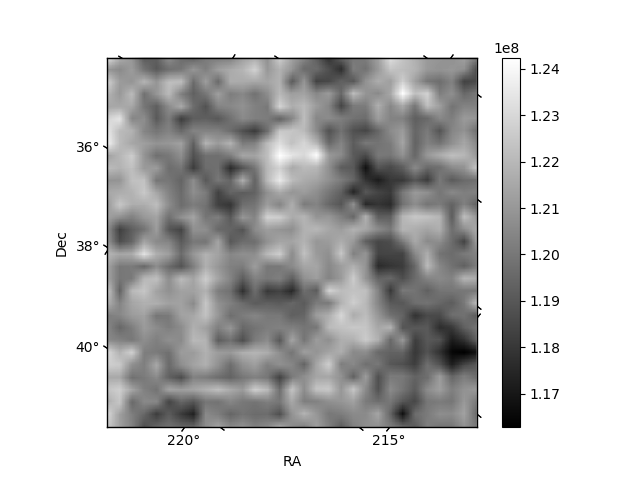
Quadrant B |
|---|---|---|---|
| Quadrant D | 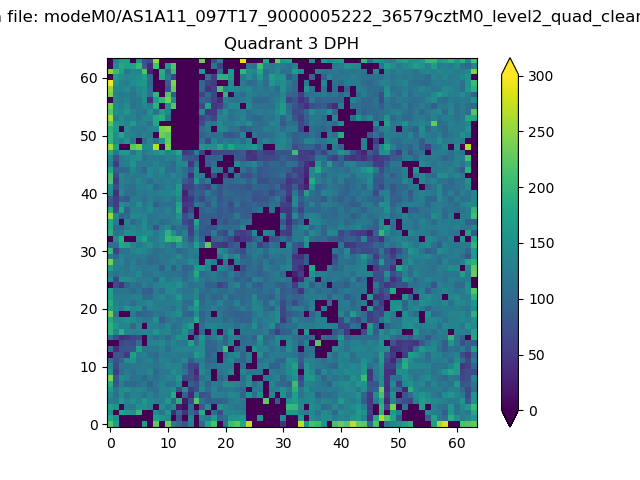 |
 |
Quadrant C |
| Plot type | Count rate plots | Images |
|---|---|---|
| Comparison with Poisson distribution Blue bars denote a histogram of data divided into 1 sec bins. Red curve is a Poisson curve with rate = median count rate of data. |
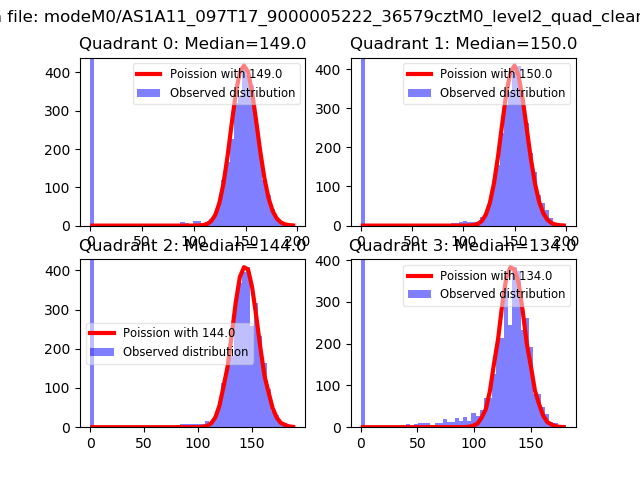 |
 |
| Quadrant-wise count rates Data is divided into 100 sec bins |
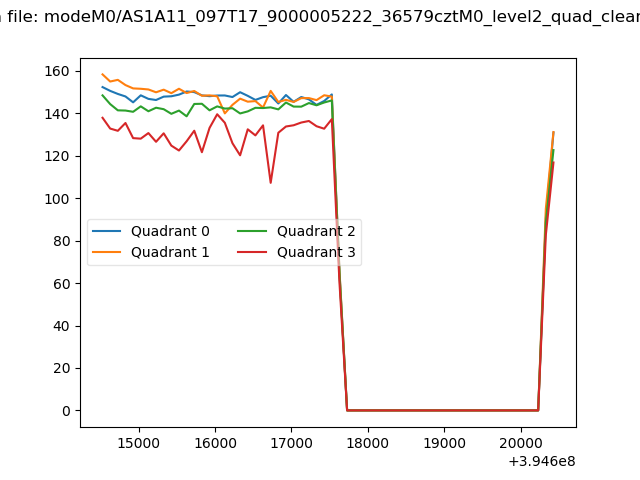 |
|
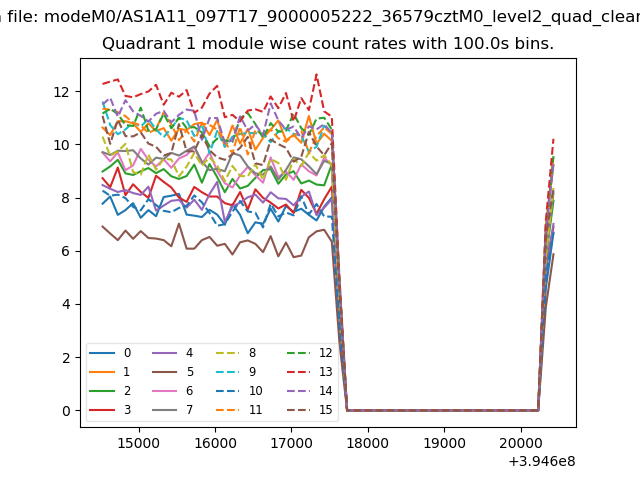
| Module-wise count rates for Quadrant A Data is divided into 100 sec bins |
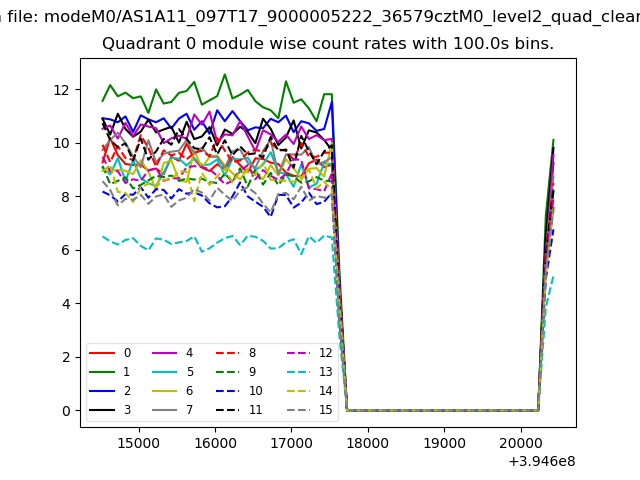 |
 |
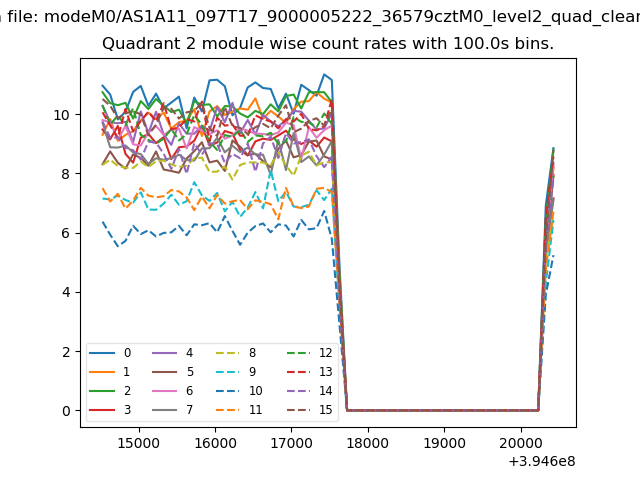
| Module-wise count rates for Quadrant B Data is divided into 100 sec bins |
 |
 |
| Module-wise count rates for Quadrant C Data is divided into 100 sec bins |
 |
 |
| Module-wise count rates for Quadrant D Data is divided into 100 sec bins |
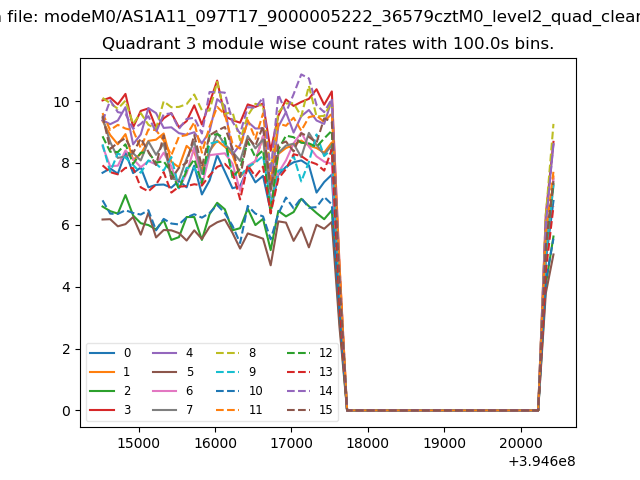 |
 |
| Parameter | Plot |
|---|---|
| CZT HV Monitor | 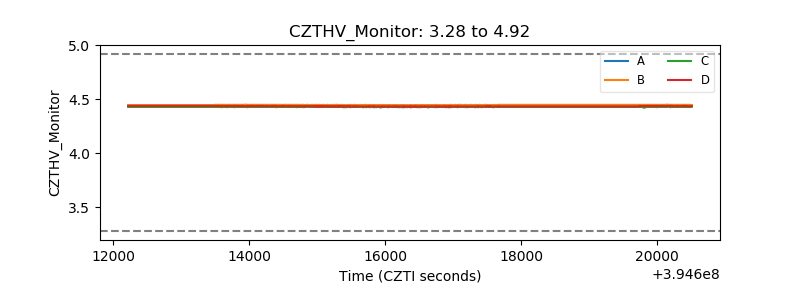 |
| D_VDD | 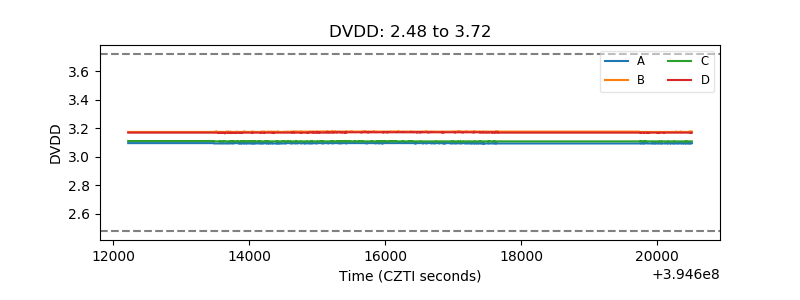 |
| Temperature 1 | 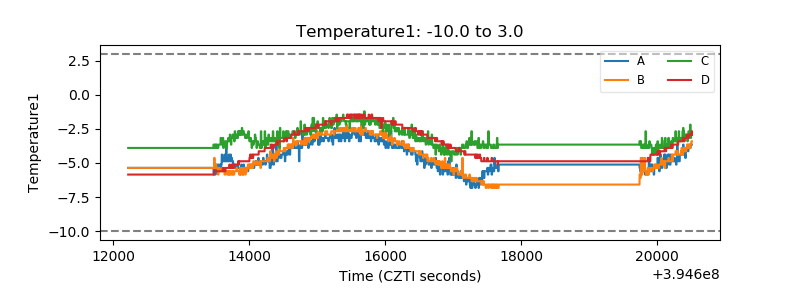 |
| Veto HV Monitor | 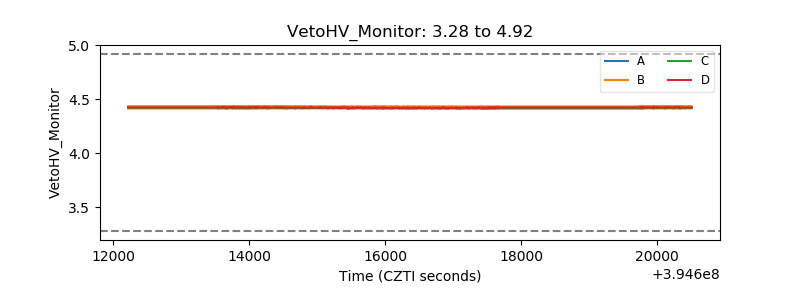 |
| Veto LLD | 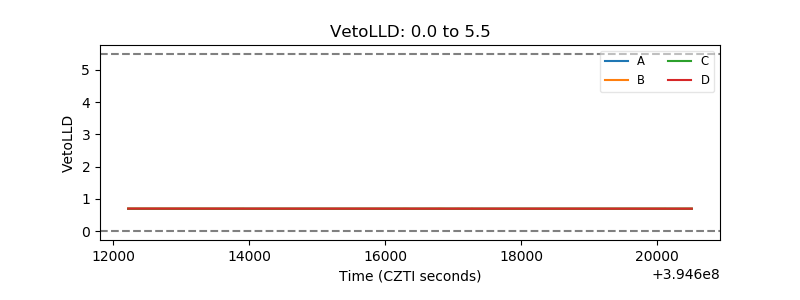 |
| Alpha Counter | 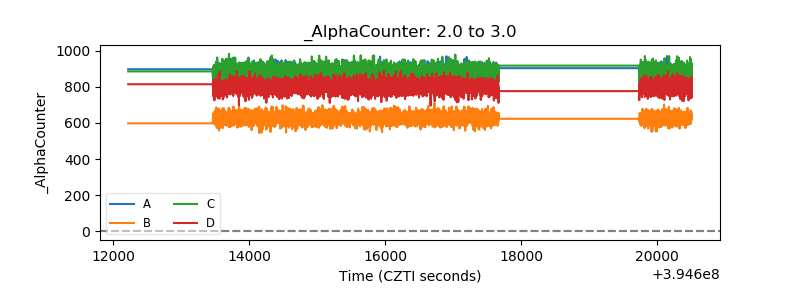 |
| _CPM_Rate | 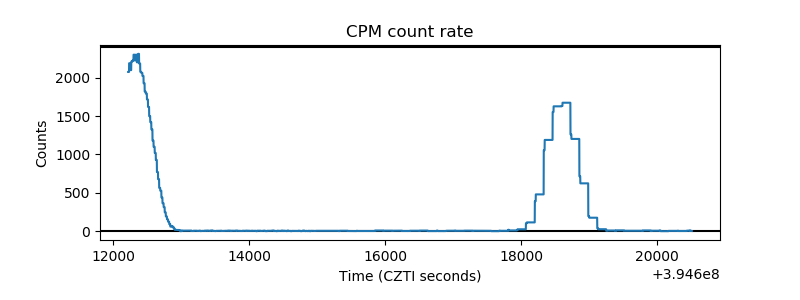 |
| CZT Counter | 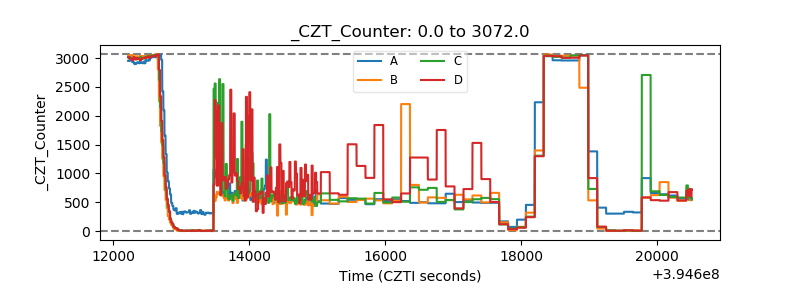 |
| +2.5 Volts monitor |  |
| +5 Volts monitor | 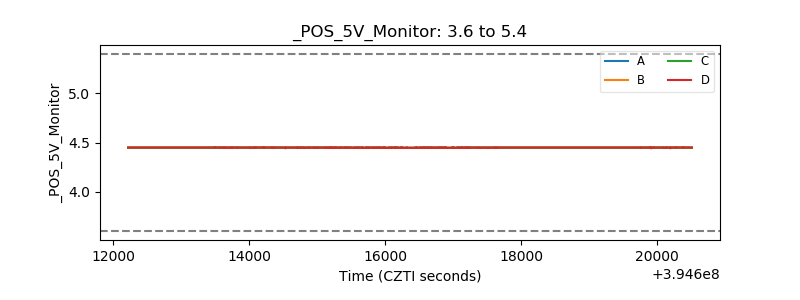 |
| _ROLL_ROT | 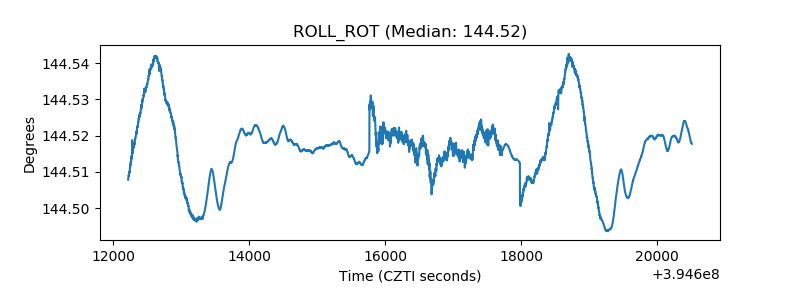 |
| _Roll_DEC | 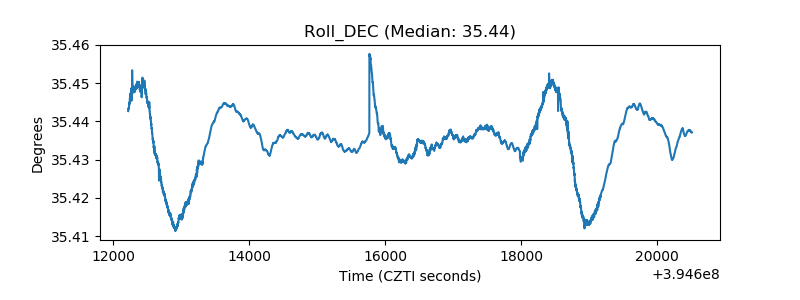 |
| _Roll_RA | 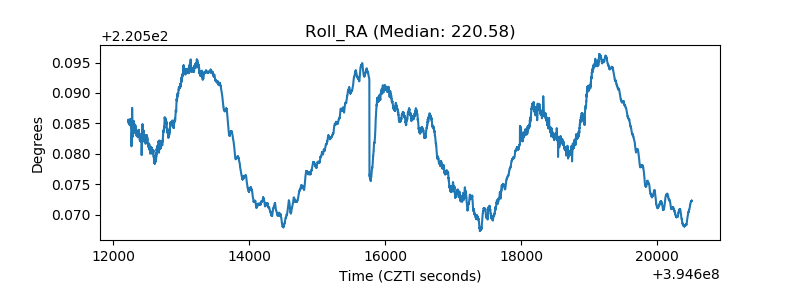 |
| Veto Counter | 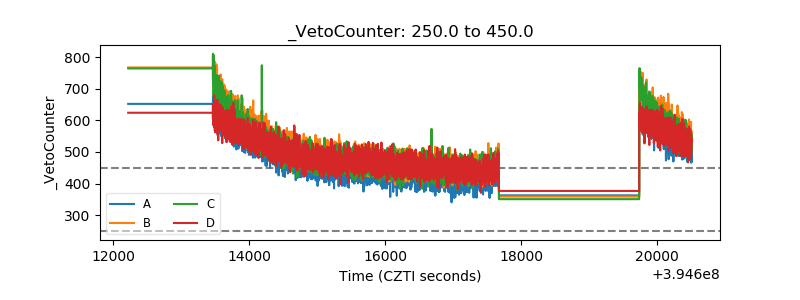 |