| Param | Original file | Final file |
|---|---|---|
| Filename | modeM0/AS1A11_097T17_9000005222_36580cztM0_level2.evt | modeM0/AS1A11_097T17_9000005222_36580cztM0_level2_quad_clean.evt |
| Size (bytes) | 451,293,120 | 89,737,920 |
| Size | 430.4 MB | 85.6 MB |
| Events in quadrant A | 2,955,937 | 613,196 |
| Events in quadrant B | 2,774,527 | 614,625 |
| Events in quadrant C | 3,370,017 | 591,796 |
| Events in quadrant D | 4,230,864 | 550,485 |
| Mode M0 | |||
|---|---|---|---|
| Quadrant | BADHDUFLAG | Total packets | Discarded packets |
| A | 0 | 11727 | 3 |
| B | 0 | 11047 | 2 |
| C | 0 | 12936 | 2 |
| D | 0 | 15978 | 2 |
| Mode M9 | |||
|---|---|---|---|
| Quadrant | BADHDUFLAG | Total packets | Discarded packets |
| A | 0 | 40 | 0 |
| B | 0 | 40 | 0 |
| C | 0 | 40 | 0 |
| D | 0 | 41 | 0 |
| Mode SS | |||
|---|---|---|---|
| Quadrant | BADHDUFLAG | Total packets | Discarded packets |
| A | 0 | 100 | 0 |
| B | 0 | 100 | 0 |
| C | 0 | 100 | 0 |
| D | 0 | 100 | 0 |
| Quadrant | Total seconds | Saturated seconds | Saturation percentage |
|---|---|---|---|
| A | 4959 | 67 | 1.351079% |
| B | 4959 | 51 | 1.028433% |
| C | 4959 | 219 | 4.416213% |
| D | 4959 | 247 | 4.980843% |
Noise dominated data is calculated using 1-second bins in cleaned event files. If a bin has >2000 counts, and if more than 50% of those come from <1% of pixels, then it is considered to be noise-dominated and hence unusable.
| Quadrant | # 1 sec bins | Bins with >0 counts | Bins with >2000 counts | High rate bins dominated by noise | Noise dominated (total time) | Noise dominated (detector-on time) | Marked lightcurve |
|---|---|---|---|---|---|---|---|
| A | 7082 | 4960 | 44 | 44 | 0.62% | 0.89% | 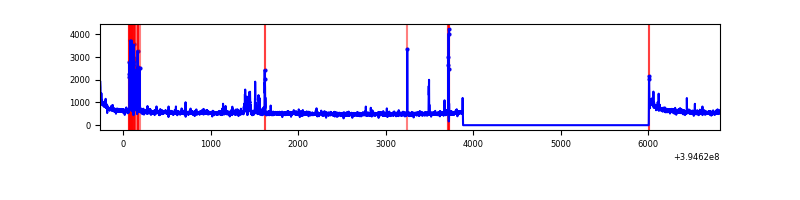 |
| B | 7082 | 4960 | 36 | 36 | 0.51% | 0.73% | 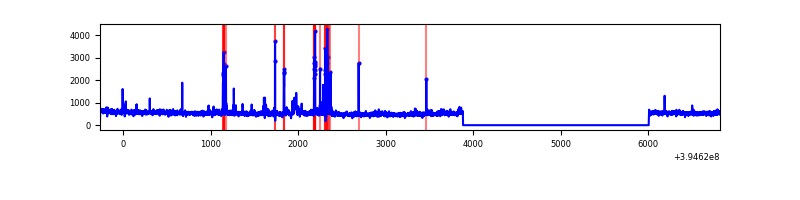 |
| C | 7082 | 4960 | 174 | 174 | 2.46% | 3.51% | 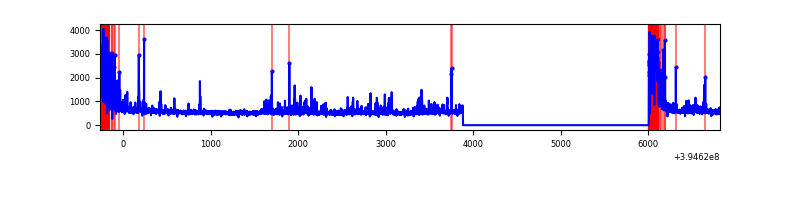 |
| D | 7082 | 4960 | 199 | 199 | 2.81% | 4.01% | 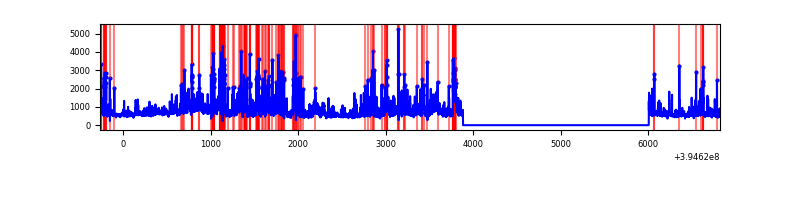 |
Top three noisy pixels from each quadrant. If the there are fewer than three noisy pixels in the level2.evt file, extra rows are filled as -1
| Pixel properties | Quadrant properties | ||||||
|---|---|---|---|---|---|---|---|
| Quadrant | DetID | PixID | Counts | Sigma | Mean | Median | Sigma |
| A | 15 | 223 | 232312 | 1795.91 | 647 | 635 | 129.0 |
| A | 10 | 83 | 191731 | 1481.34 | 647 | 635 | 129.0 |
| A | 9 | 143 | 29909 | 226.93 | 647 | 635 | 129.0 |
| B | 5 | 172 | 111571 | 928.48 | 635 | 621 | 119.5 |
| B | 0 | 189 | 82824 | 687.91 | 635 | 621 | 119.5 |
| B | 0 | 213 | 21751 | 176.83 | 635 | 621 | 119.5 |
| C | 0 | 10 | 661517 | 4800.56 | 600 | 606 | 137.7 |
| C | 15 | 214 | 209822 | 1519.65 | 600 | 606 | 137.7 |
| C | 14 | 254 | 68693 | 494.55 | 600 | 606 | 137.7 |
| D | 12 | 235 | 732785 | 5045.66 | 613 | 597 | 145.1 |
| D | 13 | 249 | 329821 | 2268.75 | 613 | 597 | 145.1 |
| D | 1 | 20 | 194363 | 1335.28 | 613 | 597 | 145.1 |
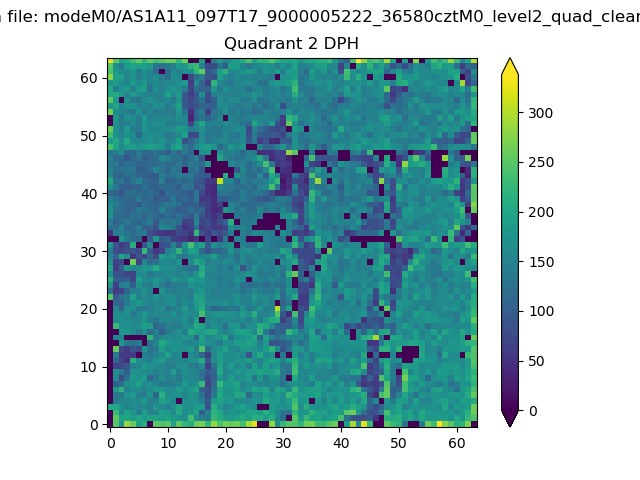
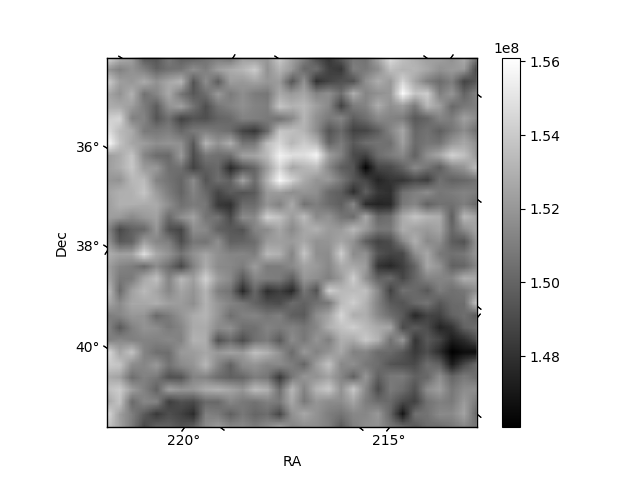
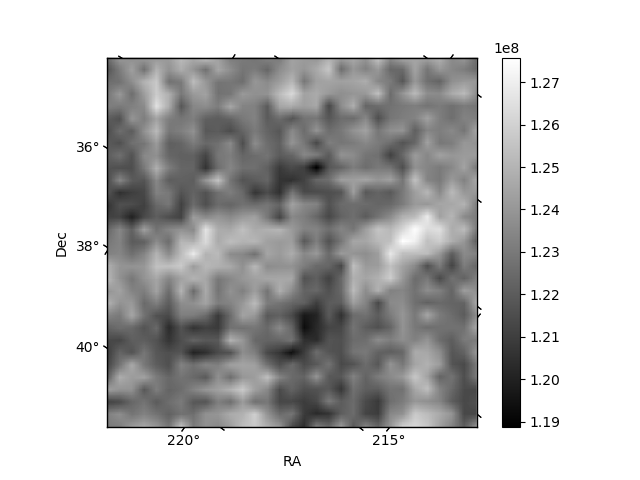
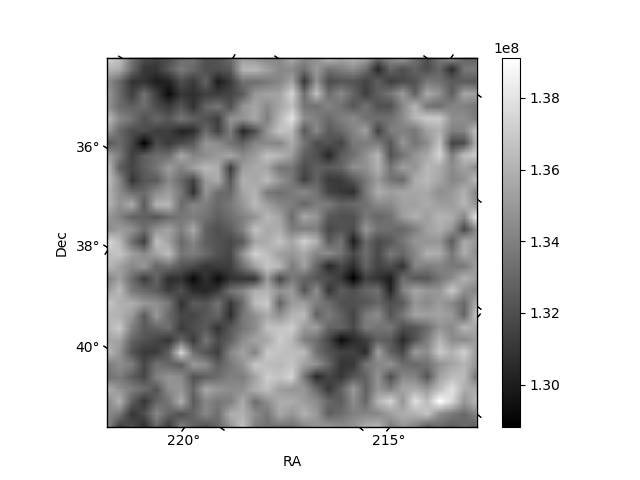
Histogram calculated using DETX and DETY for each event in the final _common_clean file
| Quadrant A | 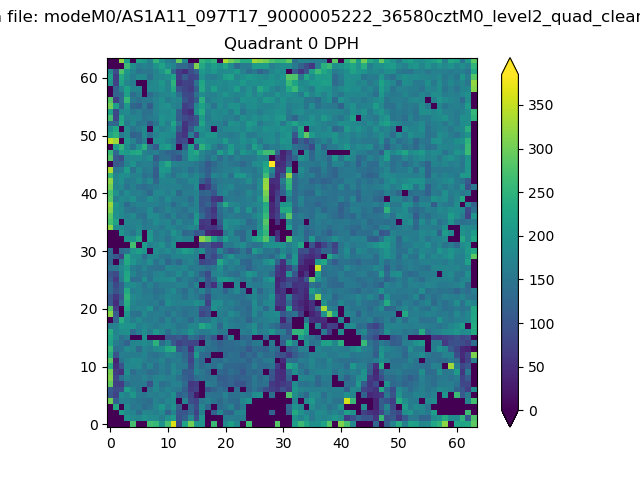 |
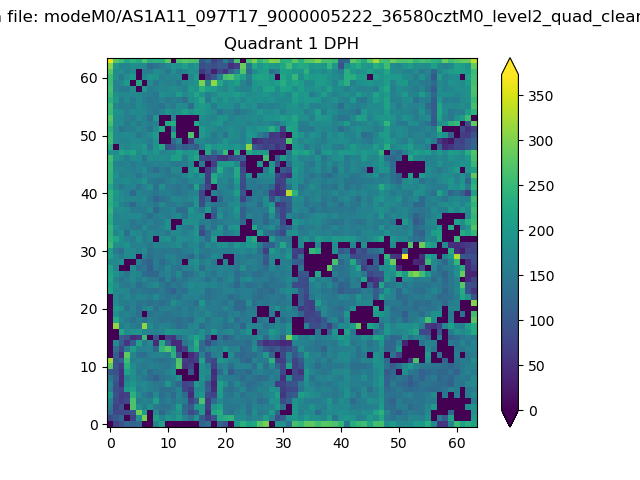 |
Quadrant B |
|---|---|---|---|
| Quadrant D | 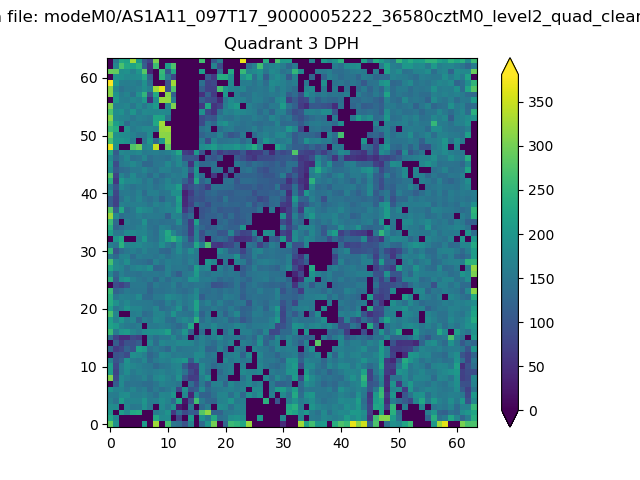 |
 |
Quadrant C |
| Plot type | Count rate plots | Images |
|---|---|---|
| Comparison with Poisson distribution Blue bars denote a histogram of data divided into 1 sec bins. Red curve is a Poisson curve with rate = median count rate of data. |
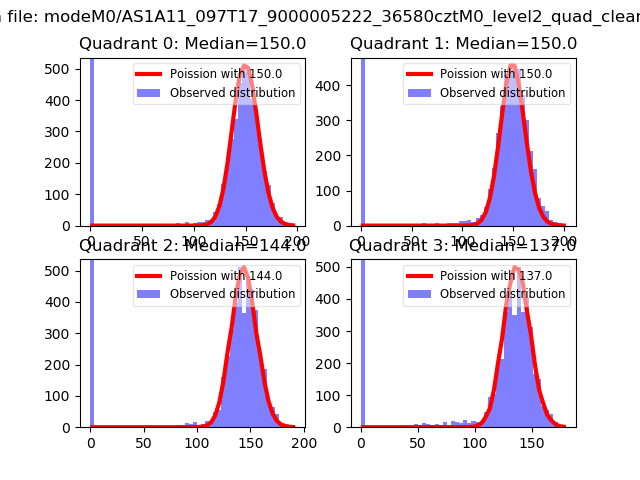 |
 |
| Quadrant-wise count rates Data is divided into 100 sec bins |
 |
|
| Module-wise count rates for Quadrant A Data is divided into 100 sec bins |
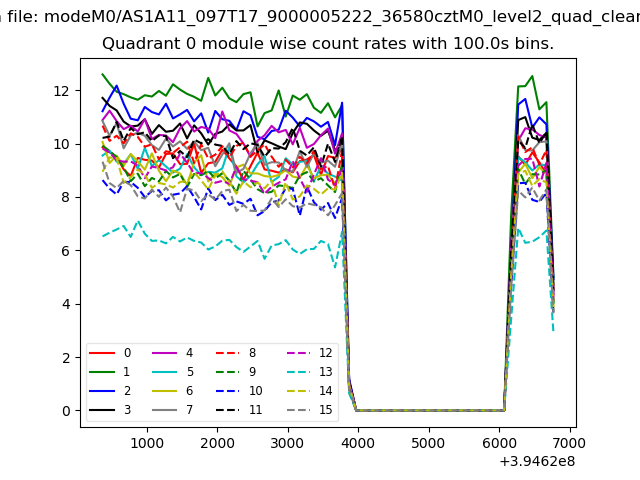 |
 |
| Module-wise count rates for Quadrant B Data is divided into 100 sec bins |
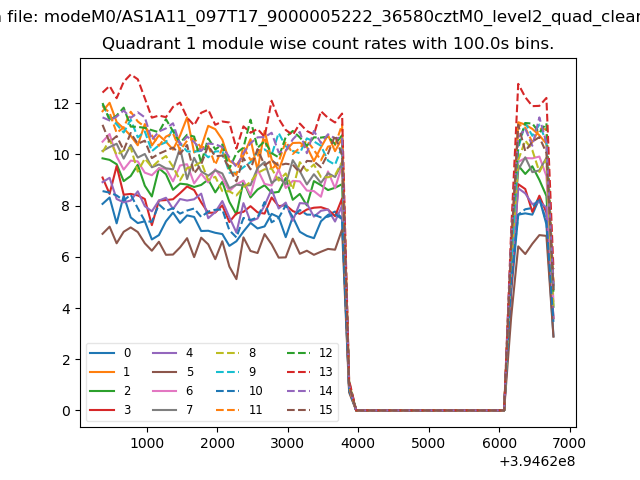 |
 |
| Module-wise count rates for Quadrant C Data is divided into 100 sec bins |
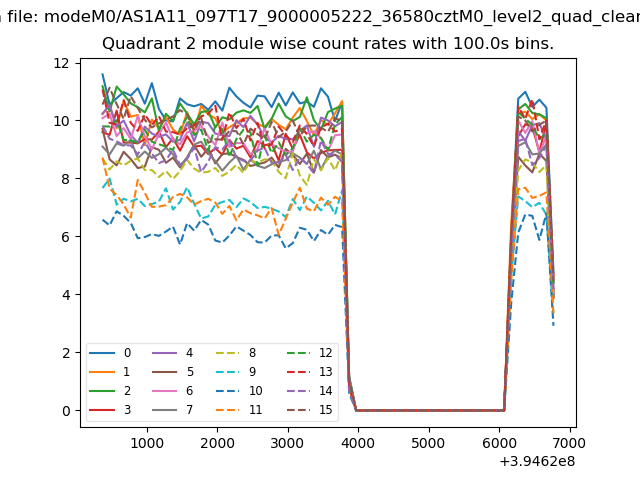 |
 |
| Module-wise count rates for Quadrant D Data is divided into 100 sec bins |
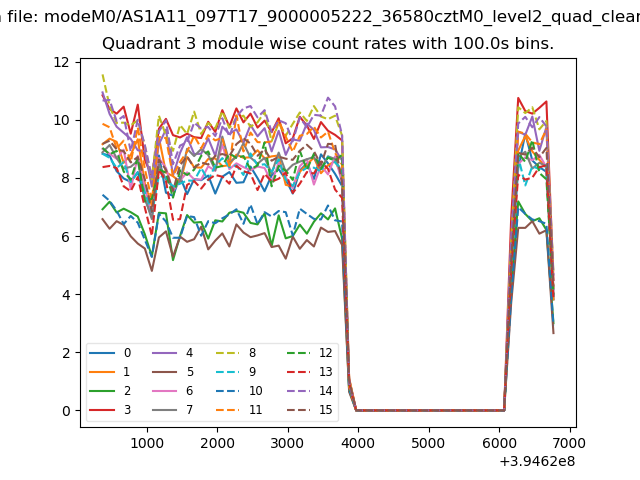 |
 |
| Parameter | Plot |
|---|---|
| CZT HV Monitor | 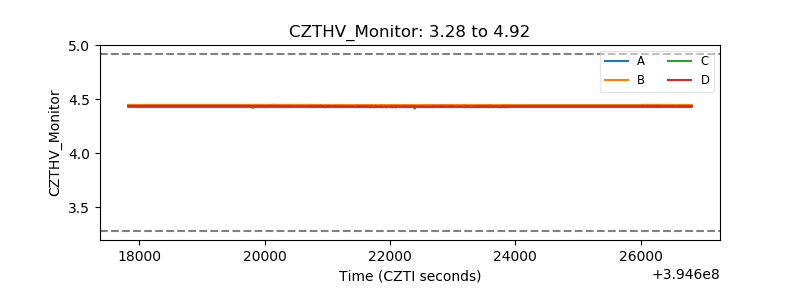 |
| D_VDD | 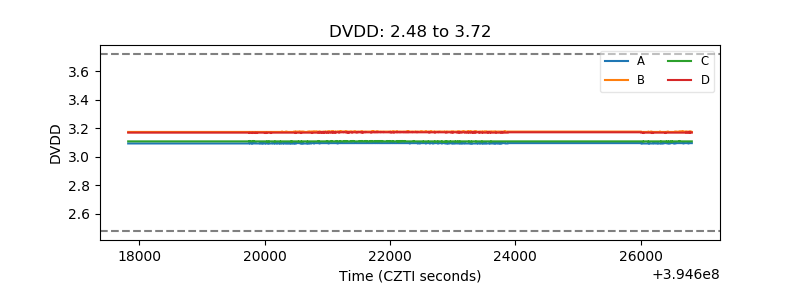 |
| Temperature 1 | 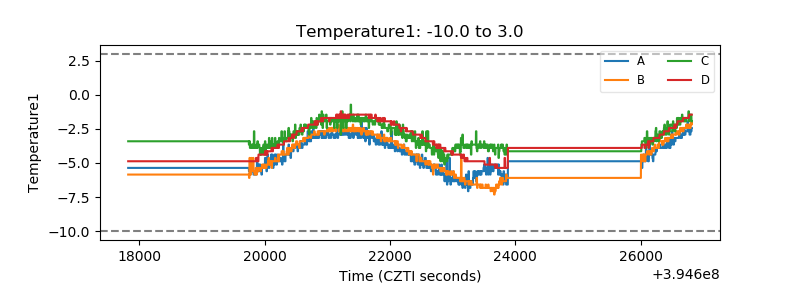 |
| Veto HV Monitor | 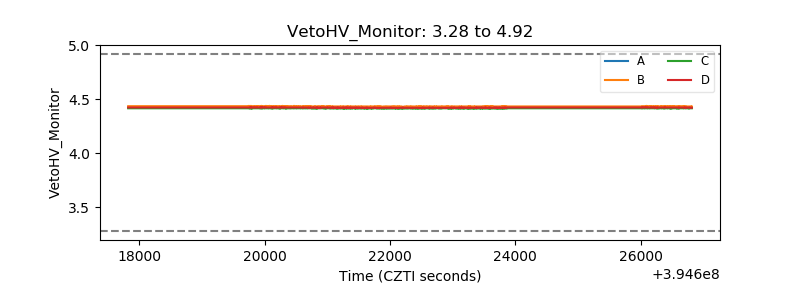 |
| Veto LLD | 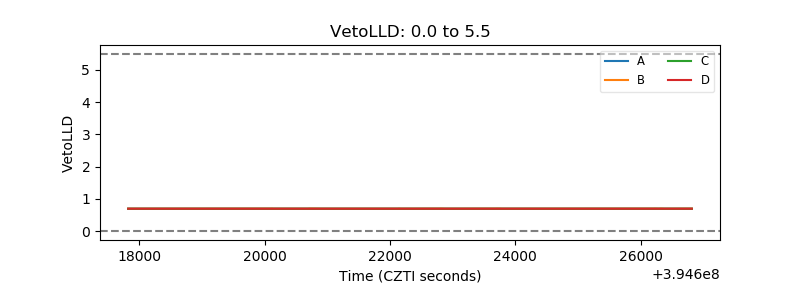 |
| Alpha Counter |  |
| _CPM_Rate | 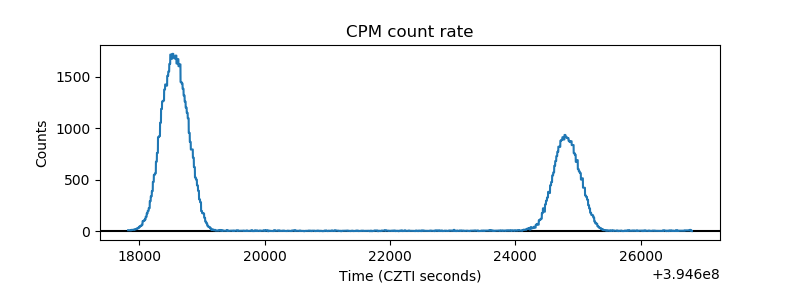 |
| CZT Counter | 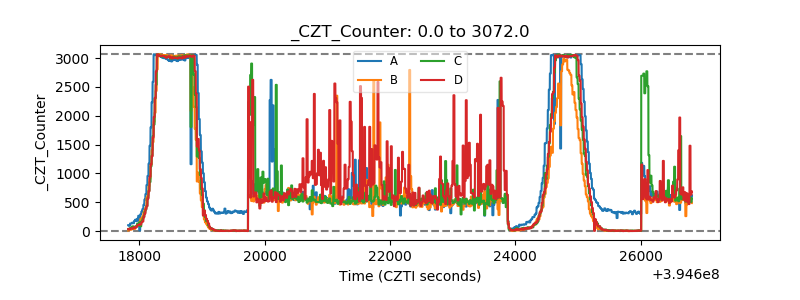 |
| +2.5 Volts monitor |  |
| +5 Volts monitor |  |
| _ROLL_ROT | 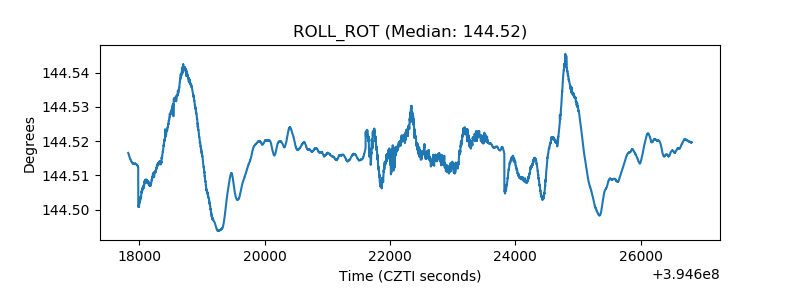 |
| _Roll_DEC | 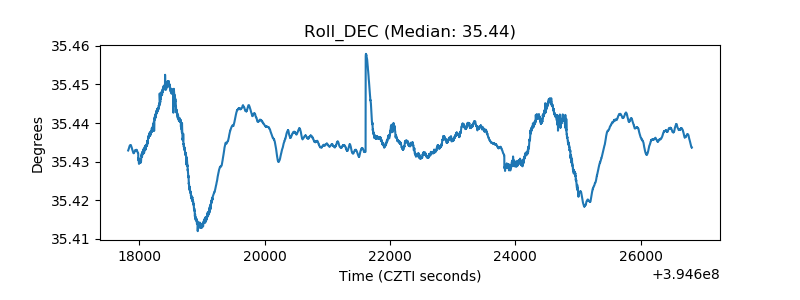 |
| _Roll_RA | 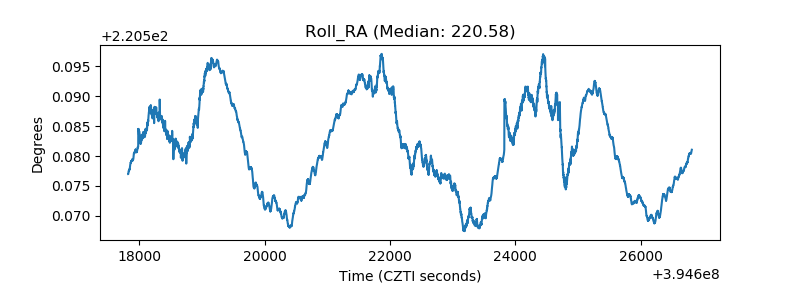 |
| Veto Counter | 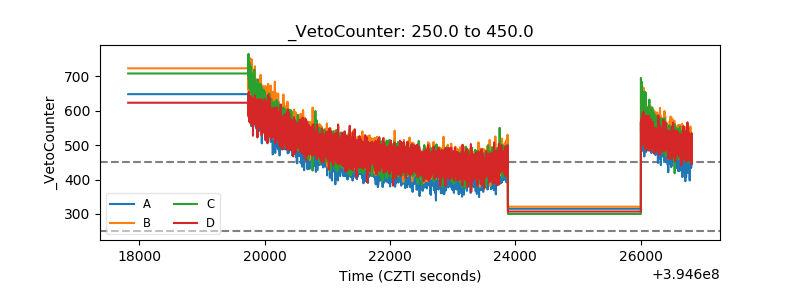 |