| Param | Original file | Final file |
|---|---|---|
| Filename | modeM0/AS1A11_097T17_9000005222_36581cztM0_level2.evt | modeM0/AS1A11_097T17_9000005222_36581cztM0_level2_quad_clean.evt |
| Size (bytes) | 433,869,120 | 98,599,680 |
| Size | 413.8 MB | 94.0 MB |
| Events in quadrant A | 2,783,716 | 675,779 |
| Events in quadrant B | 2,875,400 | 678,739 |
| Events in quadrant C | 3,647,723 | 644,110 |
| Events in quadrant D | 3,477,655 | 620,938 |
| Mode M0 | |||
|---|---|---|---|
| Quadrant | BADHDUFLAG | Total packets | Discarded packets |
| A | 0 | 11389 | 3 |
| B | 0 | 11701 | 2 |
| C | 0 | 13880 | 2 |
| D | 0 | 13593 | 2 |
| Mode M9 | |||
|---|---|---|---|
| Quadrant | BADHDUFLAG | Total packets | Discarded packets |
| A | 0 | 21 | 0 |
| B | 0 | 21 | 0 |
| C | 0 | 21 | 0 |
| D | 0 | 21 | 0 |
| Mode SS | |||
|---|---|---|---|
| Quadrant | BADHDUFLAG | Total packets | Discarded packets |
| A | 0 | 108 | 0 |
| B | 0 | 108 | 0 |
| C | 0 | 108 | 0 |
| D | 0 | 108 | 0 |
| Quadrant | Total seconds | Saturated seconds | Saturation percentage |
|---|---|---|---|
| A | 5227 | 16 | 0.306103% |
| B | 5227 | 33 | 0.631337% |
| C | 5227 | 286 | 5.471590% |
| D | 5227 | 145 | 2.774058% |
Noise dominated data is calculated using 1-second bins in cleaned event files. If a bin has >2000 counts, and if more than 50% of those come from <1% of pixels, then it is considered to be noise-dominated and hence unusable.
| Quadrant | # 1 sec bins | Bins with >0 counts | Bins with >2000 counts | High rate bins dominated by noise | Noise dominated (total time) | Noise dominated (detector-on time) | Marked lightcurve |
|---|---|---|---|---|---|---|---|
| A | 7350 | 5228 | 5 | 5 | 0.07% | 0.10% | 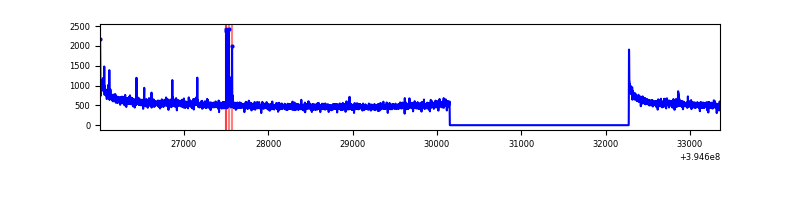 |
| B | 7350 | 5228 | 11 | 11 | 0.15% | 0.21% | 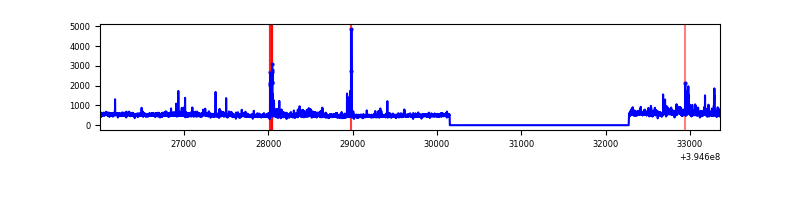 |
| C | 7350 | 5228 | 234 | 234 | 3.18% | 4.48% | 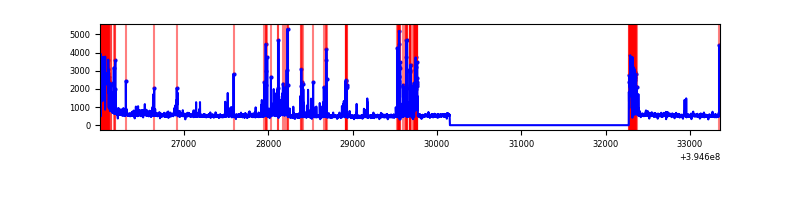 |
| D | 7350 | 5228 | 115 | 115 | 1.56% | 2.20% | 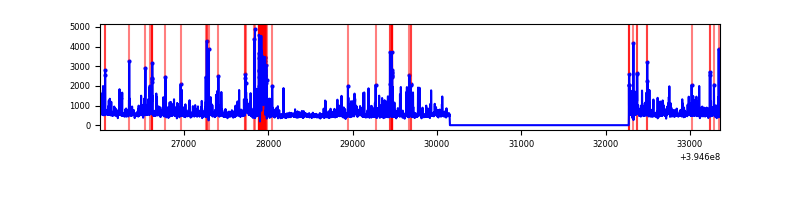 |
Top three noisy pixels from each quadrant. If the there are fewer than three noisy pixels in the level2.evt file, extra rows are filled as -1
| Pixel properties | Quadrant properties | ||||||
|---|---|---|---|---|---|---|---|
| Quadrant | DetID | PixID | Counts | Sigma | Mean | Median | Sigma |
| A | 10 | 83 | 202889 | 1560.58 | 649 | 638 | 129.6 |
| A | 15 | 223 | 62016 | 473.6 | 649 | 638 | 129.6 |
| A | 13 | 254 | 8971 | 64.3 | 649 | 638 | 129.6 |
| B | 0 | 213 | 169136 | 1394.45 | 639 | 625 | 120.8 |
| B | 0 | 190 | 56377 | 461.35 | 639 | 625 | 120.8 |
| B | 5 | 255 | 28388 | 229.74 | 639 | 625 | 120.8 |
| C | 0 | 10 | 530685 | 3828.95 | 604 | 610 | 138.4 |
| C | 14 | 254 | 441456 | 3184.41 | 604 | 610 | 138.4 |
| C | 15 | 214 | 219415 | 1580.52 | 604 | 610 | 138.4 |
| D | 12 | 227 | 203847 | 1341.13 | 625 | 609 | 151.5 |
| D | 2 | 153 | 142508 | 936.36 | 625 | 609 | 151.5 |
| D | 12 | 235 | 139114 | 913.97 | 625 | 609 | 151.5 |
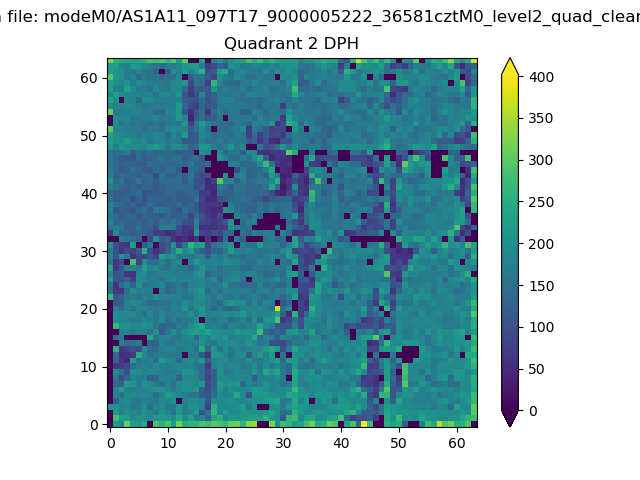
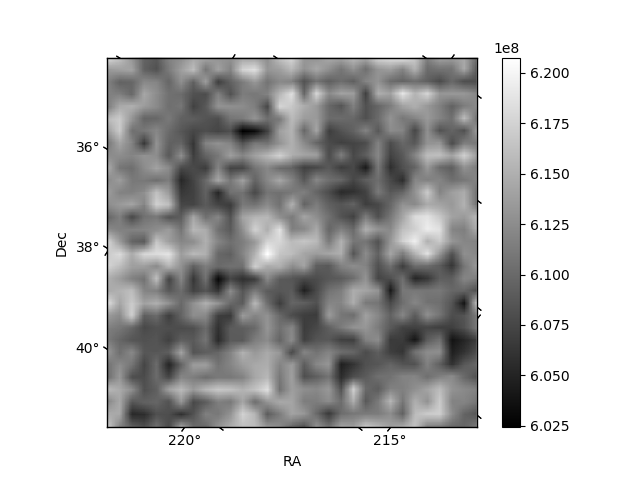
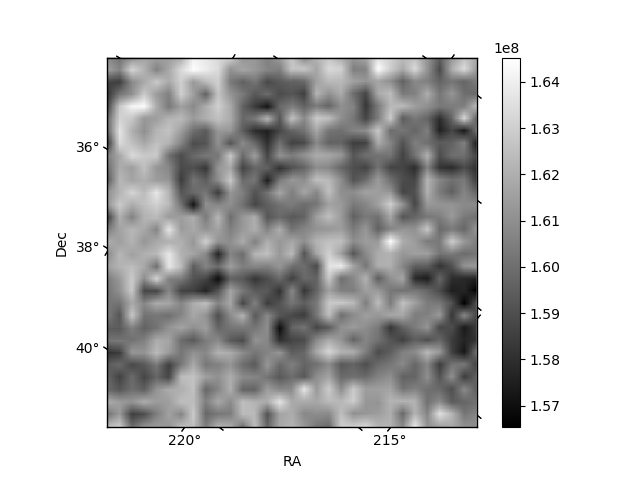
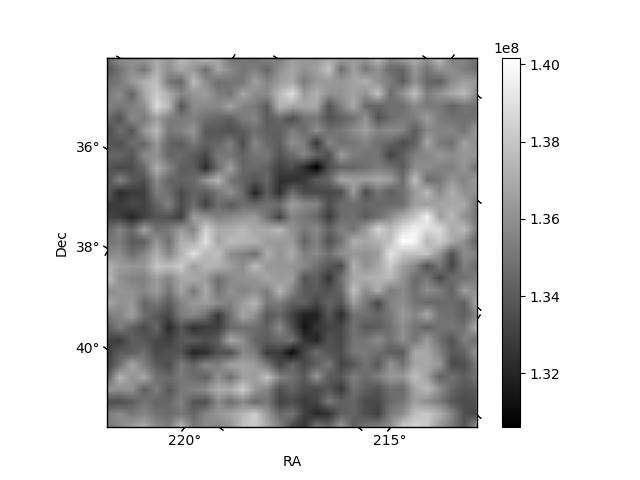
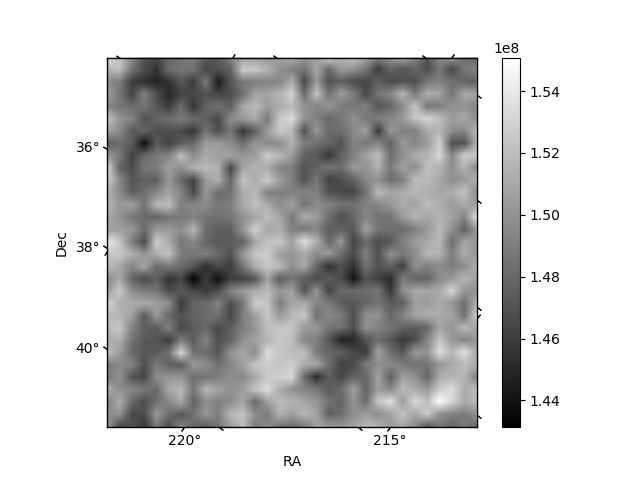
Histogram calculated using DETX and DETY for each event in the final _common_clean file
| Quadrant A | 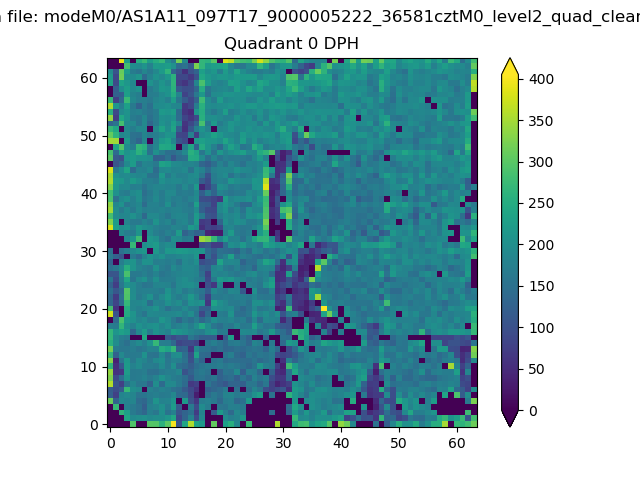 |
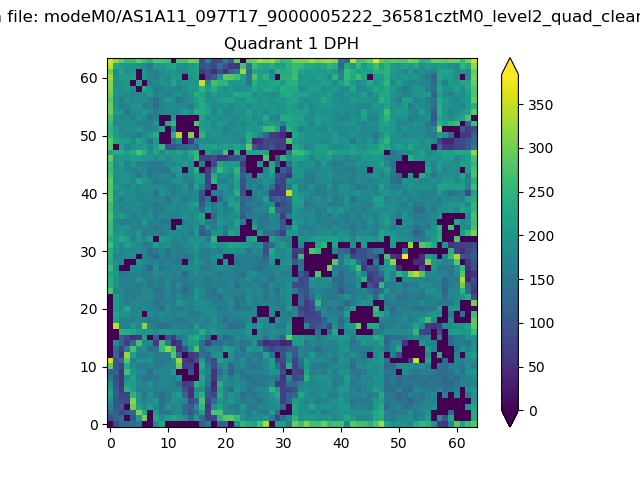 |
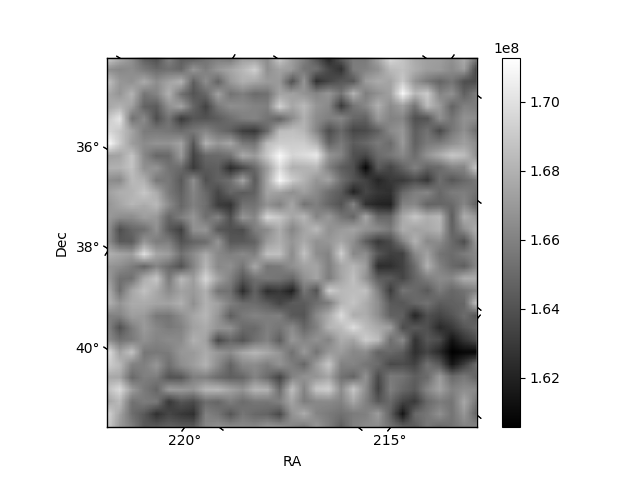
Quadrant B |
|---|---|---|---|
| Quadrant D | 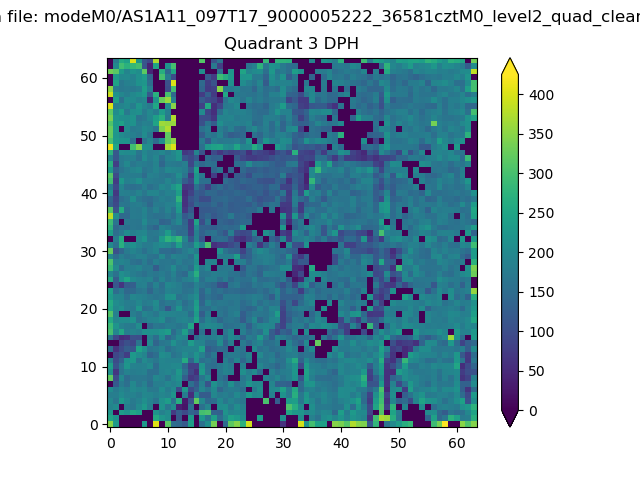 |
 |
Quadrant C |
| Plot type | Count rate plots | Images |
|---|---|---|
| Comparison with Poisson distribution Blue bars denote a histogram of data divided into 1 sec bins. Red curve is a Poisson curve with rate = median count rate of data. |
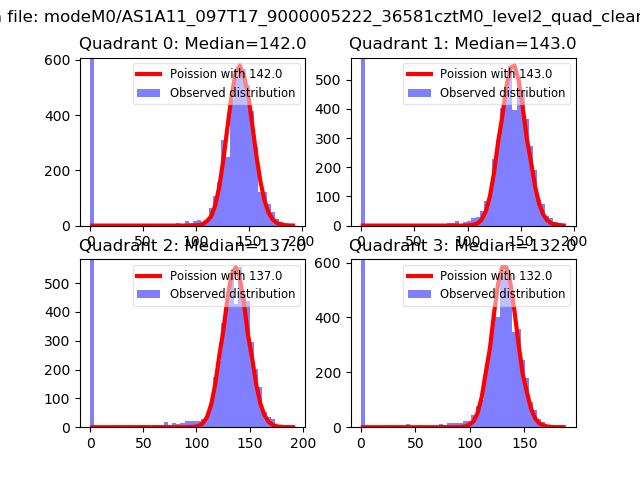 |
 |
| Quadrant-wise count rates Data is divided into 100 sec bins |
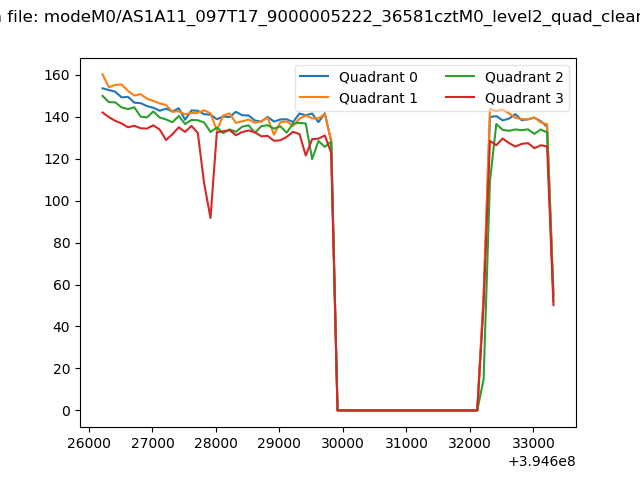 |
|
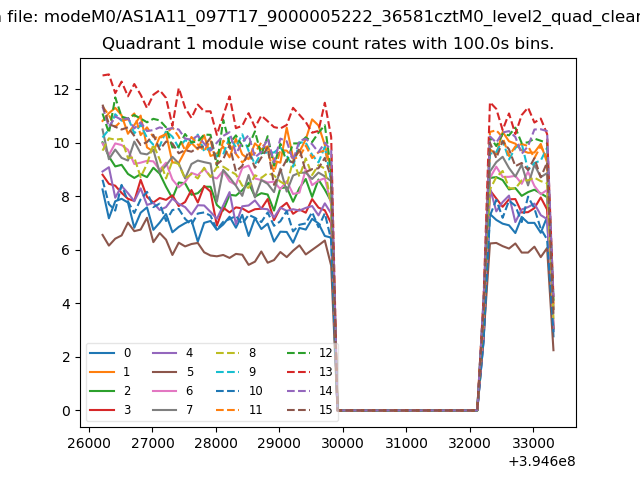
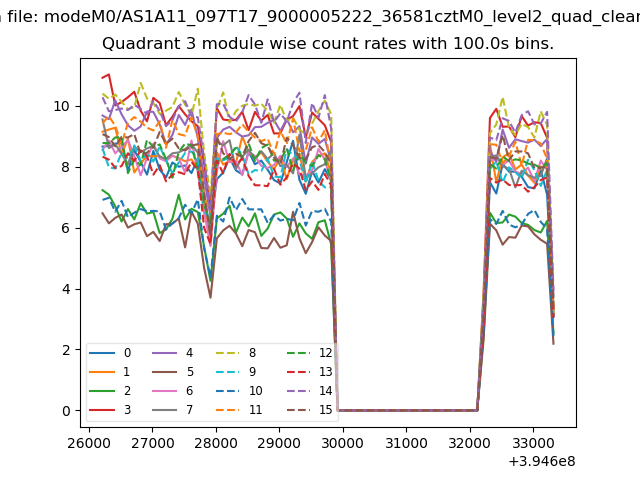
| Module-wise count rates for Quadrant A Data is divided into 100 sec bins |
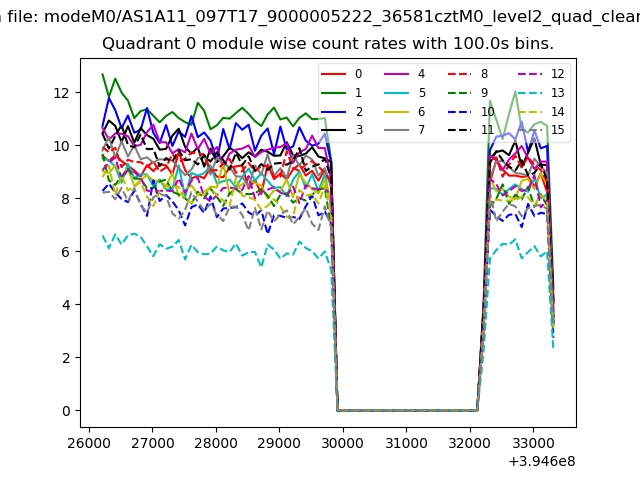 |
 |
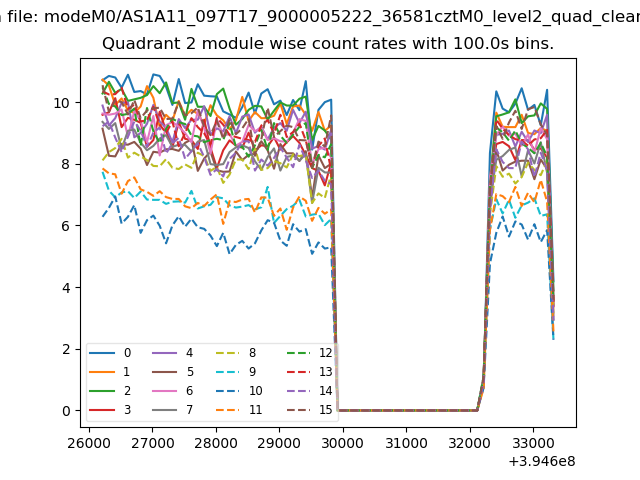
| Module-wise count rates for Quadrant B Data is divided into 100 sec bins |
 |
 |
| Module-wise count rates for Quadrant C Data is divided into 100 sec bins |
 |
 |
| Module-wise count rates for Quadrant D Data is divided into 100 sec bins |
 |
 |
| Parameter | Plot |
|---|---|
| CZT HV Monitor | 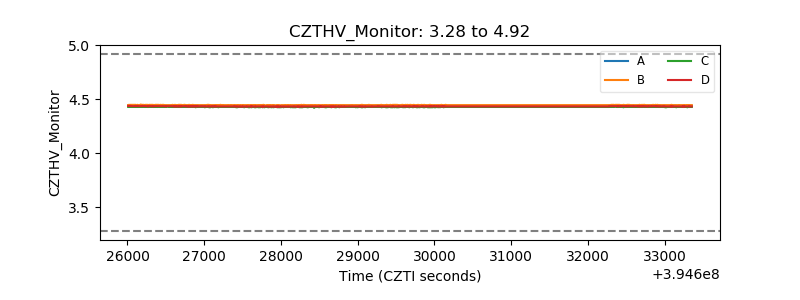 |
| D_VDD | 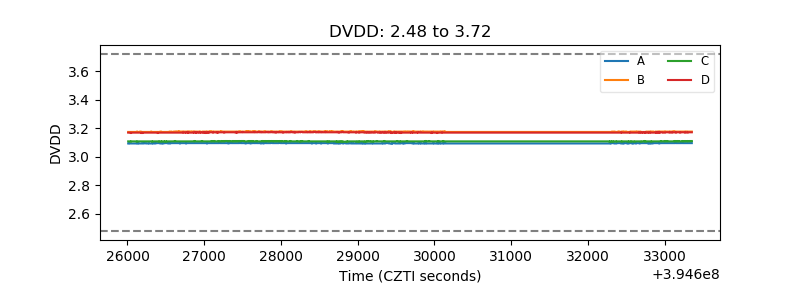 |
| Temperature 1 | 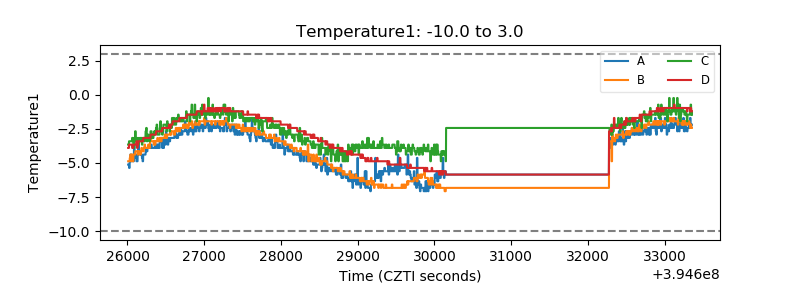 |
| Veto HV Monitor | 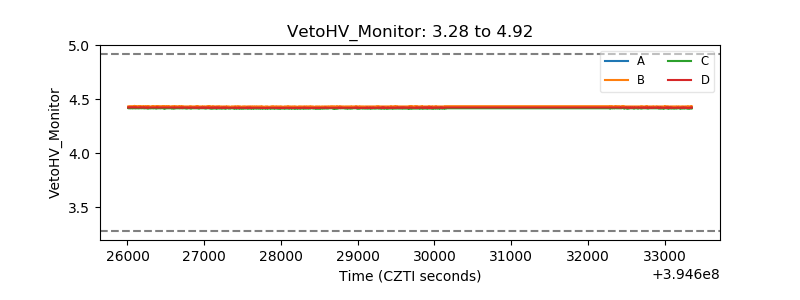 |
| Veto LLD | 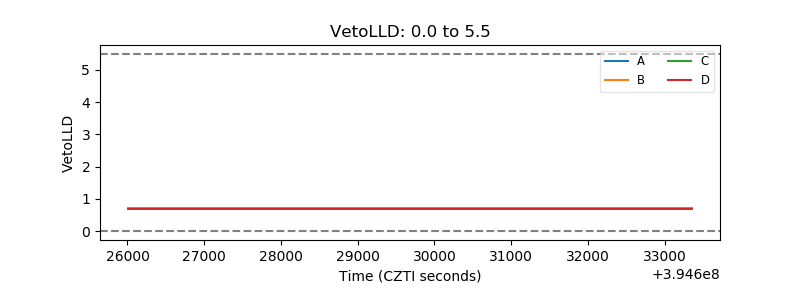 |
| Alpha Counter | 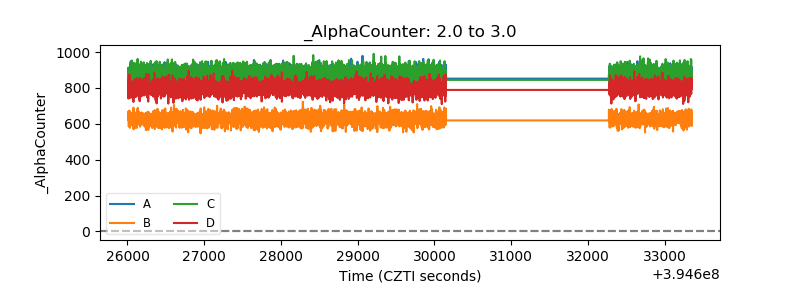 |
| _CPM_Rate | 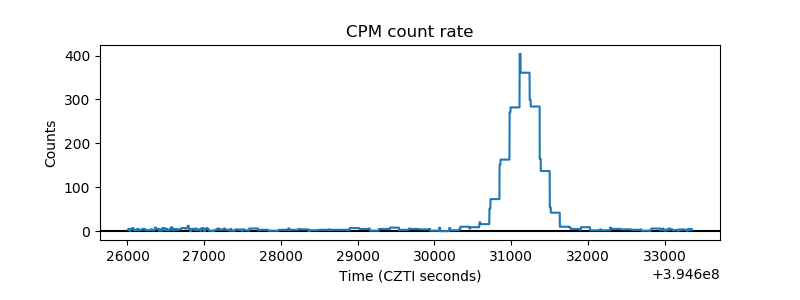 |
| CZT Counter | 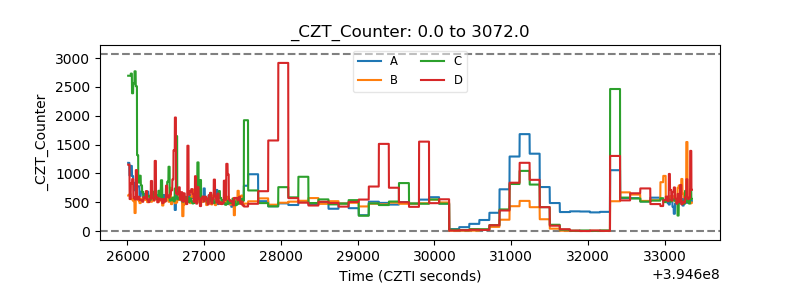 |
| +2.5 Volts monitor |  |
| +5 Volts monitor |  |
| _ROLL_ROT | 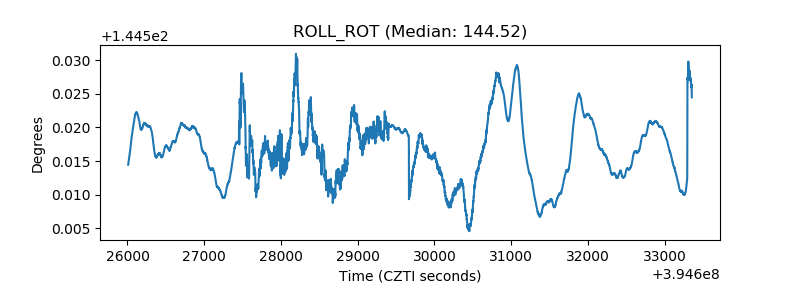 |
| _Roll_DEC | 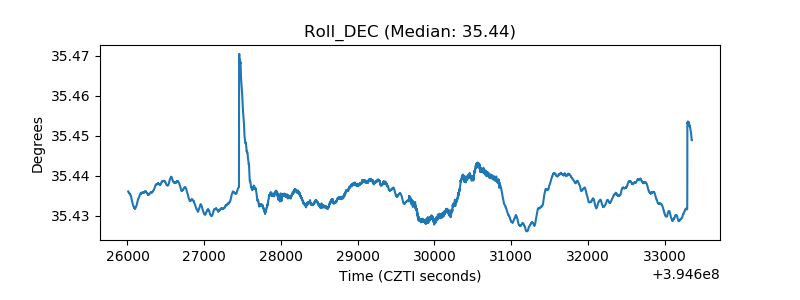 |
| _Roll_RA | 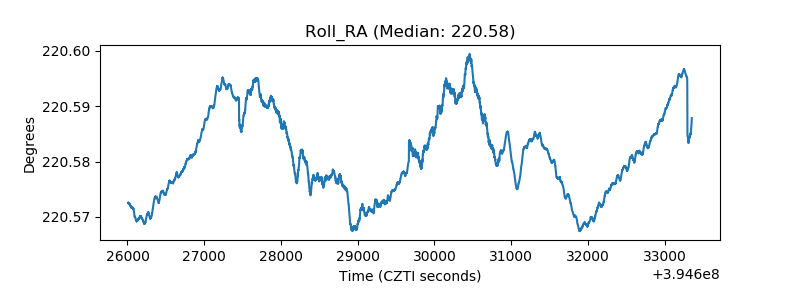 |
| Veto Counter | 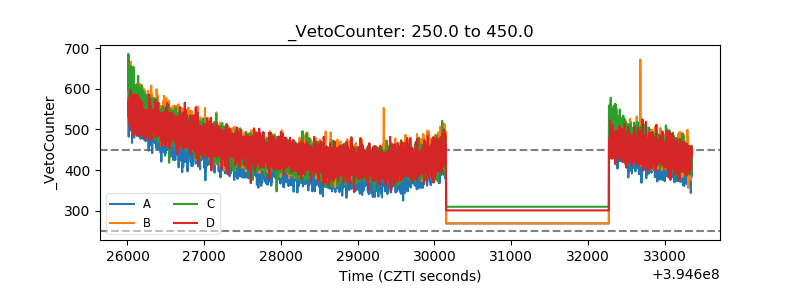 |