| Param | Original file | Final file |
|---|---|---|
| Filename | modeM0/AS1A11_097T17_9000005222_36582cztM0_level2.evt | modeM0/AS1A11_097T17_9000005222_36582cztM0_level2_quad_clean.evt |
| Size (bytes) | 407,260,800 | 85,728,960 |
| Size | 388.4 MB | 81.8 MB |
| Events in quadrant A | 2,565,908 | 575,684 |
| Events in quadrant B | 2,786,430 | 573,432 |
| Events in quadrant C | 3,087,038 | 551,887 |
| Events in quadrant D | 3,544,902 | 534,640 |
| Mode M0 | |||
|---|---|---|---|
| Quadrant | BADHDUFLAG | Total packets | Discarded packets |
| A | 0 | 10795 | 2 |
| B | 0 | 11574 | 1 |
| C | 0 | 12149 | 1 |
| D | 0 | 13932 | 1 |
| Mode M9 | |||
|---|---|---|---|
| Quadrant | BADHDUFLAG | Total packets | Discarded packets |
| A | 0 | 20 | 0 |
| B | 0 | 20 | 0 |
| C | 0 | 20 | 0 |
| D | 0 | 20 | 0 |
| Mode SS | |||
|---|---|---|---|
| Quadrant | BADHDUFLAG | Total packets | Discarded packets |
| A | 0 | 106 | 0 |
| B | 0 | 106 | 0 |
| C | 0 | 106 | 0 |
| D | 0 | 106 | 0 |
| Quadrant | Total seconds | Saturated seconds | Saturation percentage |
|---|---|---|---|
| A | 5142 | 6 | 0.116686% |
| B | 5142 | 19 | 0.369506% |
| C | 5142 | 129 | 2.508751% |
| D | 5142 | 89 | 1.730844% |
Noise dominated data is calculated using 1-second bins in cleaned event files. If a bin has >2000 counts, and if more than 50% of those come from <1% of pixels, then it is considered to be noise-dominated and hence unusable.
| Quadrant | # 1 sec bins | Bins with >0 counts | Bins with >2000 counts | High rate bins dominated by noise | Noise dominated (total time) | Noise dominated (detector-on time) | Marked lightcurve |
|---|---|---|---|---|---|---|---|
| A | 7115 | 5143 | 2 | 2 | 0.03% | 0.04% | 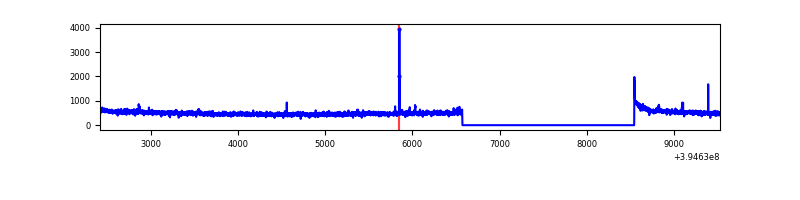 |
| B | 7115 | 5143 | 4 | 4 | 0.06% | 0.08% | 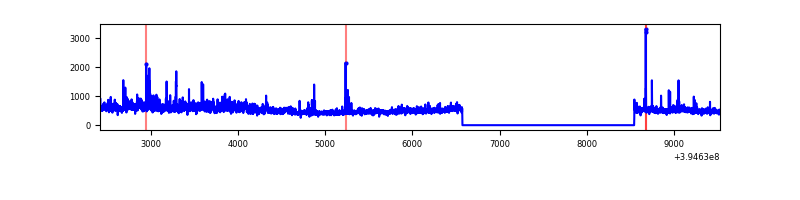 |
| C | 7115 | 5143 | 97 | 97 | 1.36% | 1.89% | 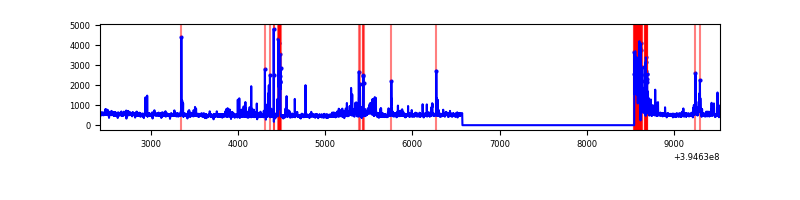 |
| D | 7115 | 5143 | 76 | 76 | 1.07% | 1.48% | 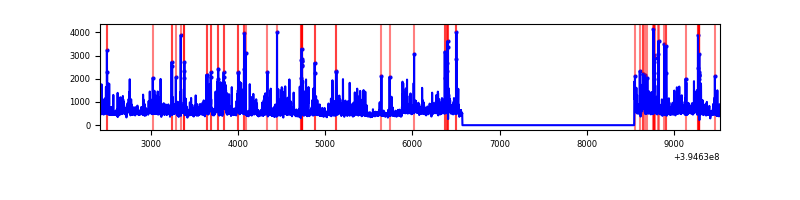 |
Top three noisy pixels from each quadrant. If the there are fewer than three noisy pixels in the level2.evt file, extra rows are filled as -1
| Pixel properties | Quadrant properties | ||||||
|---|---|---|---|---|---|---|---|
| Quadrant | DetID | PixID | Counts | Sigma | Mean | Median | Sigma |
| A | 10 | 83 | 171103 | 1394.36 | 605 | 594 | 122.3 |
| A | 15 | 223 | 49217 | 397.62 | 605 | 594 | 122.3 |
| A | 13 | 254 | 9129 | 69.8 | 605 | 594 | 122.3 |
| B | 0 | 213 | 274856 | 2408.73 | 595 | 580 | 113.9 |
| B | 0 | 190 | 62406 | 542.96 | 595 | 580 | 113.9 |
| B | 4 | 232 | 24451 | 209.64 | 595 | 580 | 113.9 |
| C | 0 | 10 | 324131 | 2400.08 | 580 | 585 | 134.8 |
| C | 14 | 254 | 257716 | 1907.41 | 580 | 585 | 134.8 |
| C | 15 | 214 | 217673 | 1610.37 | 580 | 585 | 134.8 |
| D | 12 | 235 | 407849 | 2829.09 | 588 | 571 | 144.0 |
| D | 5 | 222 | 222894 | 1544.33 | 588 | 571 | 144.0 |
| D | 2 | 153 | 123733 | 855.52 | 588 | 571 | 144.0 |
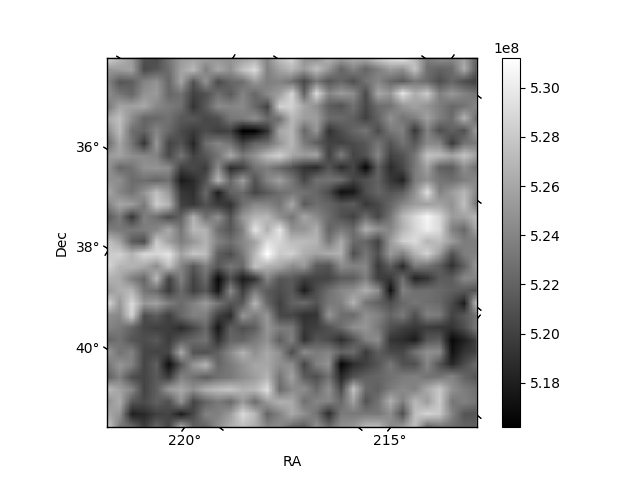
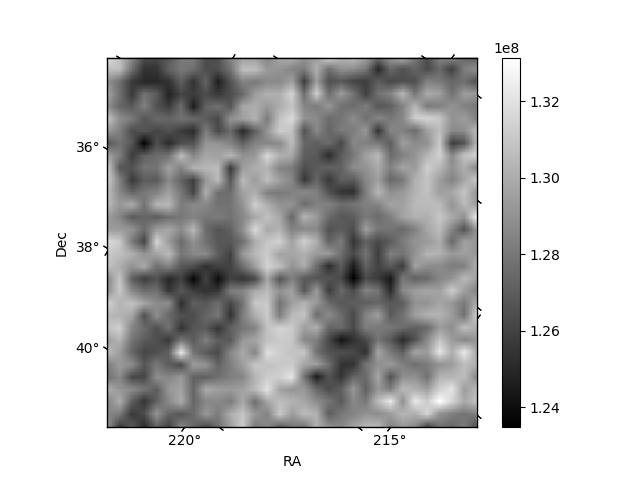
Histogram calculated using DETX and DETY for each event in the final _common_clean file
| Quadrant A | 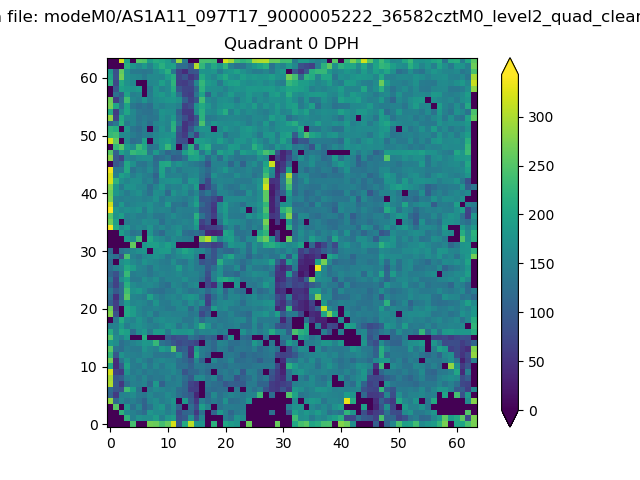 |
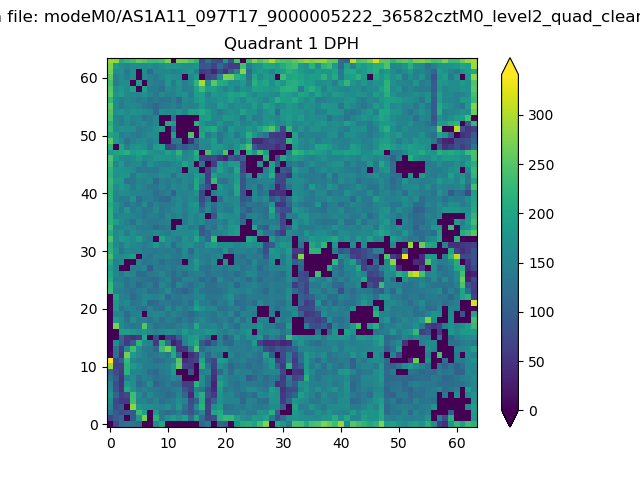 |
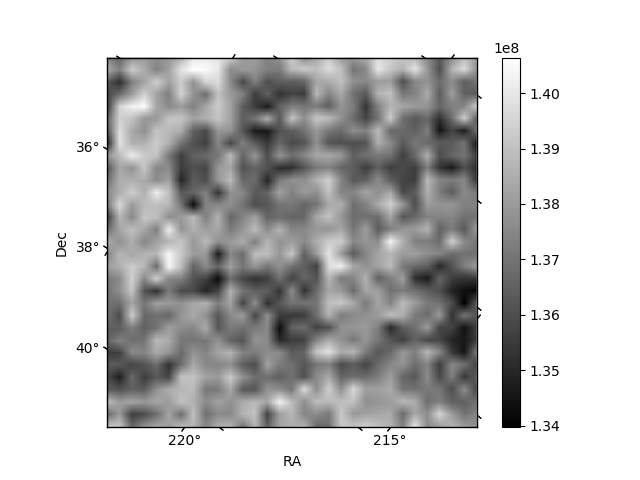
Quadrant B |
|---|---|---|---|
| Quadrant D | 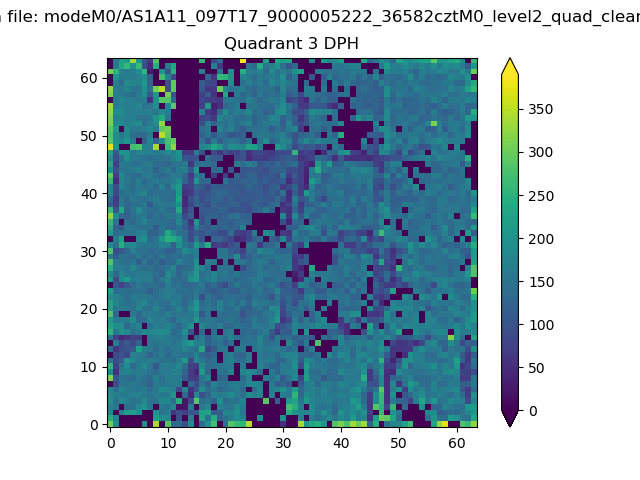 |
 |
Quadrant C |
| Plot type | Count rate plots | Images |
|---|---|---|
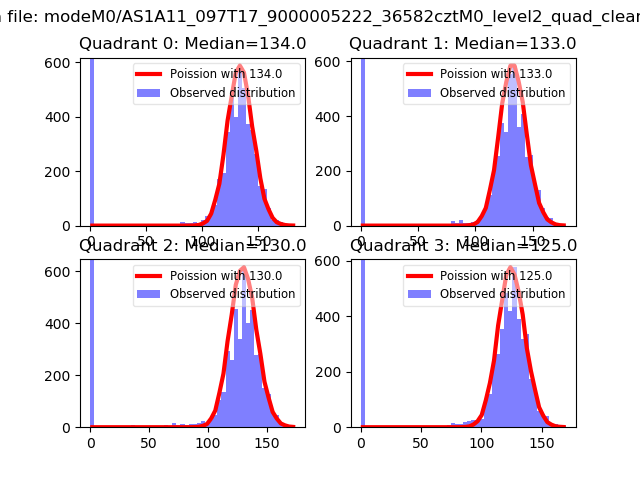
| Comparison with Poisson distribution Blue bars denote a histogram of data divided into 1 sec bins. Red curve is a Poisson curve with rate = median count rate of data. |
 |
 |
| Quadrant-wise count rates Data is divided into 100 sec bins |
 |
|
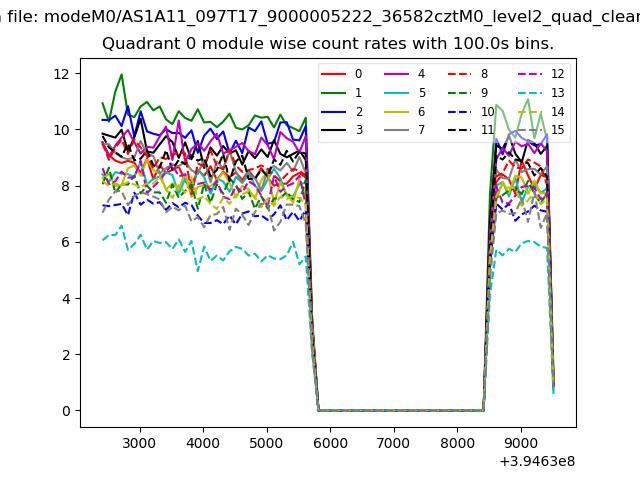
| Module-wise count rates for Quadrant A Data is divided into 100 sec bins |
 |
 |
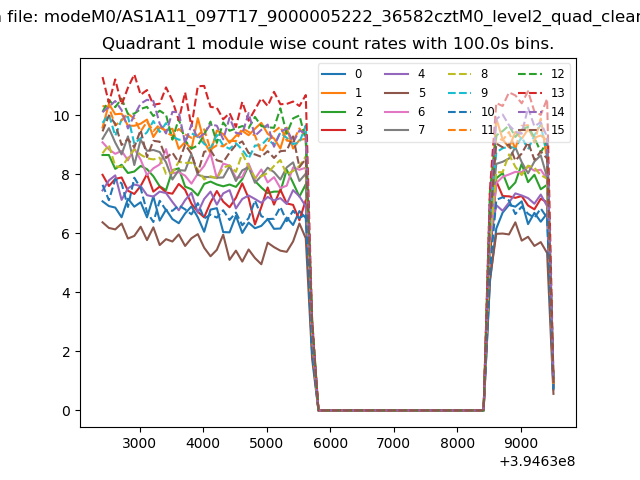
| Module-wise count rates for Quadrant B Data is divided into 100 sec bins |
 |
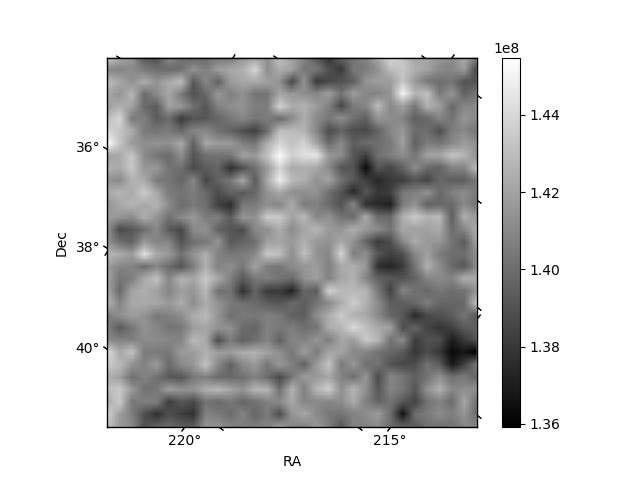 |
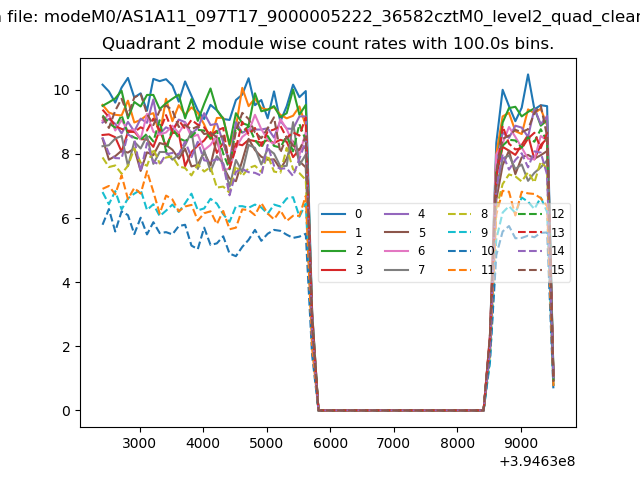
| Module-wise count rates for Quadrant C Data is divided into 100 sec bins |
 |
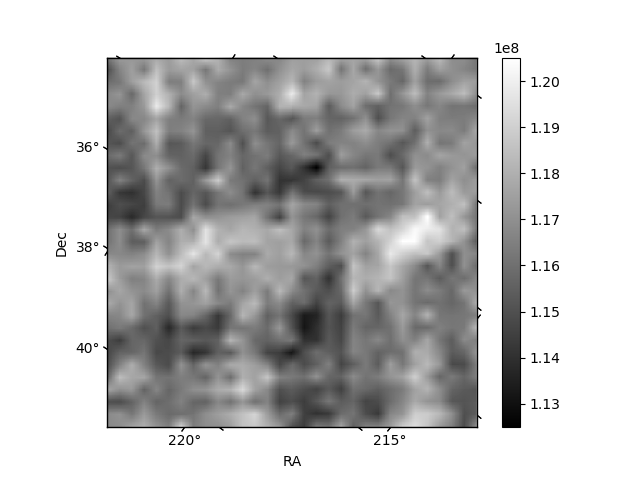 |
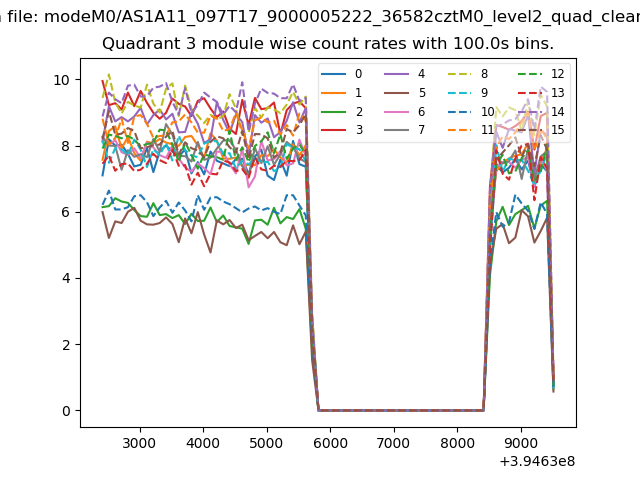
| Module-wise count rates for Quadrant D Data is divided into 100 sec bins |
 |
 |
| Parameter | Plot |
|---|---|
| CZT HV Monitor | 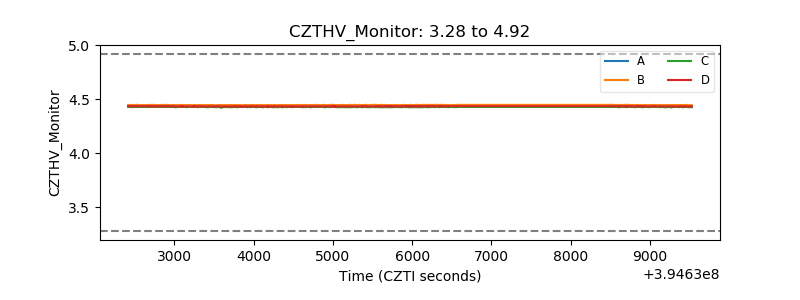 |
| D_VDD | 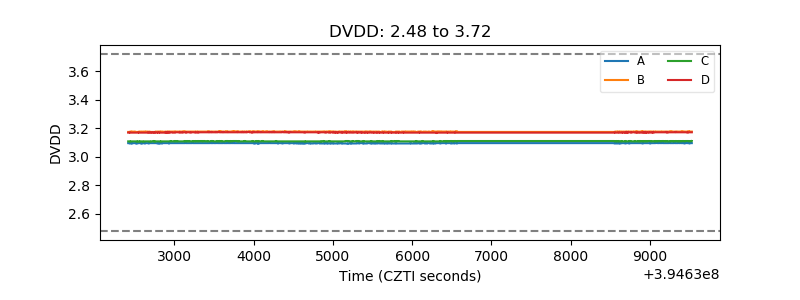 |
| Temperature 1 | 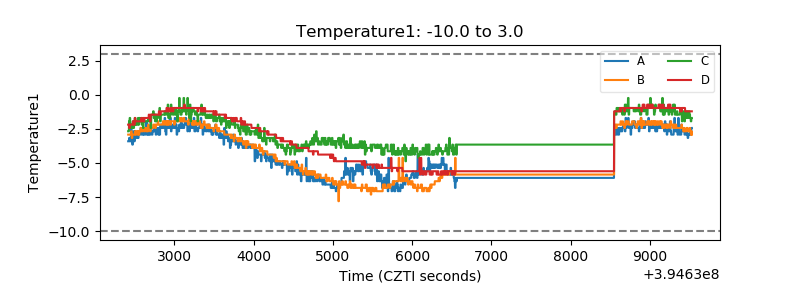 |
| Veto HV Monitor | 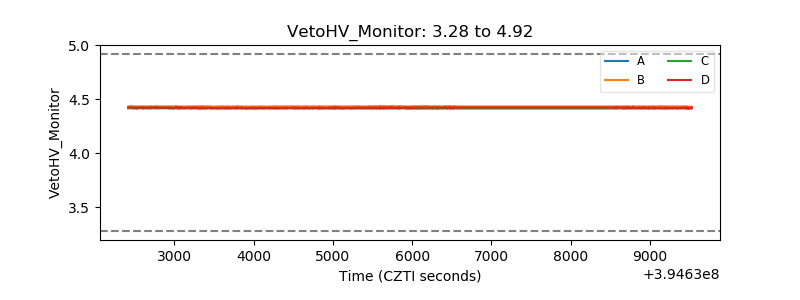 |
| Veto LLD | 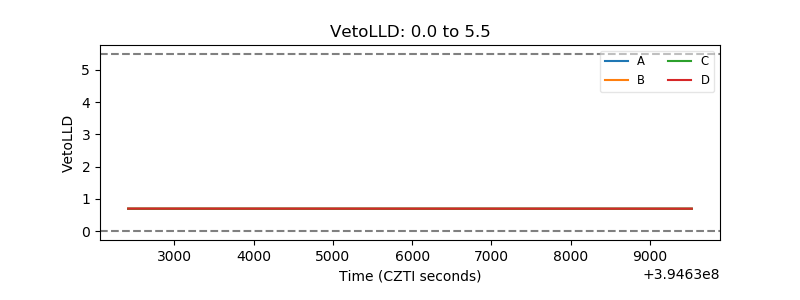 |
| Alpha Counter |  |
| _CPM_Rate |  |
| CZT Counter | 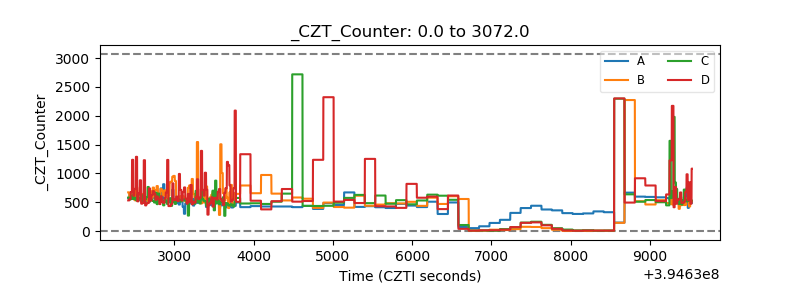 |
| +2.5 Volts monitor |  |
| +5 Volts monitor |  |
| _ROLL_ROT | 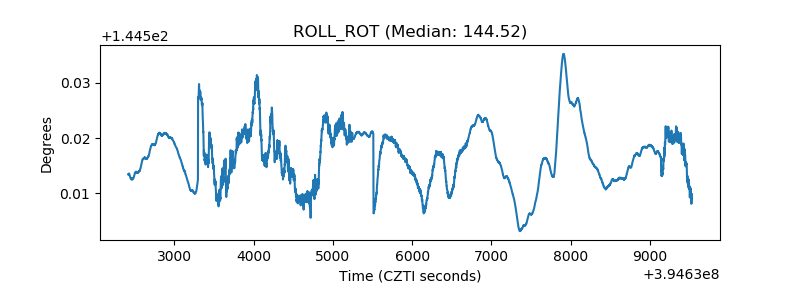 |
| _Roll_DEC | 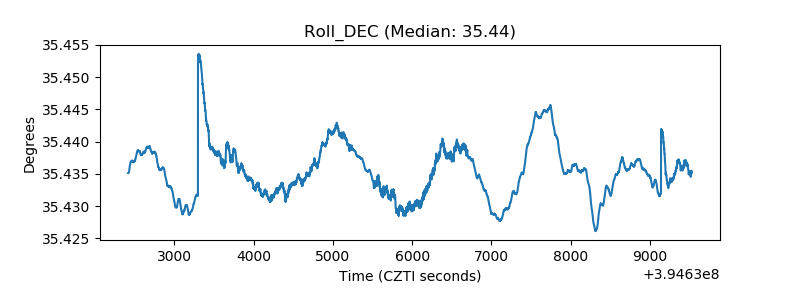 |
| _Roll_RA | 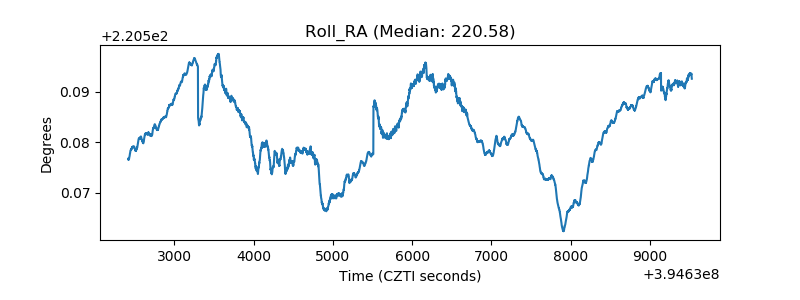 |
| Veto Counter | 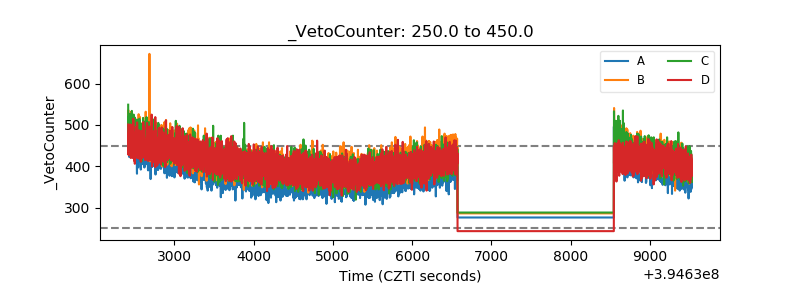 |