| Param | Original file | Final file |
|---|---|---|
| Filename | modeM0/AS1A11_097T17_9000005222_36583cztM0_level2.evt | modeM0/AS1A11_097T17_9000005222_36583cztM0_level2_quad_clean.evt |
| Size (bytes) | 413,236,800 | 72,648,000 |
| Size | 394.1 MB | 69.3 MB |
| Events in quadrant A | 2,642,640 | 469,816 |
| Events in quadrant B | 2,648,297 | 466,994 |
| Events in quadrant C | 3,216,611 | 456,432 |
| Events in quadrant D | 3,649,698 | 438,031 |
| Mode M0 | |||
|---|---|---|---|
| Quadrant | BADHDUFLAG | Total packets | Discarded packets |
| A | 0 | 11193 | 2 |
| B | 0 | 11218 | 1 |
| C | 0 | 12710 | 1 |
| D | 0 | 14324 | 1 |
| Mode M9 | |||
|---|---|---|---|
| Quadrant | BADHDUFLAG | Total packets | Discarded packets |
| A | 0 | 16 | 0 |
| B | 0 | 16 | 0 |
| C | 0 | 16 | 0 |
| D | 0 | 16 | 0 |
| Mode SS | |||
|---|---|---|---|
| Quadrant | BADHDUFLAG | Total packets | Discarded packets |
| A | 0 | 108 | 0 |
| B | 0 | 108 | 0 |
| C | 0 | 108 | 0 |
| D | 0 | 108 | 0 |
| Quadrant | Total seconds | Saturated seconds | Saturation percentage |
|---|---|---|---|
| A | 5258 | 43 | 0.817801% |
| B | 5258 | 46 | 0.874857% |
| C | 5258 | 117 | 2.225181% |
| D | 5258 | 175 | 3.328262% |
Noise dominated data is calculated using 1-second bins in cleaned event files. If a bin has >2000 counts, and if more than 50% of those come from <1% of pixels, then it is considered to be noise-dominated and hence unusable.
| Quadrant | # 1 sec bins | Bins with >0 counts | Bins with >2000 counts | High rate bins dominated by noise | Noise dominated (total time) | Noise dominated (detector-on time) | Marked lightcurve |
|---|---|---|---|---|---|---|---|
| A | 6902 | 5259 | 34 | 34 | 0.49% | 0.65% | 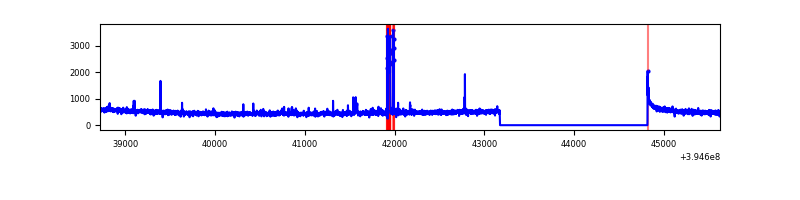 |
| B | 6902 | 5259 | 31 | 31 | 0.45% | 0.59% | 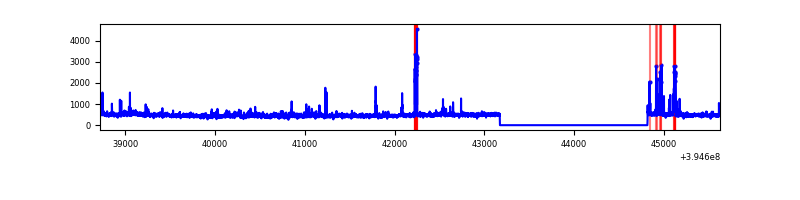 |
| C | 6902 | 5259 | 102 | 102 | 1.48% | 1.94% | 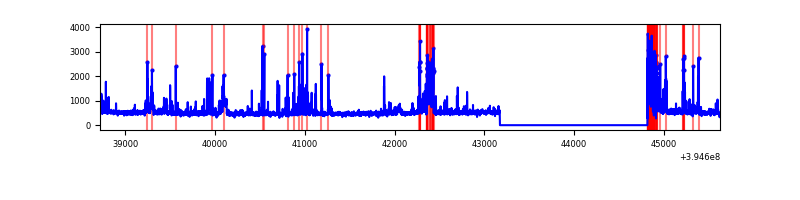 |
| D | 6902 | 5259 | 159 | 159 | 2.30% | 3.02% | 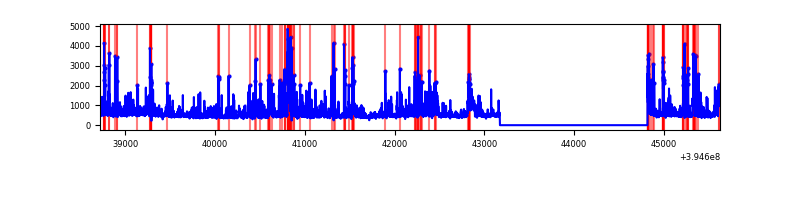 |
Top three noisy pixels from each quadrant. If the there are fewer than three noisy pixels in the level2.evt file, extra rows are filled as -1
| Pixel properties | Quadrant properties | ||||||
|---|---|---|---|---|---|---|---|
| Quadrant | DetID | PixID | Counts | Sigma | Mean | Median | Sigma |
| A | 10 | 83 | 167660 | 1378.61 | 598 | 587 | 121.2 |
| A | 15 | 223 | 148444 | 1220.04 | 598 | 587 | 121.2 |
| A | 9 | 143 | 11841 | 92.86 | 598 | 587 | 121.2 |
| B | 5 | 255 | 114603 | 1000.13 | 594 | 579 | 114.0 |
| B | 5 | 172 | 47339 | 410.14 | 594 | 579 | 114.0 |
| B | 0 | 213 | 44850 | 388.31 | 594 | 579 | 114.0 |
| C | 0 | 10 | 310938 | 2288.84 | 584 | 590 | 135.6 |
| C | 14 | 254 | 303912 | 2237.02 | 584 | 590 | 135.6 |
| C | 15 | 214 | 220133 | 1619.15 | 584 | 590 | 135.6 |
| D | 12 | 235 | 312767 | 2204.65 | 582 | 566 | 141.6 |
| D | 13 | 249 | 179250 | 1261.8 | 582 | 566 | 141.6 |
| D | 12 | 227 | 129753 | 912.27 | 582 | 566 | 141.6 |
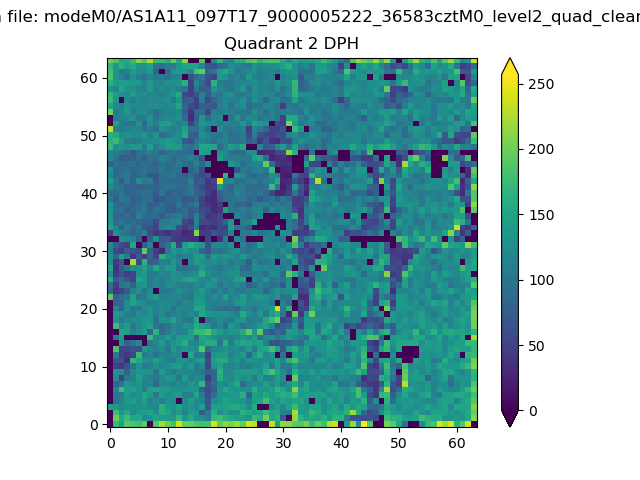
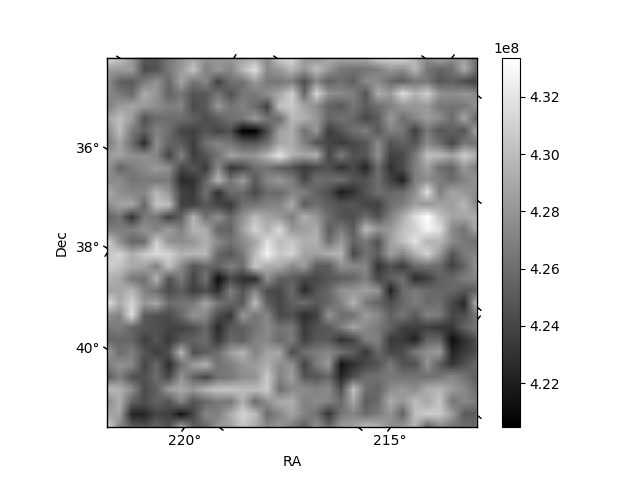
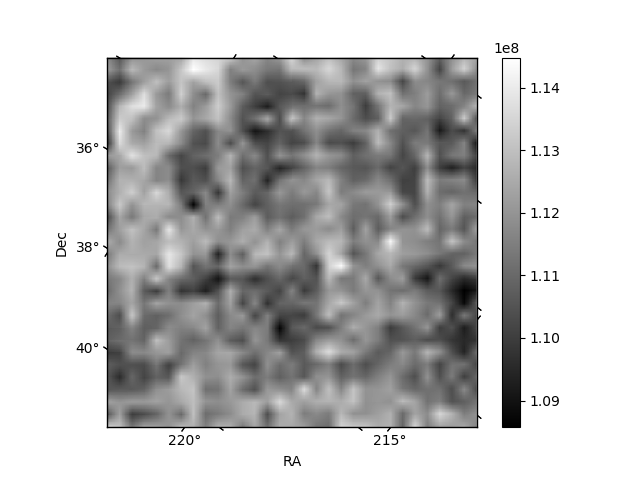
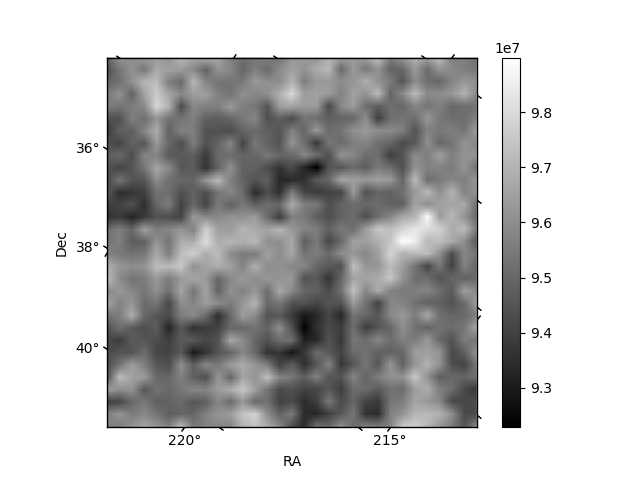
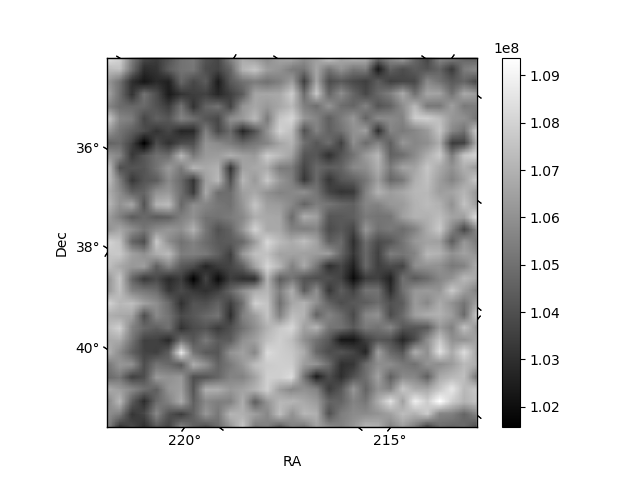
Histogram calculated using DETX and DETY for each event in the final _common_clean file
| Quadrant A | 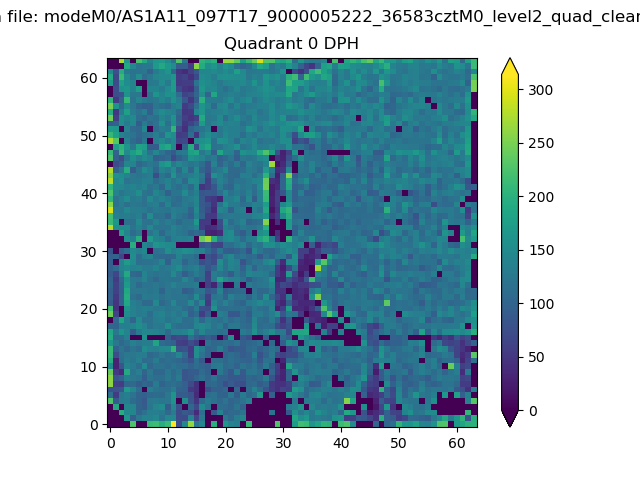 |
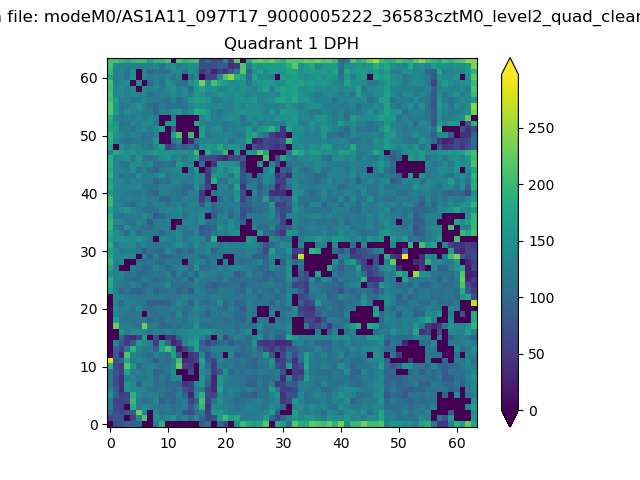 |
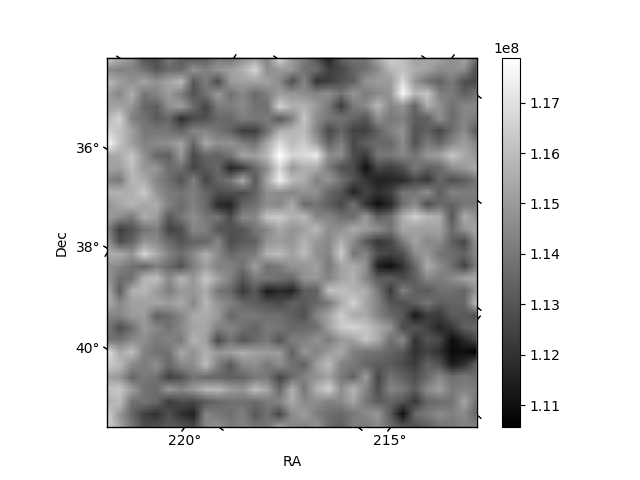
Quadrant B |
|---|---|---|---|
| Quadrant D | 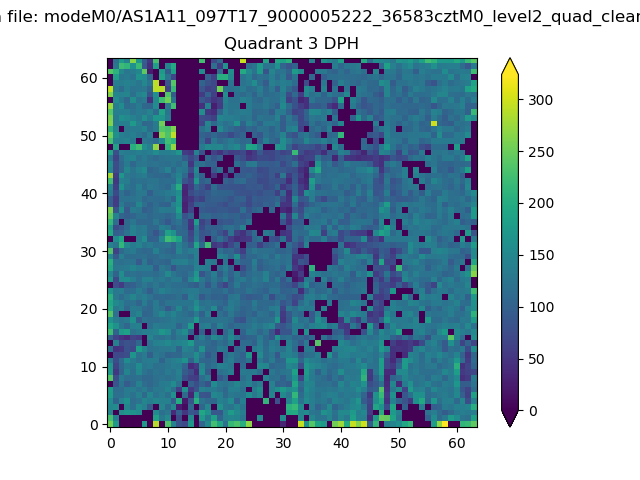 |
 |
Quadrant C |
| Plot type | Count rate plots | Images |
|---|---|---|
| Comparison with Poisson distribution Blue bars denote a histogram of data divided into 1 sec bins. Red curve is a Poisson curve with rate = median count rate of data. |
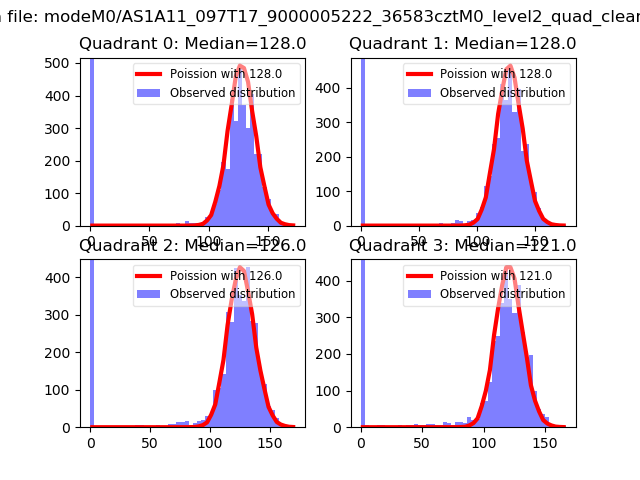 |
 |
| Quadrant-wise count rates Data is divided into 100 sec bins |
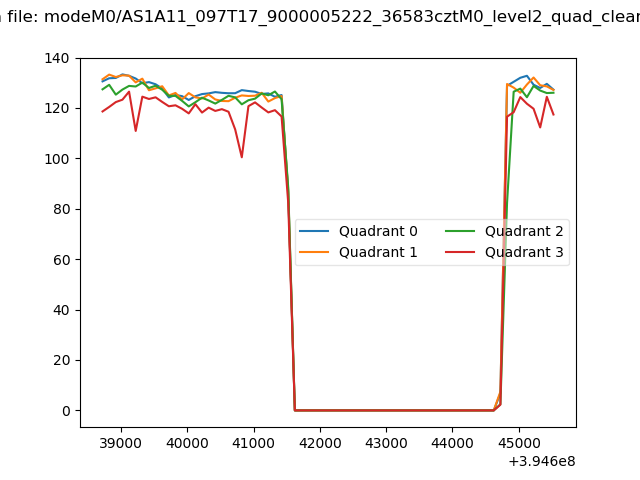 |
|
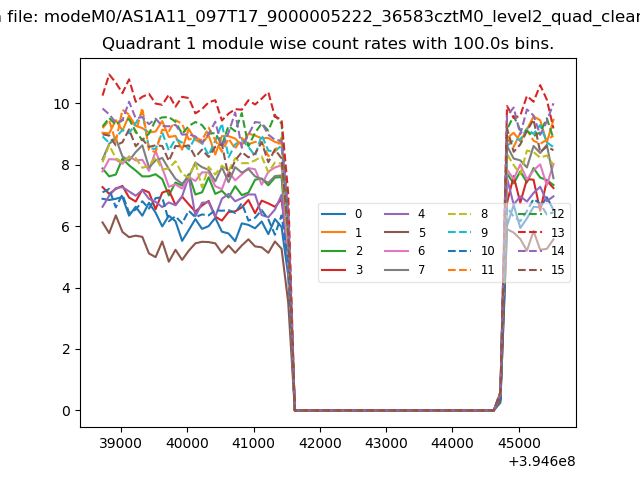
| Module-wise count rates for Quadrant A Data is divided into 100 sec bins |
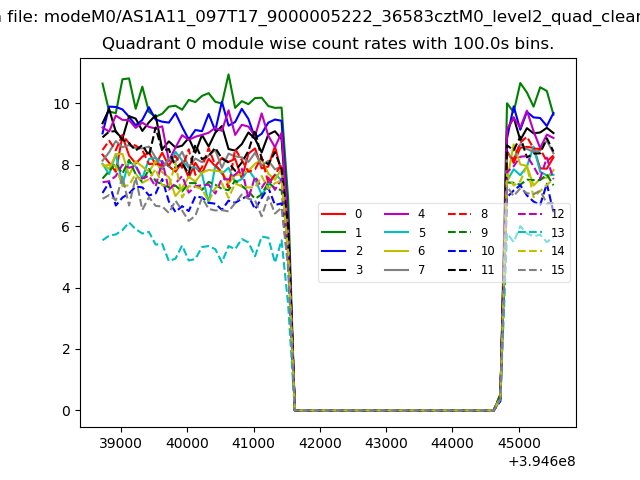 |
 |
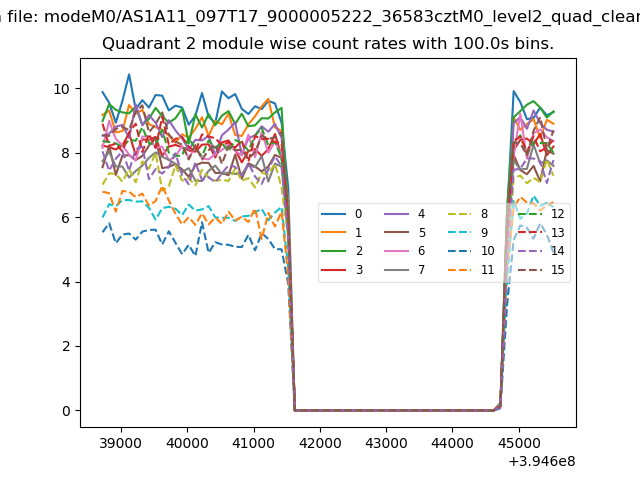
| Module-wise count rates for Quadrant B Data is divided into 100 sec bins |
 |
 |
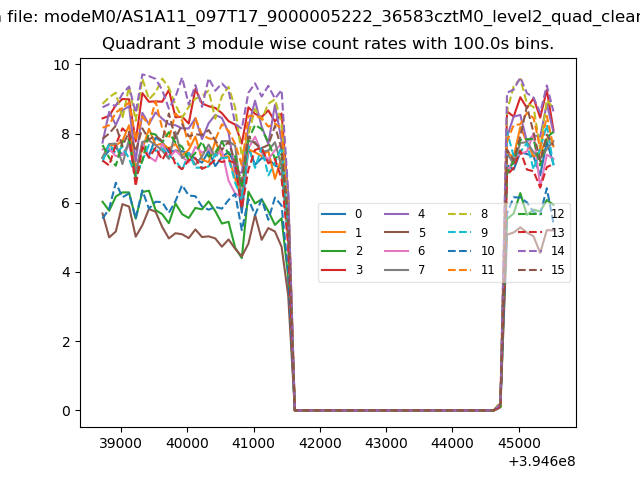
| Module-wise count rates for Quadrant C Data is divided into 100 sec bins |
 |
 |
| Module-wise count rates for Quadrant D Data is divided into 100 sec bins |
 |
 |
| Parameter | Plot |
|---|---|
| CZT HV Monitor | 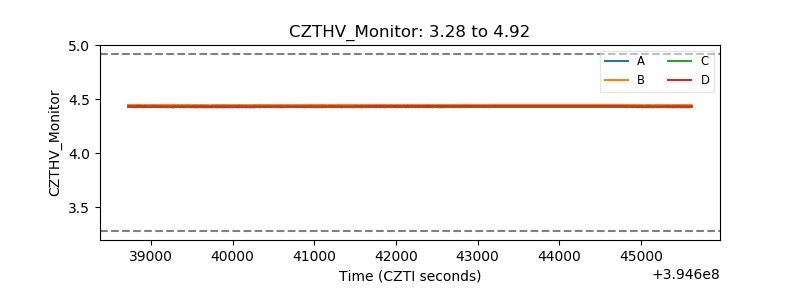 |
| D_VDD | 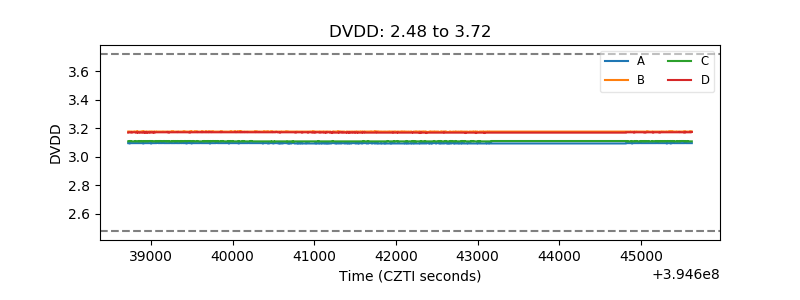 |
| Temperature 1 | 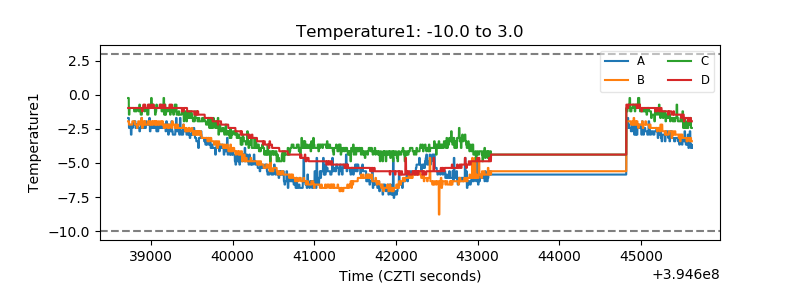 |
| Veto HV Monitor | 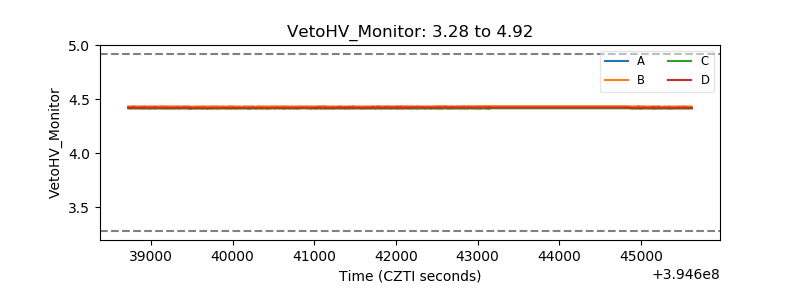 |
| Veto LLD | 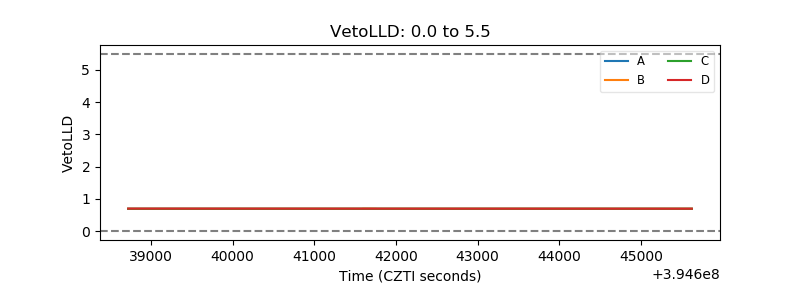 |
| Alpha Counter | 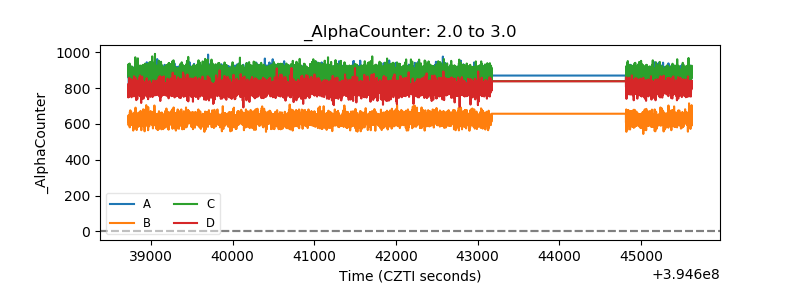 |
| _CPM_Rate | 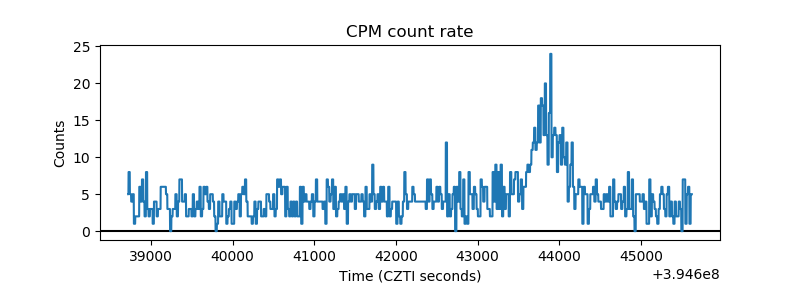 |
| CZT Counter | 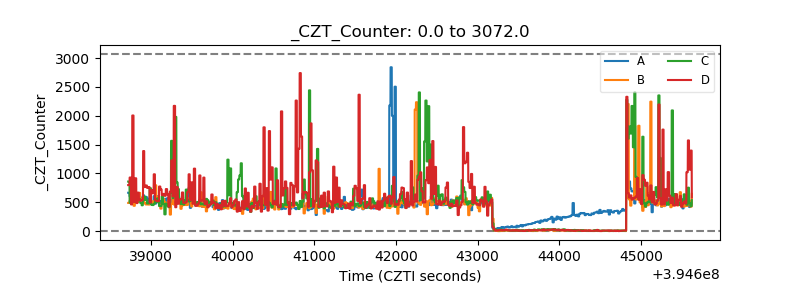 |
| +2.5 Volts monitor |  |
| +5 Volts monitor |  |
| _ROLL_ROT | 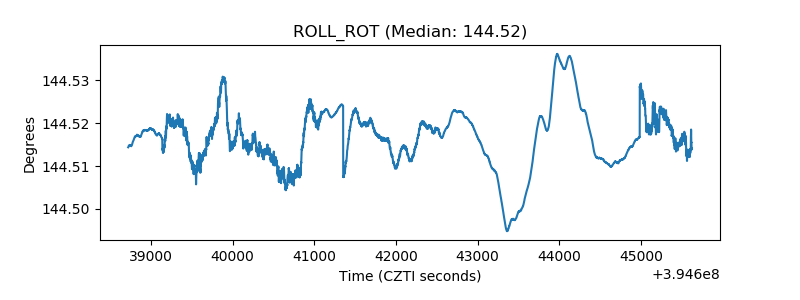 |
| _Roll_DEC | 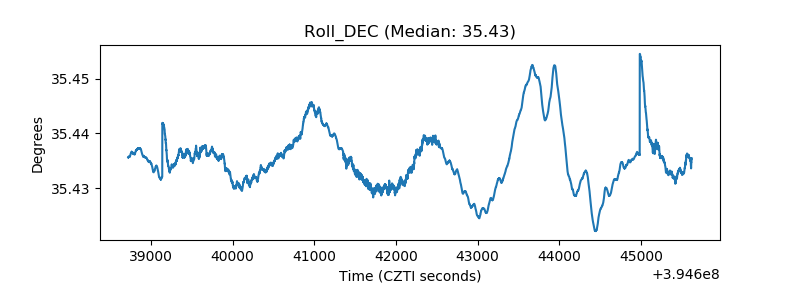 |
| _Roll_RA | 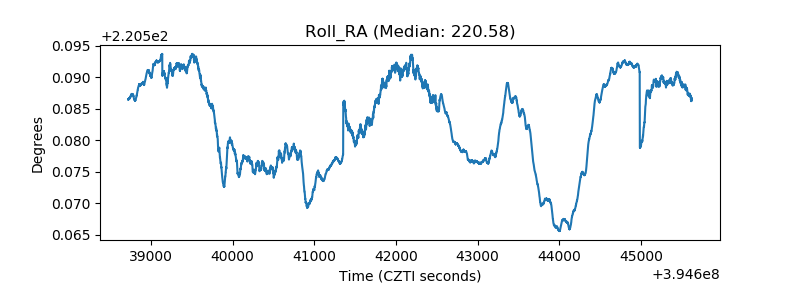 |
| Veto Counter | 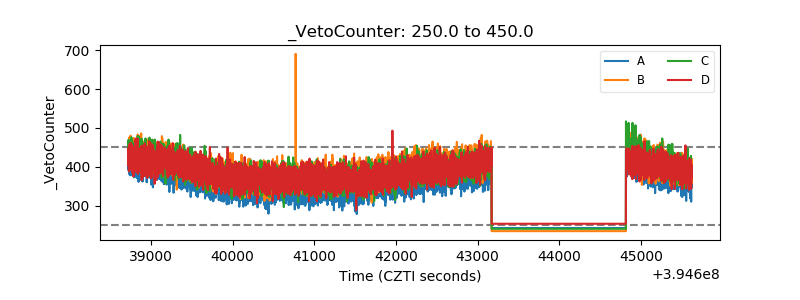 |