| Param | Original file | Final file |
|---|---|---|
| Filename | modeM0/AS1A11_097T17_9000005222_36584cztM0_level2.evt | modeM0/AS1A11_097T17_9000005222_36584cztM0_level2_quad_clean.evt |
| Size (bytes) | 189,907,200 | 39,084,480 |
| Size | 181.1 MB | 37.3 MB |
| Events in quadrant A | 1,047,246 | 265,700 |
| Events in quadrant B | 1,139,108 | 264,502 |
| Events in quadrant C | 1,290,871 | 256,351 |
| Events in quadrant D | 2,127,606 | 242,608 |
| Mode M0 | |||
|---|---|---|---|
| Quadrant | BADHDUFLAG | Total packets | Discarded packets |
| A | 0 | 4551 | 1 |
| B | 0 | 4782 | 1 |
| C | 0 | 5183 | 1 |
| D | 0 | 7771 | 1 |
| Mode M9 | |||
|---|---|---|---|
| Quadrant | BADHDUFLAG | Total packets | Discarded packets |
| A | 0 | 8 | 0 |
| B | 0 | 8 | 0 |
| C | 0 | 8 | 0 |
| D | 0 | 9 | 0 |
| Mode SS | |||
|---|---|---|---|
| Quadrant | BADHDUFLAG | Total packets | Discarded packets |
| A | 0 | 44 | 0 |
| B | 0 | 44 | 0 |
| C | 0 | 44 | 0 |
| D | 0 | 44 | 0 |
| Quadrant | Total seconds | Saturated seconds | Saturation percentage |
|---|---|---|---|
| A | 2121 | 8 | 0.377181% |
| B | 2121 | 24 | 1.131542% |
| C | 2121 | 91 | 4.290429% |
| D | 2121 | 187 | 8.816596% |
Noise dominated data is calculated using 1-second bins in cleaned event files. If a bin has >2000 counts, and if more than 50% of those come from <1% of pixels, then it is considered to be noise-dominated and hence unusable.
| Quadrant | # 1 sec bins | Bins with >0 counts | Bins with >2000 counts | High rate bins dominated by noise | Noise dominated (total time) | Noise dominated (detector-on time) | Marked lightcurve |
|---|---|---|---|---|---|---|---|
| A | 2121 | 2121 | 5 | 5 | 0.24% | 0.24% | 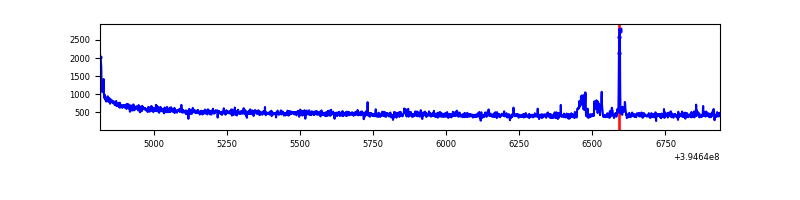 |
| B | 2121 | 2121 | 17 | 17 | 0.80% | 0.80% | 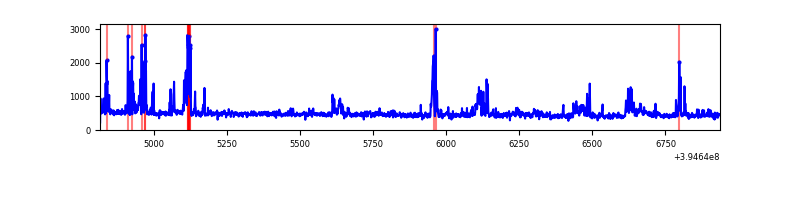 |
| C | 2121 | 2121 | 67 | 67 | 3.16% | 3.16% | 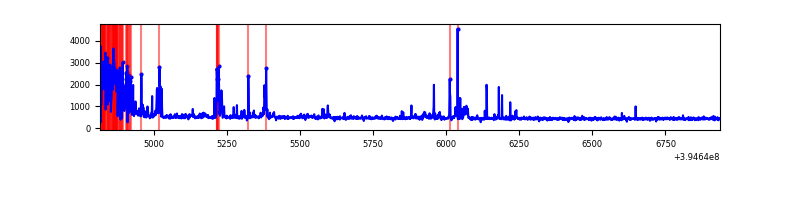 |
| D | 2121 | 2121 | 192 | 192 | 9.05% | 9.05% | 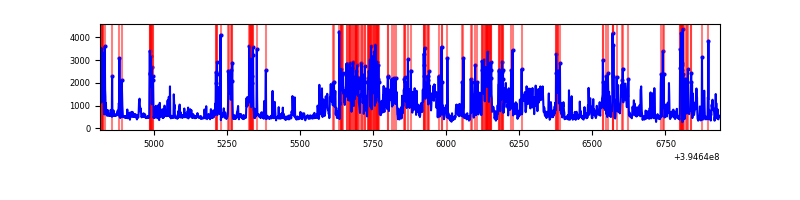 |
Top three noisy pixels from each quadrant. If the there are fewer than three noisy pixels in the level2.evt file, extra rows are filled as -1
| Pixel properties | Quadrant properties | ||||||
|---|---|---|---|---|---|---|---|
| Quadrant | DetID | PixID | Counts | Sigma | Mean | Median | Sigma |
| A | 10 | 83 | 94855 | 1946.62 | 233 | 227 | 48.6 |
| A | 15 | 223 | 44091 | 902.34 | 233 | 227 | 48.6 |
| A | 13 | 254 | 3769 | 72.86 | 233 | 227 | 48.6 |
| B | 5 | 255 | 105623 | 2323.67 | 230 | 224 | 45.4 |
| B | 0 | 221 | 33156 | 726.03 | 230 | 224 | 45.4 |
| B | 5 | 172 | 32389 | 709.12 | 230 | 224 | 45.4 |
| C | 0 | 10 | 201883 | 3700.24 | 226 | 228 | 54.5 |
| C | 14 | 254 | 106683 | 1953.38 | 226 | 228 | 54.5 |
| C | 15 | 214 | 90458 | 1655.66 | 226 | 228 | 54.5 |
| D | 10 | 246 | 581001 | 10363.38 | 225 | 219 | 56.0 |
| D | 13 | 171 | 125350 | 2232.82 | 225 | 219 | 56.0 |
| D | 12 | 235 | 121154 | 2157.94 | 225 | 219 | 56.0 |
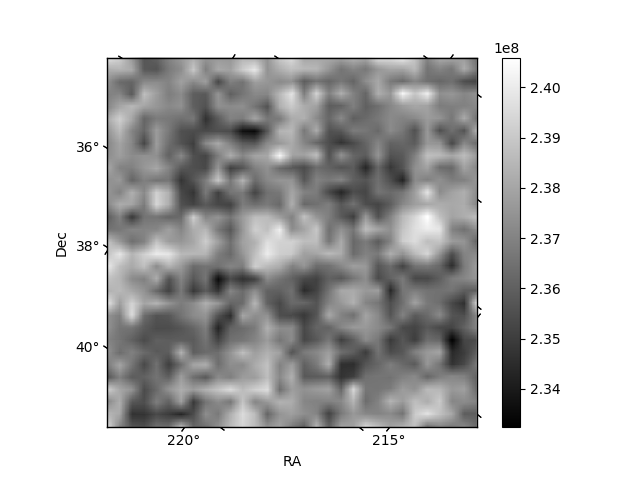
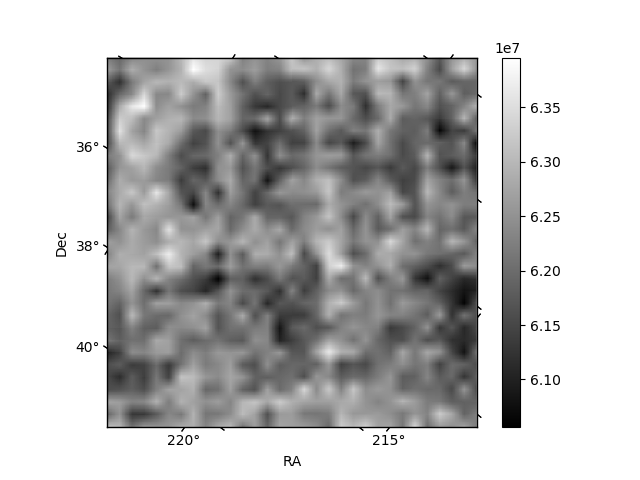
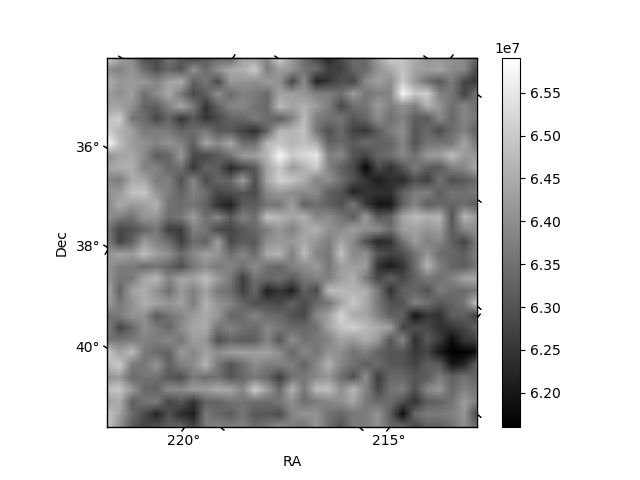
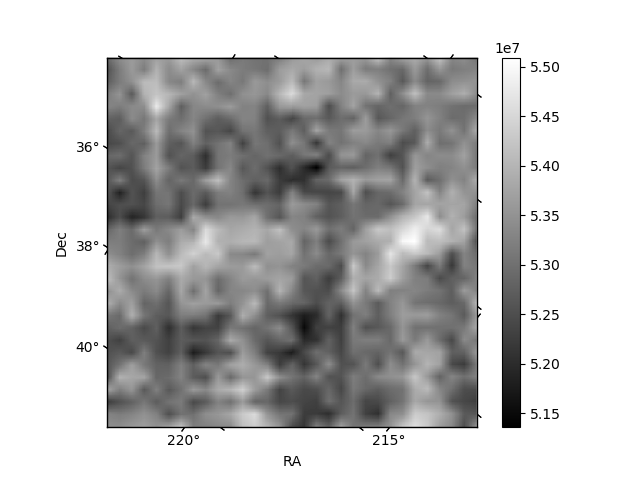
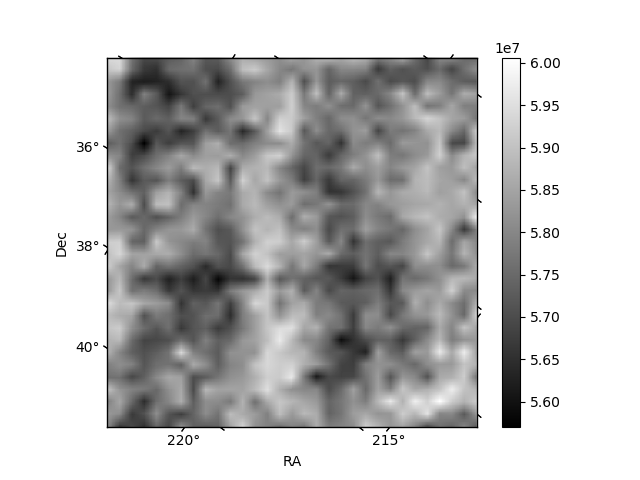
Histogram calculated using DETX and DETY for each event in the final _common_clean file
| Quadrant A | 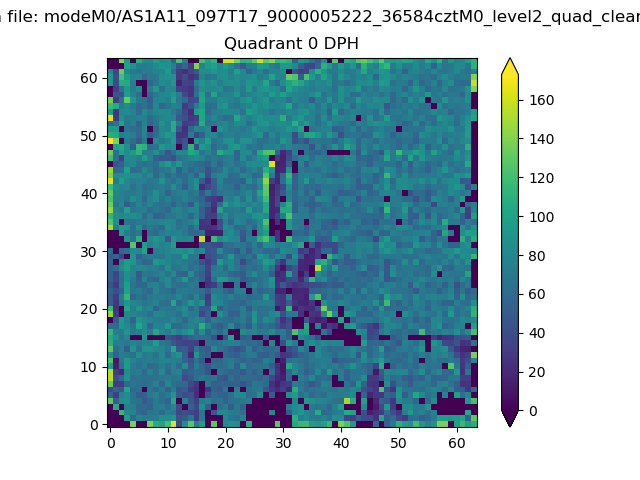 |
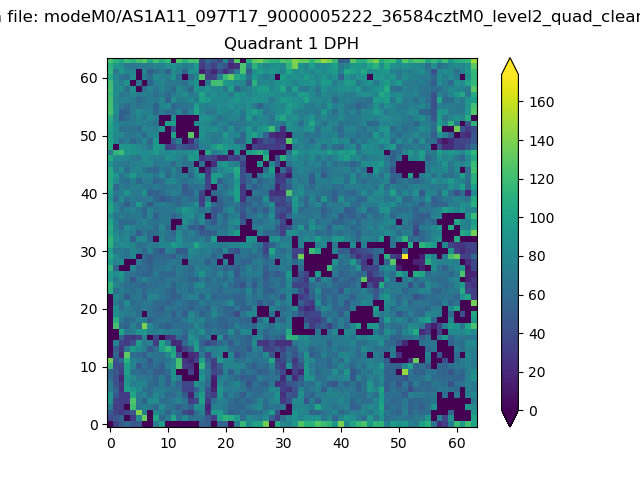 |
Quadrant B |
|---|---|---|---|
| Quadrant D | 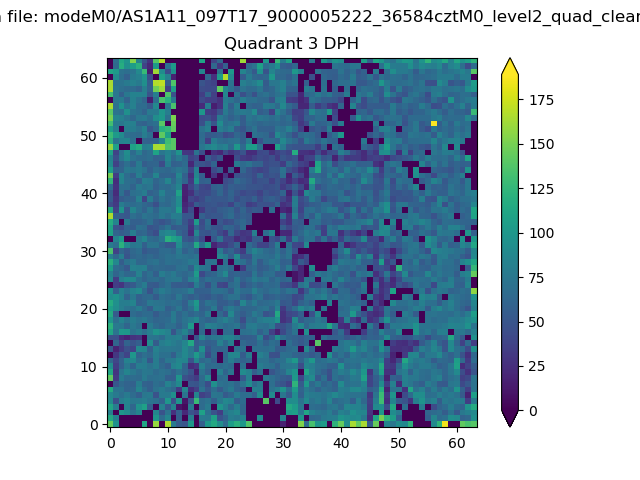 |
 |
Quadrant C |
| Plot type | Count rate plots | Images |
|---|---|---|
| Comparison with Poisson distribution Blue bars denote a histogram of data divided into 1 sec bins. Red curve is a Poisson curve with rate = median count rate of data. |
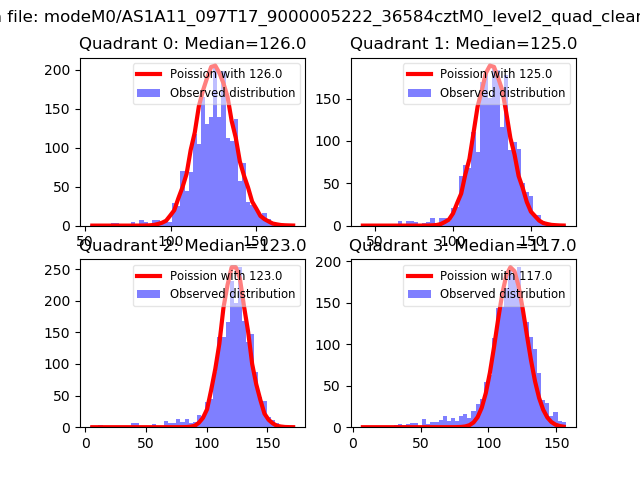 |
 |
| Quadrant-wise count rates Data is divided into 100 sec bins |
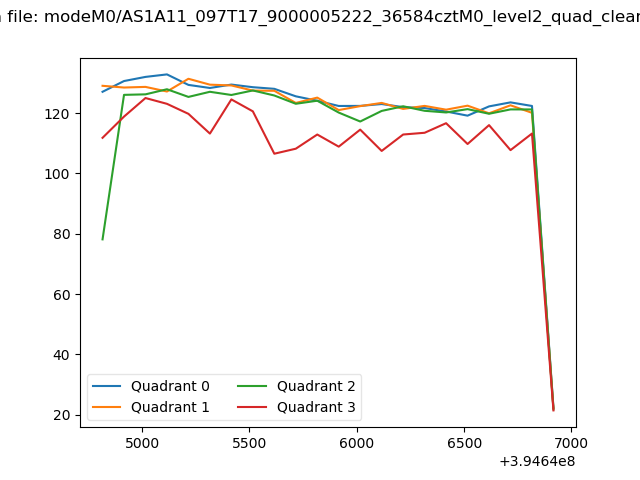 |
|
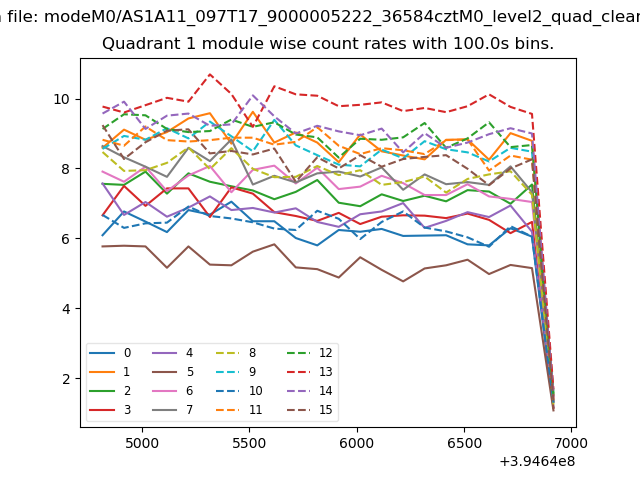
| Module-wise count rates for Quadrant A Data is divided into 100 sec bins |
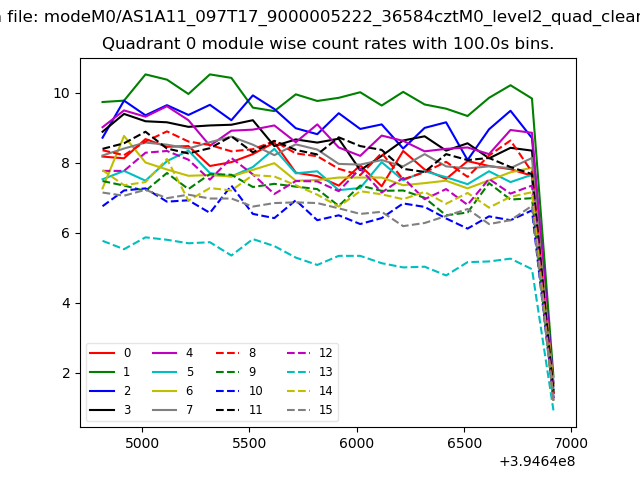 |
 |
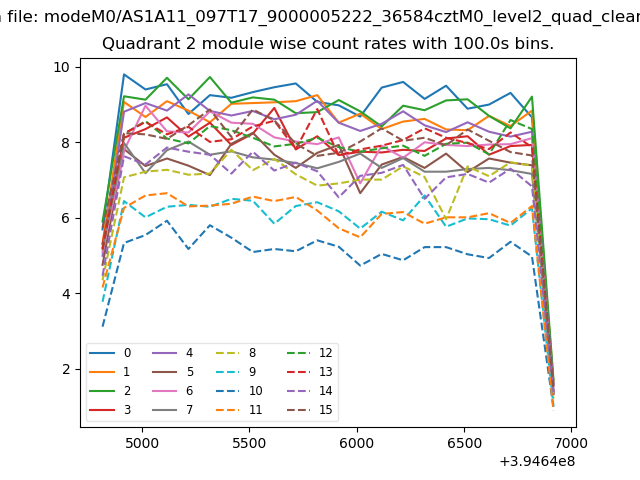
| Module-wise count rates for Quadrant B Data is divided into 100 sec bins |
 |
 |
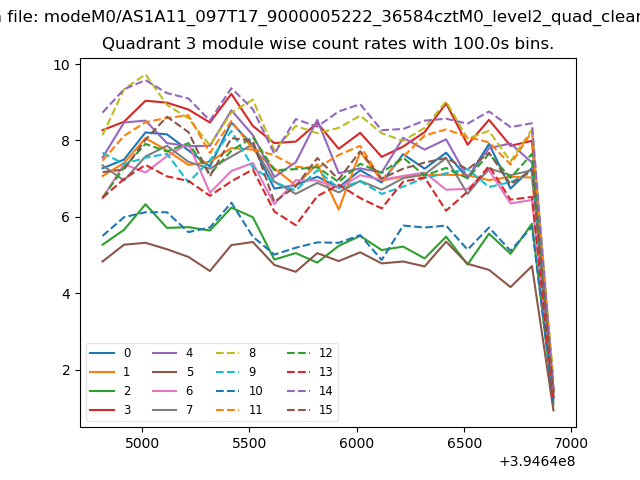
| Module-wise count rates for Quadrant C Data is divided into 100 sec bins |
 |
 |
| Module-wise count rates for Quadrant D Data is divided into 100 sec bins |
 |
 |
| Parameter | Plot |
|---|---|
| CZT HV Monitor | 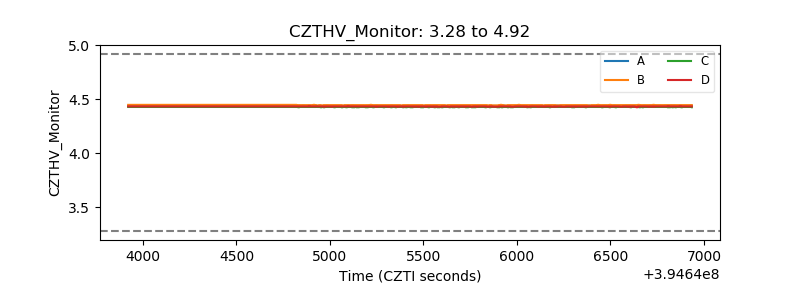 |
| D_VDD | 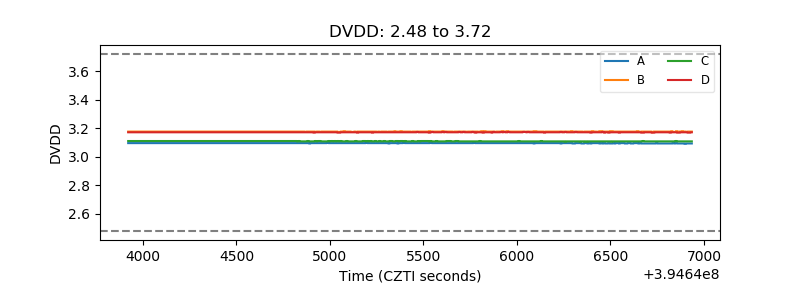 |
| Temperature 1 | 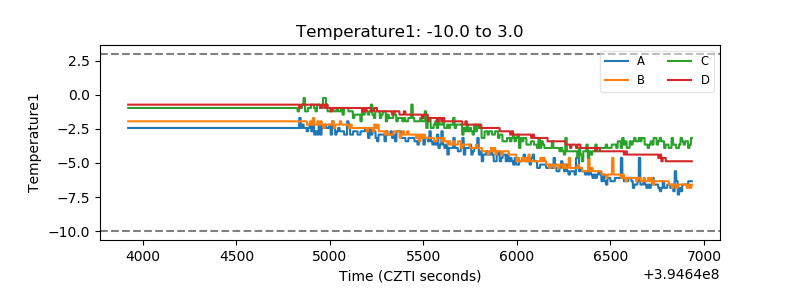 |
| Veto HV Monitor | 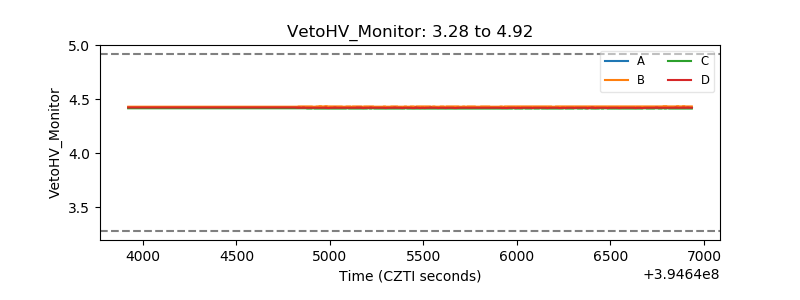 |
| Veto LLD | 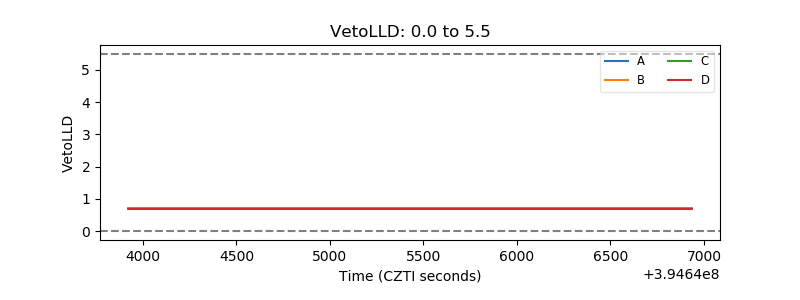 |
| Alpha Counter | 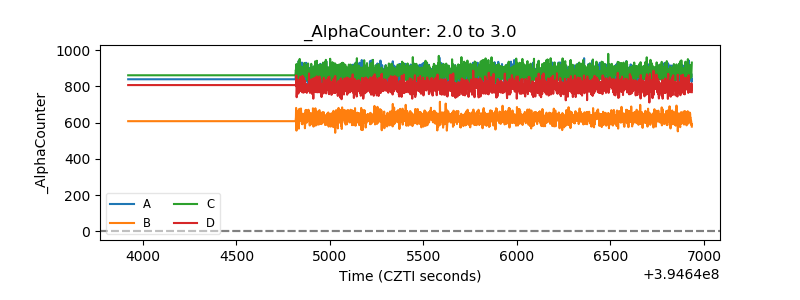 |
| _CPM_Rate | 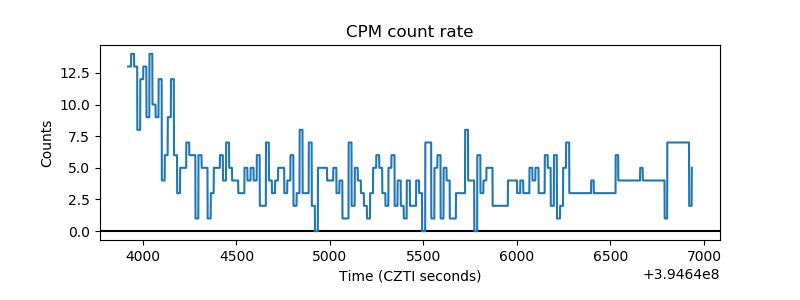 |
| CZT Counter | 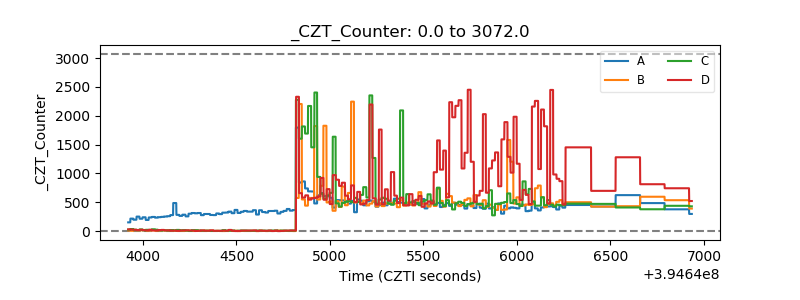 |
| +2.5 Volts monitor |  |
| +5 Volts monitor | 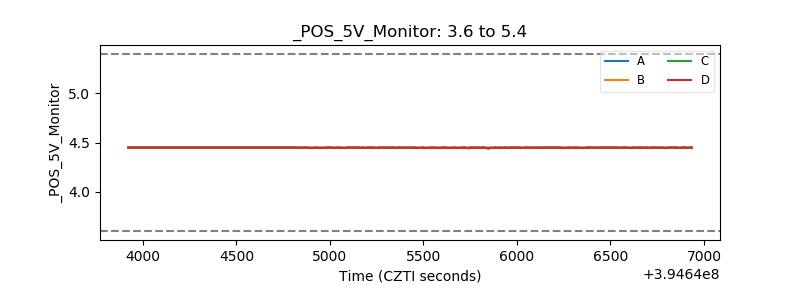 |
| _ROLL_ROT |  |
| _Roll_DEC | 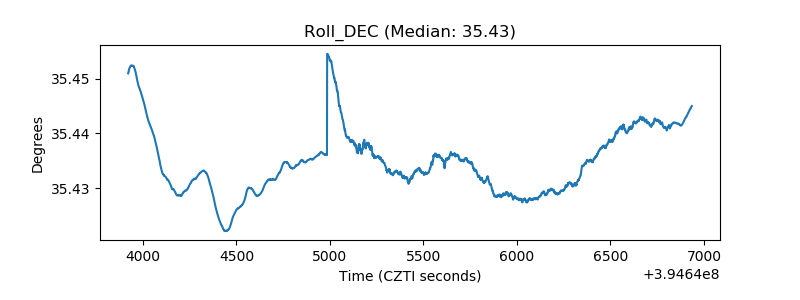 |
| _Roll_RA |  |
| Veto Counter |  |