| Param | Original file | Final file |
|---|---|---|
| Filename | modeM0/AS1A11_097T24_9000005224cztM0_level2.fits | modeM0/AS1A11_097T24_9000005224cztM0_level2_quad_clean.evt |
| Size (bytes) | 930,435,840 | 889,824,960 |
| Size | 887.3 MB | 848.6 MB |
| Events in quadrant A | 5,782,832 | 5,401,999 |
| Events in quadrant B | 5,475,942 | 5,382,065 |
| Events in quadrant C | 5,424,242 | 4,912,404 |
| Events in quadrant D | 4,771,652 | 4,529,338 |
| Mode M0 | |||
|---|---|---|---|
| Quadrant | BADHDUFLAG | Total packets | Discarded packets |
| A | 0 | 207557 | 0 |
| B | 0 | 208107 | 0 |
| C | 0 | 236909 | 0 |
| D | 0 | 273327 | 0 |
| Mode M9 | |||
|---|---|---|---|
| Quadrant | BADHDUFLAG | Total packets | Discarded packets |
| A | 0 | 347 | 0 |
| B | 0 | 347 | 0 |
| C | 0 | 347 | 0 |
| D | 0 | 347 | 0 |
| Mode SS | |||
|---|---|---|---|
| Quadrant | BADHDUFLAG | Total packets | Discarded packets |
| A | 0 | 2002 | 0 |
| B | 0 | 2002 | 0 |
| C | 0 | 2002 | 0 |
| D | 0 | 2002 | 0 |
| Quadrant | Total seconds | Saturated seconds | Saturation percentage |
|---|---|---|---|
| A | 98086 | 389 | 0.396591% |
| B | 98084 | 556 | 0.566861% |
| C | 98086 | 2704 | 2.756764% |
| D | 98085 | 3651 | 3.722282% |
Noise dominated data is calculated using 1-second bins in cleaned event files. If a bin has >2000 counts, and if more than 50% of those come from <1% of pixels, then it is considered to be noise-dominated and hence unusable.
| Quadrant | # 1 sec bins | Bins with >0 counts | Bins with >2000 counts | High rate bins dominated by noise | Noise dominated (total time) | Noise dominated (detector-on time) | Marked lightcurve |
|---|---|---|---|---|---|---|---|
| A | 132678 | 98086 | 0 | 0 | 0.00% | 0.00% |  |
| B | 132678 | 98072 | 0 | 0 | 0.00% | 0.00% |  |
| C | 132678 | 98037 | 0 | 0 | 0.00% | 0.00% |  |
| D | 132678 | 98064 | 0 | 0 | 0.00% | 0.00% |  |
Top three noisy pixels from each quadrant. If the there are fewer than three noisy pixels in the level2.evt file, extra rows are filled as -1
| Pixel properties | Quadrant properties | ||||||
|---|---|---|---|---|---|---|---|
| Quadrant | DetID | PixID | Counts | Sigma | Mean | Median | Sigma |
| A | 9 | 19 | 4738 | 8.96 | 1508 | 1415 | 370.9 |
| A | 7 | 110 | 4684 | 8.81 | 1508 | 1415 | 370.9 |
| A | 0 | 29 | 4525 | 8.39 | 1508 | 1415 | 370.9 |
| B | 2 | 9 | 4740 | 11.72 | 1450 | 1385 | 286.3 |
| B | 3 | 80 | 4240 | 9.97 | 1450 | 1385 | 286.3 |
| B | 2 | 8 | 3853 | 8.62 | 1450 | 1385 | 286.3 |
| C | 1 | 81 | 4463 | 8.49 | 1435 | 1345 | 367.3 |
| C | 1 | 80 | 4382 | 8.27 | 1435 | 1345 | 367.3 |
| C | 3 | 187 | 3671 | 6.33 | 1435 | 1345 | 367.3 |
| D | 7 | 3 | 3426 | 6.04 | 1364 | 1243 | 361.5 |
| D | 4 | 160 | 3421 | 6.02 | 1364 | 1243 | 361.5 |
| D | 10 | 113 | 3388 | 5.93 | 1364 | 1243 | 361.5 |
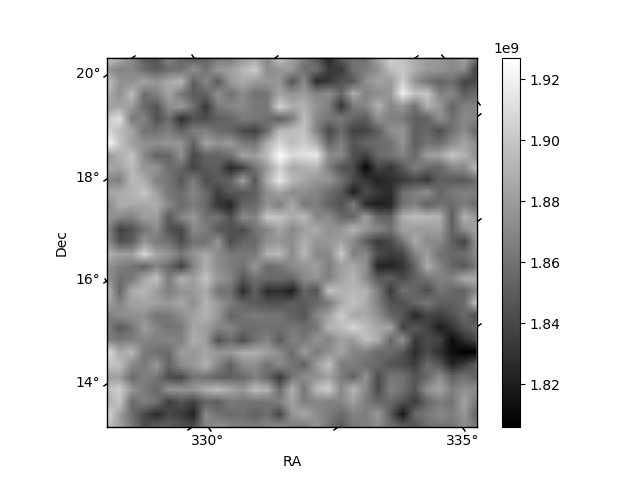
Histogram calculated using DETX and DETY for each event in the final _common_clean file
| Quadrant A | 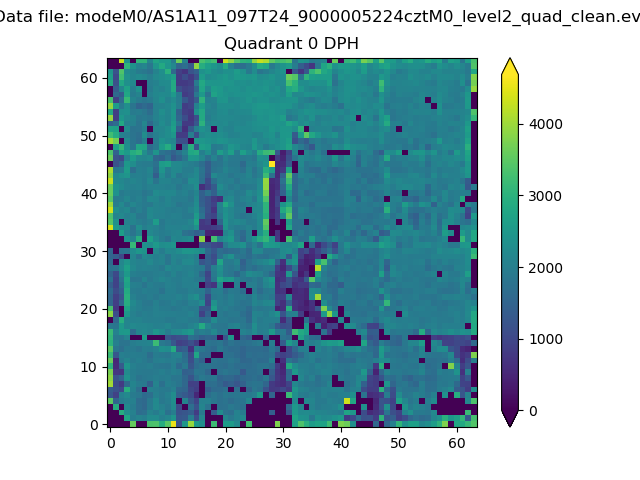 |
 |
Quadrant B |
|---|---|---|---|
| Quadrant D | 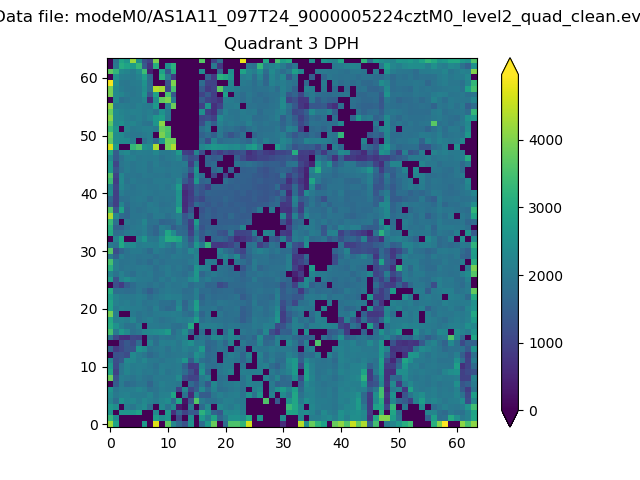 |
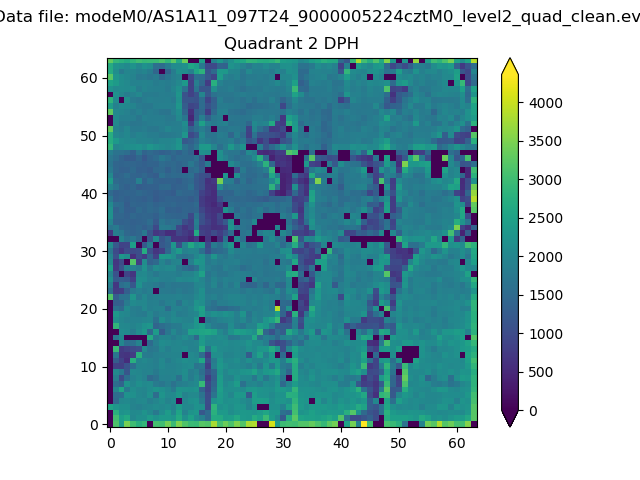 |
Quadrant C |
| Plot type | Count rate plots | Images |
|---|---|---|
| Comparison with Poisson distribution Blue bars denote a histogram of data divided into 1 sec bins. Red curve is a Poisson curve with rate = median count rate of data. |
 |
 |
| Quadrant-wise count rates Data is divided into 100 sec bins |
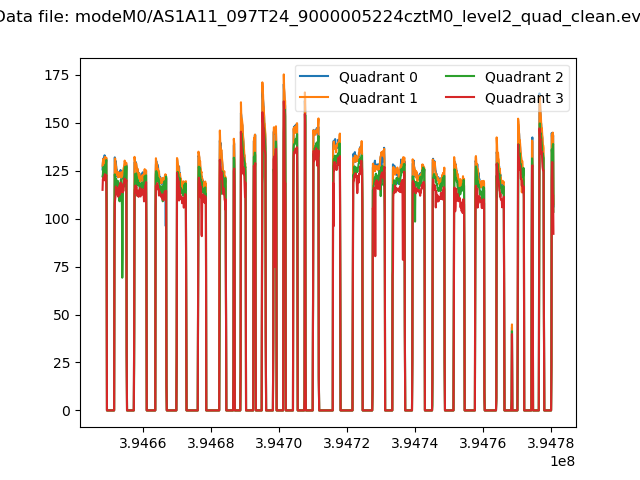 |
|
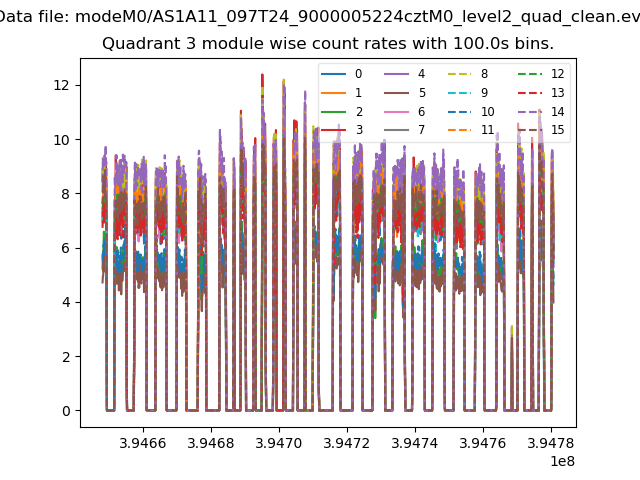
| Module-wise count rates for Quadrant A Data is divided into 100 sec bins |
 |
 |
| Module-wise count rates for Quadrant B Data is divided into 100 sec bins |
 |
 |
| Module-wise count rates for Quadrant C Data is divided into 100 sec bins |
 |
 |
| Module-wise count rates for Quadrant D Data is divided into 100 sec bins |
 |
 |
| Parameter | Plot |
|---|---|
| CZT HV Monitor |  |
| D_VDD |  |
| Temperature 1 |  |
| Veto HV Monitor |  |
| Veto LLD |  |
| Alpha Counter |  |
| _CPM_Rate |  |
| CZT Counter |  |
| +2.5 Volts monitor |  |
| +5 Volts monitor |  |
| _ROLL_ROT | 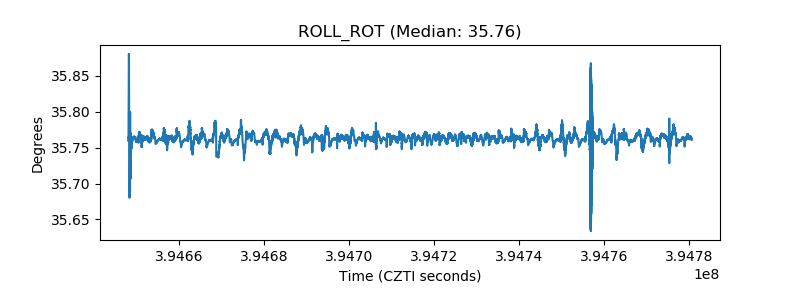 |
| _Roll_DEC |  |
| _Roll_RA | 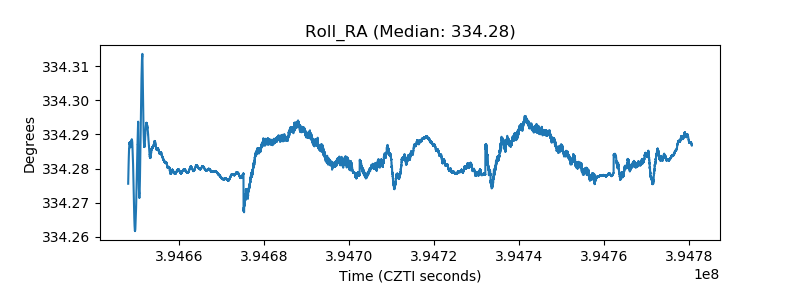 |
| Veto Counter |  |