| Param | Original file | Final file |
|---|---|---|
| Filename | modeM0/AS1A11_097T24_9000005224_36584cztM0_level2.evt | modeM0/AS1A11_097T24_9000005224_36584cztM0_level2_quad_clean.evt |
| Size (bytes) | 202,728,960 | 32,780,160 |
| Size | 193.3 MB | 31.3 MB |
| Events in quadrant A | 1,315,298 | 209,138 |
| Events in quadrant B | 1,298,202 | 210,461 |
| Events in quadrant C | 1,620,411 | 201,007 |
| Events in quadrant D | 1,735,231 | 193,230 |
| Mode M0 | |||
|---|---|---|---|
| Quadrant | BADHDUFLAG | Total packets | Discarded packets |
| A | 0 | 5364 | 2 |
| B | 0 | 5331 | 1 |
| C | 0 | 6262 | 1 |
| D | 0 | 6803 | 1 |
| Mode M9 | |||
|---|---|---|---|
| Quadrant | BADHDUFLAG | Total packets | Discarded packets |
| A | 0 | 14 | 0 |
| B | 0 | 14 | 0 |
| C | 0 | 14 | 0 |
| D | 0 | 14 | 0 |
| Mode SS | |||
|---|---|---|---|
| Quadrant | BADHDUFLAG | Total packets | Discarded packets |
| A | 0 | 52 | 0 |
| B | 0 | 52 | 0 |
| C | 0 | 52 | 0 |
| D | 0 | 52 | 0 |
| Quadrant | Total seconds | Saturated seconds | Saturation percentage |
|---|---|---|---|
| A | 2479 | 9 | 0.363050% |
| B | 2479 | 24 | 0.968132% |
| C | 2479 | 111 | 4.477612% |
| D | 2479 | 108 | 4.356595% |
Noise dominated data is calculated using 1-second bins in cleaned event files. If a bin has >2000 counts, and if more than 50% of those come from <1% of pixels, then it is considered to be noise-dominated and hence unusable.
| Quadrant | # 1 sec bins | Bins with >0 counts | Bins with >2000 counts | High rate bins dominated by noise | Noise dominated (total time) | Noise dominated (detector-on time) | Marked lightcurve |
|---|---|---|---|---|---|---|---|
| A | 3852 | 2480 | 4 | 4 | 0.10% | 0.16% | 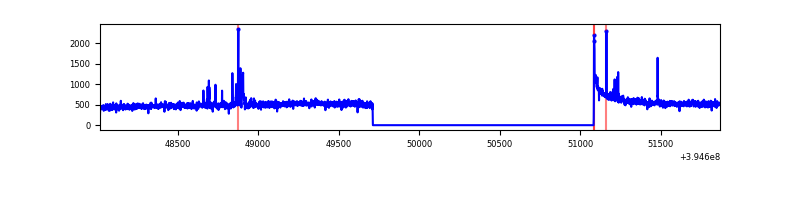 |
| B | 3852 | 2480 | 18 | 18 | 0.47% | 0.73% | 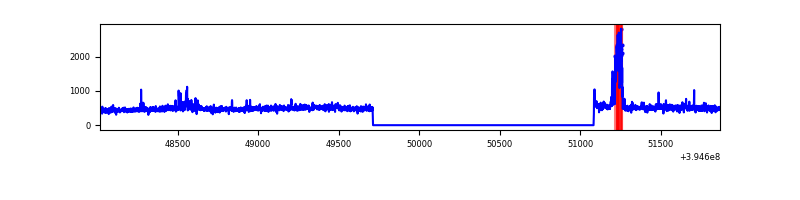 |
| C | 3852 | 2480 | 75 | 75 | 1.95% | 3.02% | 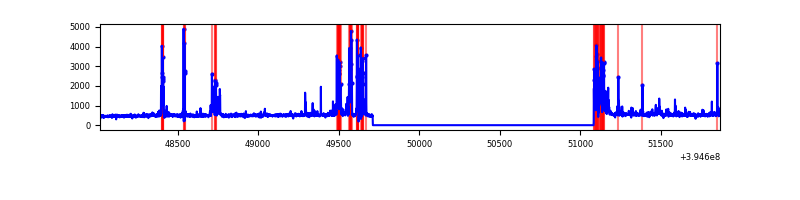 |
| D | 3852 | 2480 | 79 | 79 | 2.05% | 3.19% | 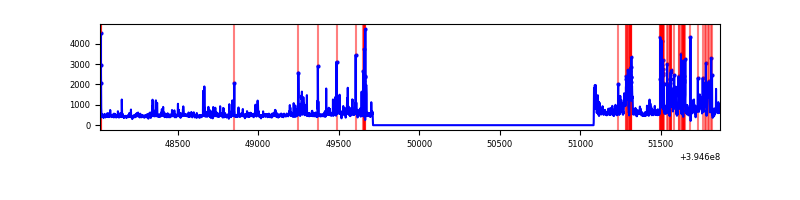 |
Top three noisy pixels from each quadrant. If the there are fewer than three noisy pixels in the level2.evt file, extra rows are filled as -1
| Pixel properties | Quadrant properties | ||||||
|---|---|---|---|---|---|---|---|
| Quadrant | DetID | PixID | Counts | Sigma | Mean | Median | Sigma |
| A | 10 | 83 | 96541 | 1536.12 | 303 | 297 | 62.7 |
| A | 9 | 143 | 25234 | 398.01 | 303 | 297 | 62.7 |
| A | 15 | 223 | 19327 | 303.73 | 303 | 297 | 62.7 |
| B | 4 | 171 | 77366 | 1309.42 | 297 | 289 | 58.9 |
| B | 5 | 255 | 20553 | 344.25 | 297 | 289 | 58.9 |
| B | 12 | 111 | 7300 | 119.11 | 297 | 289 | 58.9 |
| C | 14 | 254 | 248112 | 3661.17 | 283 | 285 | 67.7 |
| C | 0 | 10 | 127374 | 1877.5 | 283 | 285 | 67.7 |
| C | 15 | 214 | 105662 | 1556.75 | 283 | 285 | 67.7 |
| D | 2 | 250 | 224801 | 3171.21 | 285 | 278 | 70.8 |
| D | 12 | 128 | 73812 | 1038.61 | 285 | 278 | 70.8 |
| D | 2 | 137 | 72789 | 1024.16 | 285 | 278 | 70.8 |
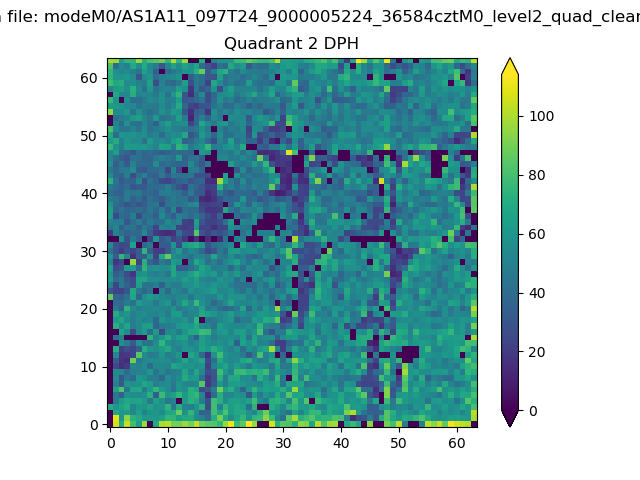
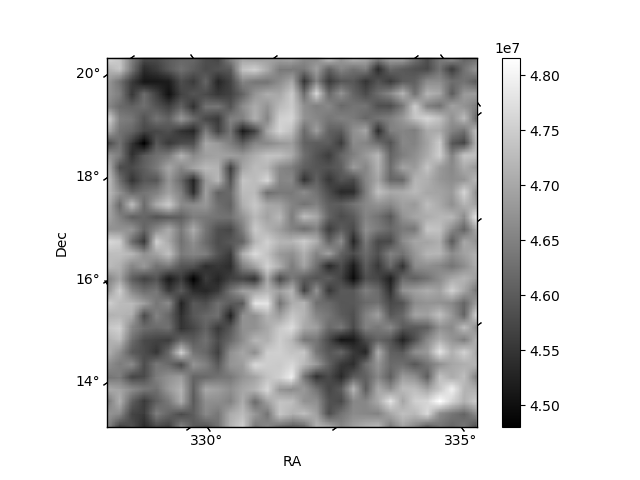
Histogram calculated using DETX and DETY for each event in the final _common_clean file
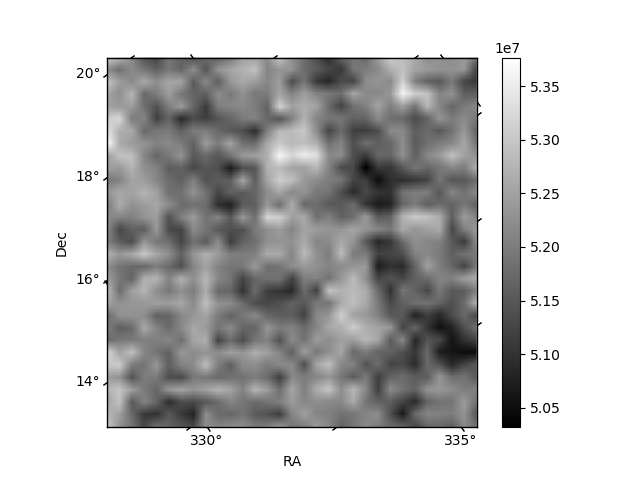
| Quadrant A | 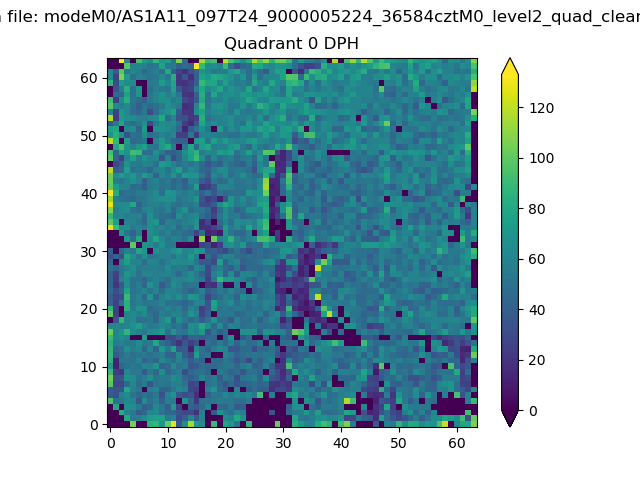 |
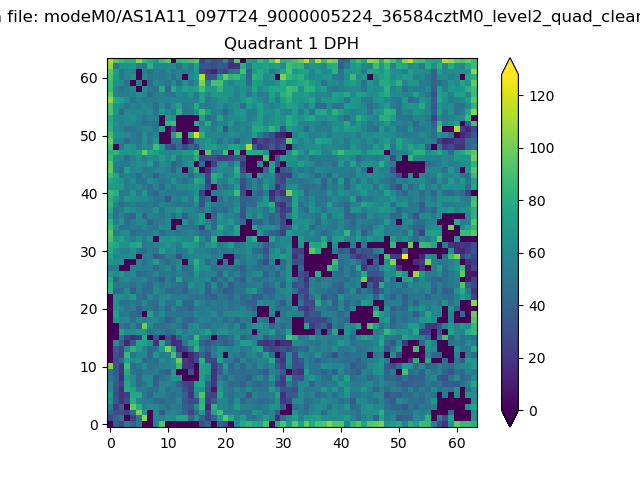 |
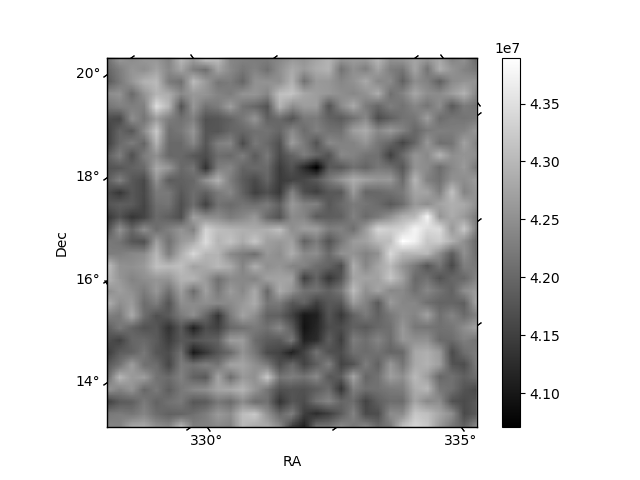
Quadrant B |
|---|---|---|---|
| Quadrant D | 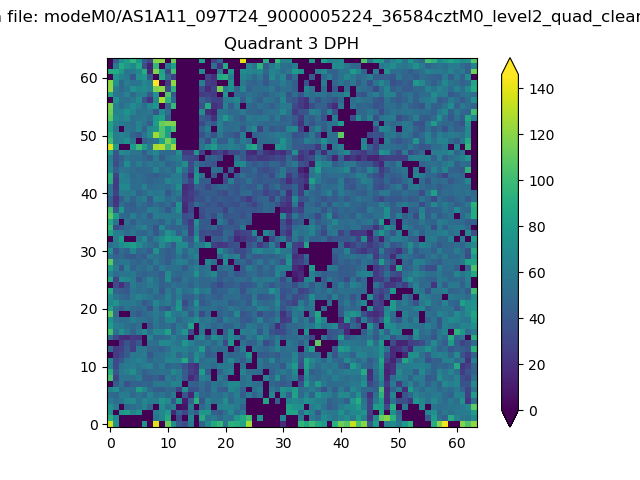 |
 |
Quadrant C |
| Plot type | Count rate plots | Images |
|---|---|---|
| Comparison with Poisson distribution Blue bars denote a histogram of data divided into 1 sec bins. Red curve is a Poisson curve with rate = median count rate of data. |
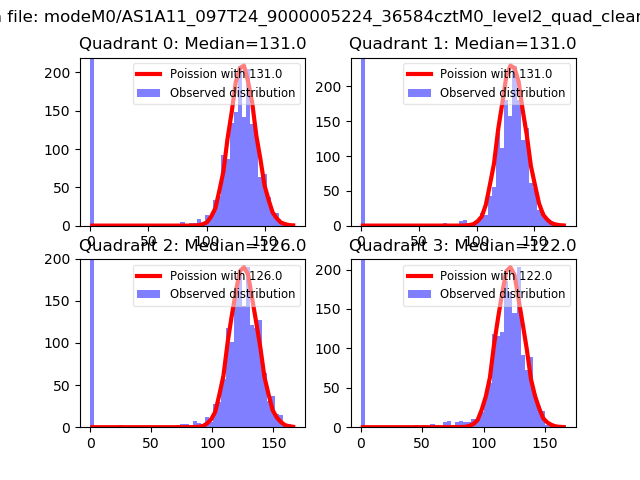 |
 |
| Quadrant-wise count rates Data is divided into 100 sec bins |
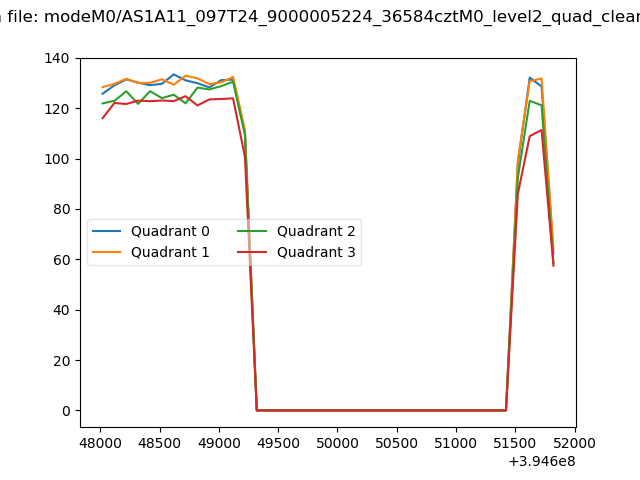 |
|
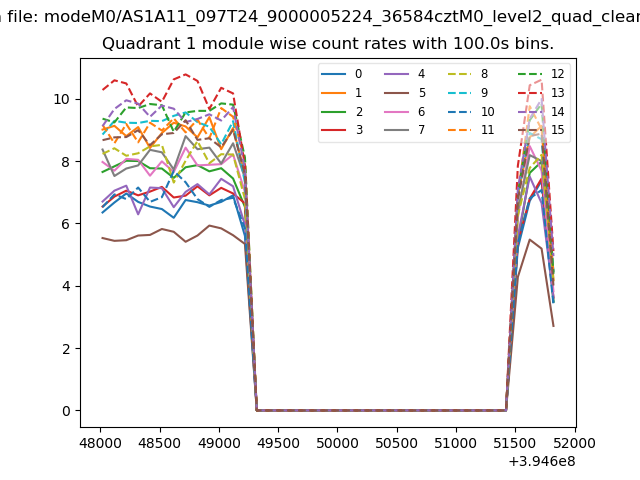
| Module-wise count rates for Quadrant A Data is divided into 100 sec bins |
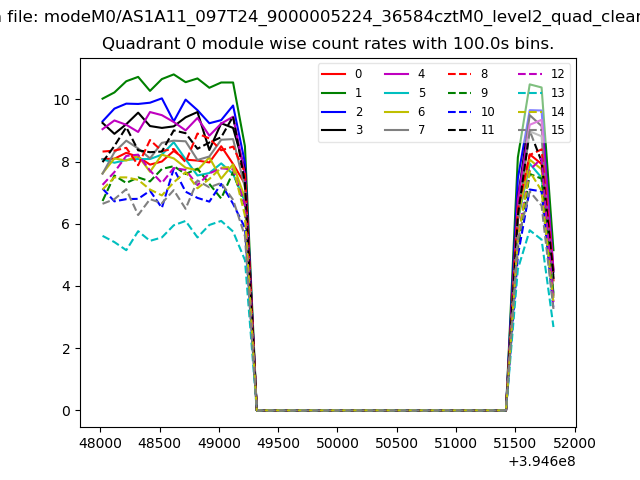 |
 |
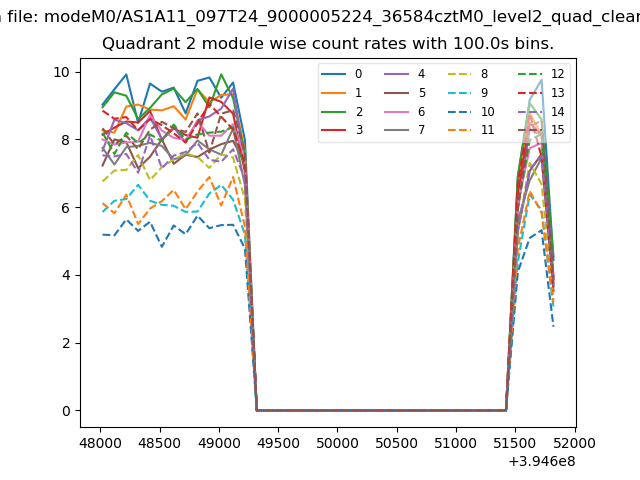
| Module-wise count rates for Quadrant B Data is divided into 100 sec bins |
 |
 |
| Module-wise count rates for Quadrant C Data is divided into 100 sec bins |
 |
 |
| Module-wise count rates for Quadrant D Data is divided into 100 sec bins |
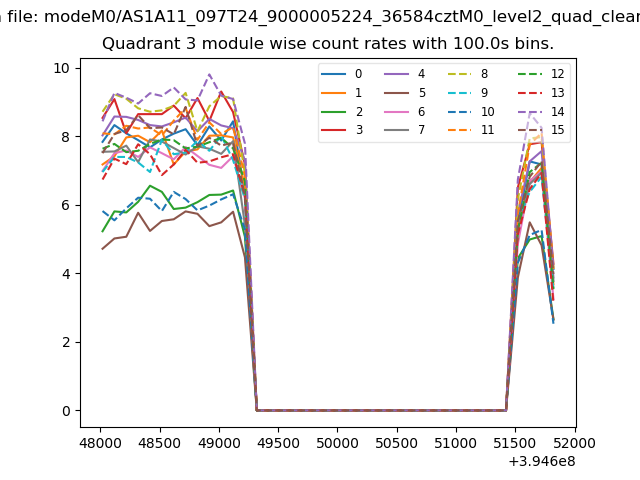 |
 |
| Parameter | Plot |
|---|---|
| CZT HV Monitor | 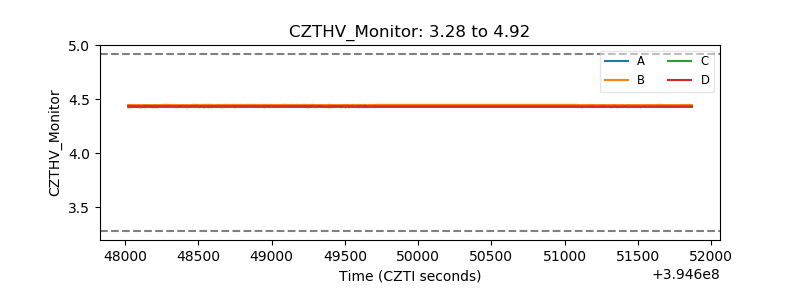 |
| D_VDD | 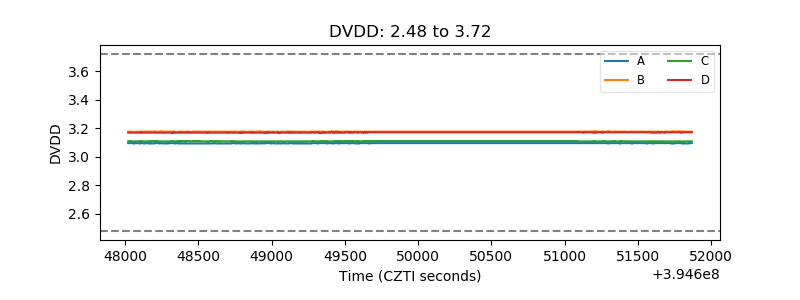 |
| Temperature 1 | 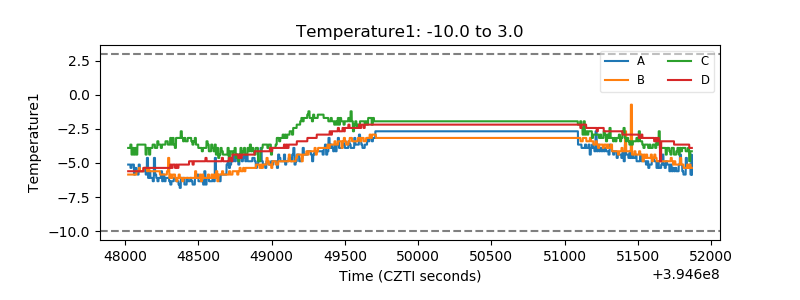 |
| Veto HV Monitor | 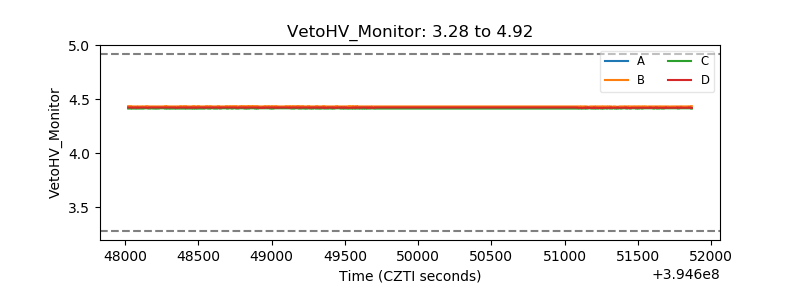 |
| Veto LLD | 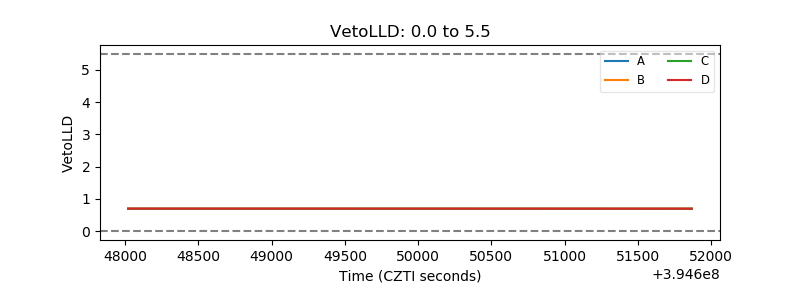 |
| Alpha Counter | 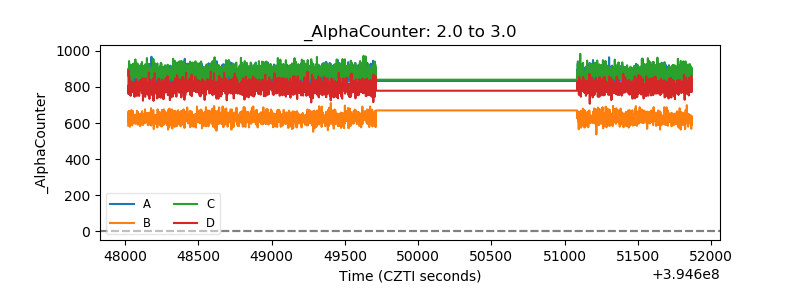 |
| _CPM_Rate |  |
| CZT Counter |  |
| +2.5 Volts monitor |  |
| +5 Volts monitor |  |
| _ROLL_ROT | 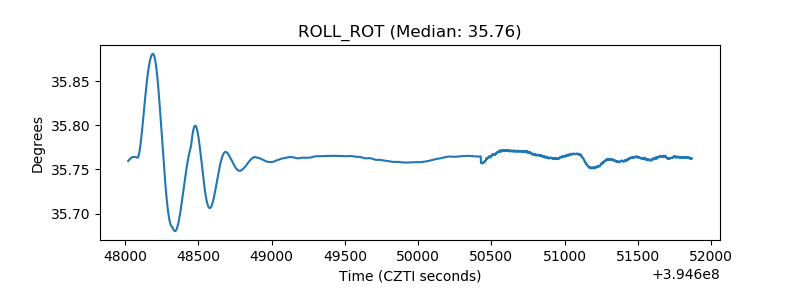 |
| _Roll_DEC | 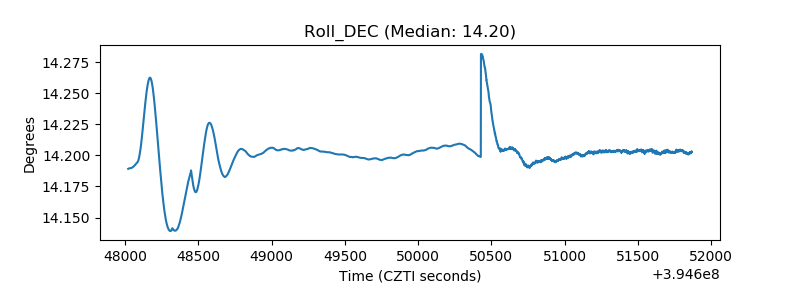 |
| _Roll_RA | 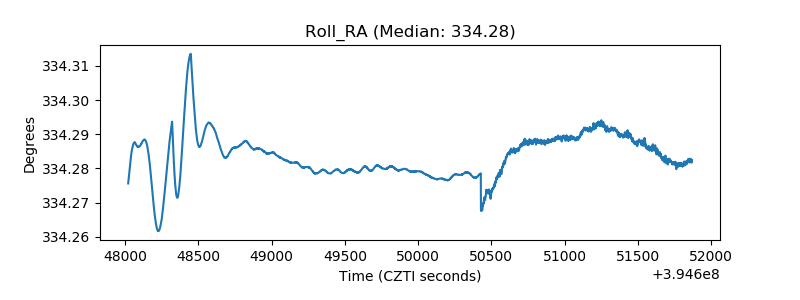 |
| Veto Counter | 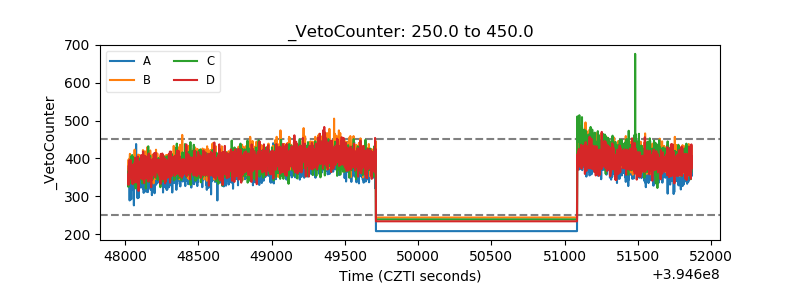 |