| Param | Original file | Final file |
|---|---|---|
| Filename | modeM0/AS1A11_097T24_9000005224_36588cztM0_level2.evt | modeM0/AS1A11_097T24_9000005224_36588cztM0_level2_quad_clean.evt |
| Size (bytes) | 1,138,314,240 | 201,473,280 |
| Size | 1.1 GB | 192.1 MB |
| Events in quadrant A | 7,967,084 | 1,287,990 |
| Events in quadrant B | 7,531,373 | 1,300,741 |
| Events in quadrant C | 8,519,291 | 1,241,833 |
| Events in quadrant D | 9,410,827 | 1,204,081 |
| Mode M0 | |||
|---|---|---|---|
| Quadrant | BADHDUFLAG | Total packets | Discarded packets |
| A | 0 | 33797 | 5 |
| B | 0 | 32675 | 4 |
| C | 0 | 34864 | 4 |
| D | 0 | 38827 | 4 |
| Mode M9 | |||
|---|---|---|---|
| Quadrant | BADHDUFLAG | Total packets | Discarded packets |
| A | 0 | 51 | 0 |
| B | 0 | 51 | 0 |
| C | 0 | 51 | 0 |
| D | 0 | 52 | 0 |
| Mode SS | |||
|---|---|---|---|
| Quadrant | BADHDUFLAG | Total packets | Discarded packets |
| A | 0 | 314 | 0 |
| B | 0 | 314 | 0 |
| C | 0 | 314 | 0 |
| D | 0 | 314 | 0 |
| Quadrant | Total seconds | Saturated seconds | Saturation percentage |
|---|---|---|---|
| A | 15476 | 170 | 1.098475% |
| B | 15476 | 74 | 0.478160% |
| C | 15476 | 254 | 1.641251% |
| D | 15476 | 304 | 1.964332% |
Noise dominated data is calculated using 1-second bins in cleaned event files. If a bin has >2000 counts, and if more than 50% of those come from <1% of pixels, then it is considered to be noise-dominated and hence unusable.
| Quadrant | # 1 sec bins | Bins with >0 counts | Bins with >2000 counts | High rate bins dominated by noise | Noise dominated (total time) | Noise dominated (detector-on time) | Marked lightcurve |
|---|---|---|---|---|---|---|---|
| A | 19745 | 15479 | 89 | 89 | 0.45% | 0.57% | 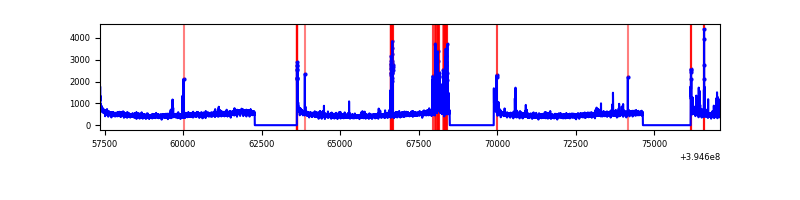 |
| B | 19745 | 15479 | 21 | 21 | 0.11% | 0.14% | 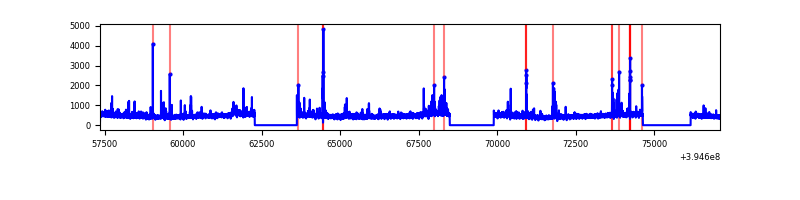 |
| C | 19745 | 15479 | 176 | 176 | 0.89% | 1.14% | 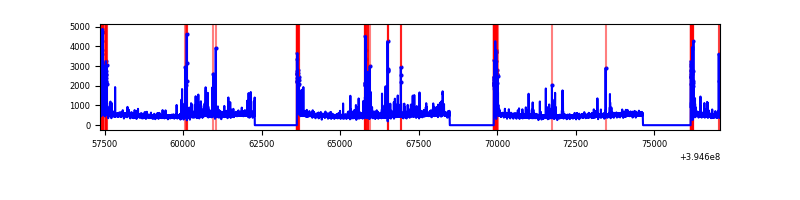 |
| D | 19745 | 15479 | 237 | 237 | 1.20% | 1.53% | 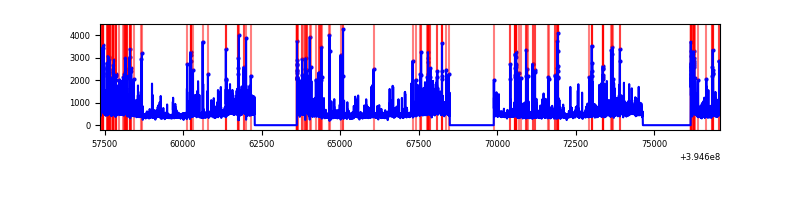 |
Top three noisy pixels from each quadrant. If the there are fewer than three noisy pixels in the level2.evt file, extra rows are filled as -1
| Pixel properties | Quadrant properties | ||||||
|---|---|---|---|---|---|---|---|
| Quadrant | DetID | PixID | Counts | Sigma | Mean | Median | Sigma |
| A | 15 | 223 | 554273 | 1558.99 | 1776 | 1743 | 354.4 |
| A | 10 | 83 | 484356 | 1361.72 | 1776 | 1743 | 354.4 |
| A | 9 | 143 | 44773 | 121.41 | 1776 | 1743 | 354.4 |
| B | 0 | 213 | 106229 | 309.24 | 1767 | 1718 | 338.0 |
| B | 5 | 255 | 103444 | 301.0 | 1767 | 1718 | 338.0 |
| B | 15 | 85 | 81960 | 237.43 | 1767 | 1718 | 338.0 |
| C | 0 | 10 | 816008 | 2054.26 | 1711 | 1725 | 396.4 |
| C | 15 | 214 | 655581 | 1649.54 | 1711 | 1725 | 396.4 |
| C | 14 | 254 | 349394 | 877.09 | 1711 | 1725 | 396.4 |
| D | 12 | 235 | 493861 | 1178.2 | 1713 | 1668 | 417.7 |
| D | 12 | 16 | 412769 | 984.08 | 1713 | 1668 | 417.7 |
| D | 2 | 250 | 344777 | 821.33 | 1713 | 1668 | 417.7 |
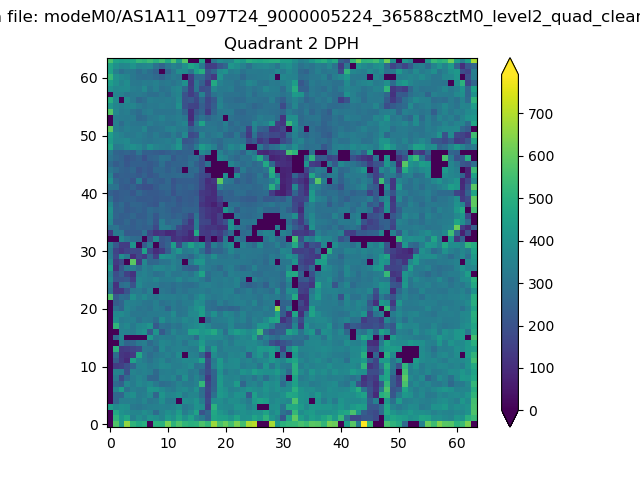
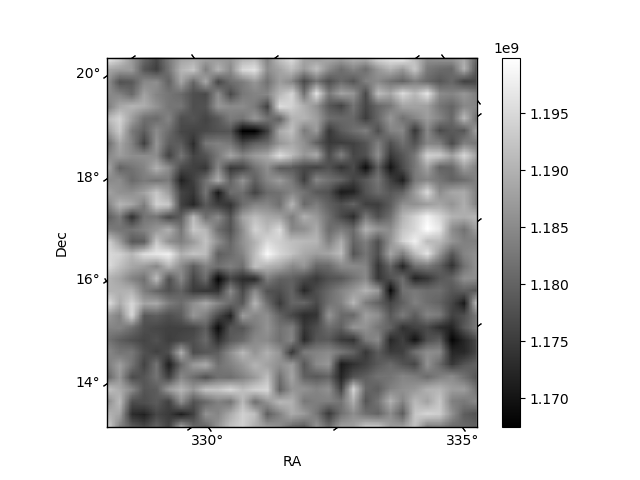
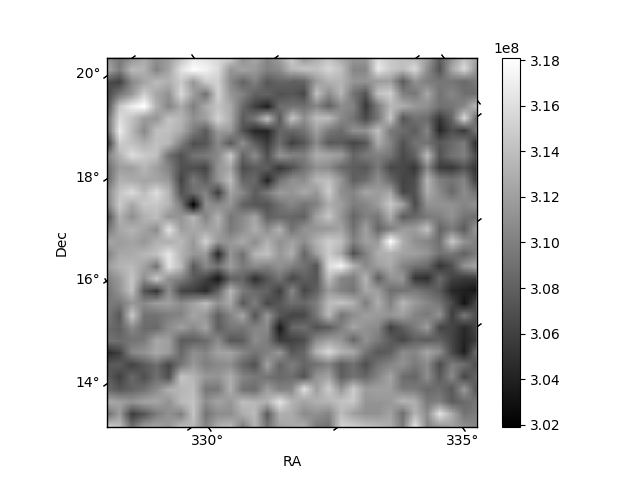
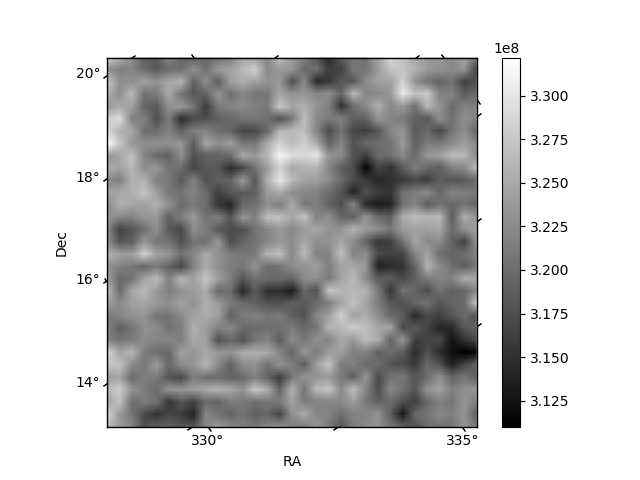
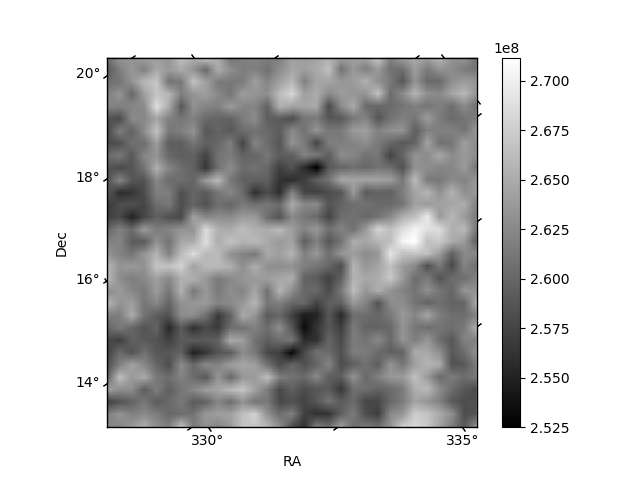
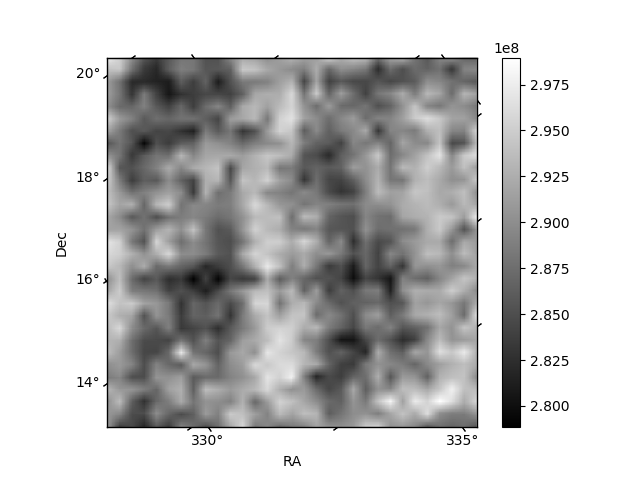
Histogram calculated using DETX and DETY for each event in the final _common_clean file
| Quadrant A | 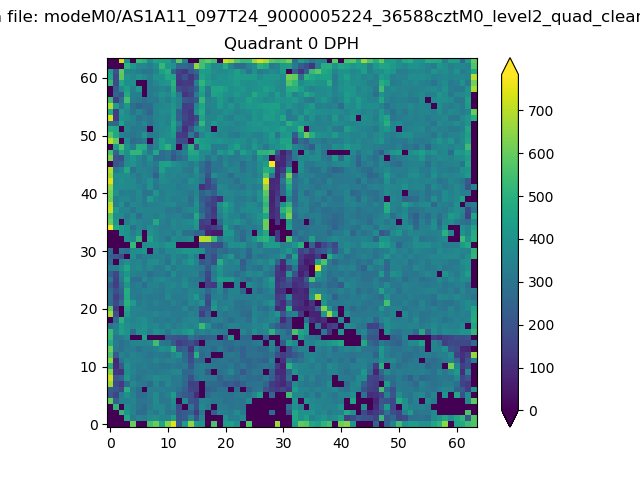 |
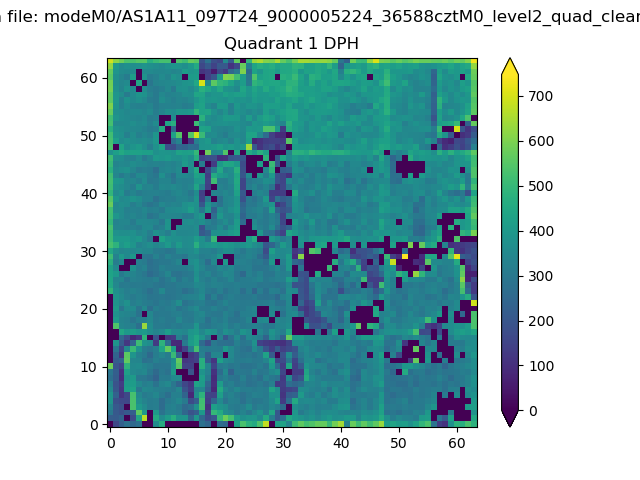 |
Quadrant B |
|---|---|---|---|
| Quadrant D | 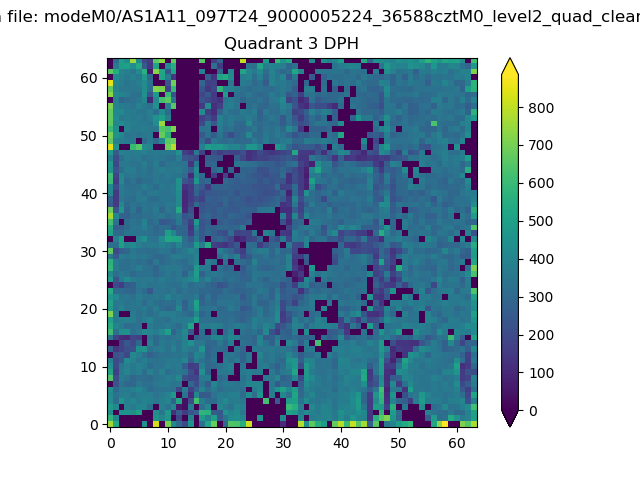 |
 |
Quadrant C |
| Plot type | Count rate plots | Images |
|---|---|---|
| Comparison with Poisson distribution Blue bars denote a histogram of data divided into 1 sec bins. Red curve is a Poisson curve with rate = median count rate of data. |
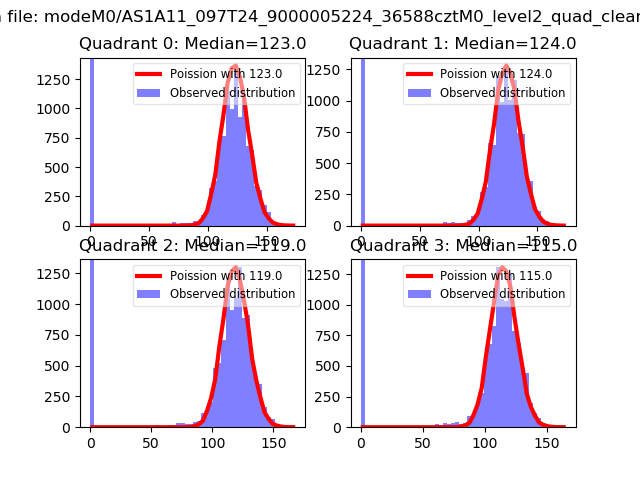 |
 |
| Quadrant-wise count rates Data is divided into 100 sec bins |
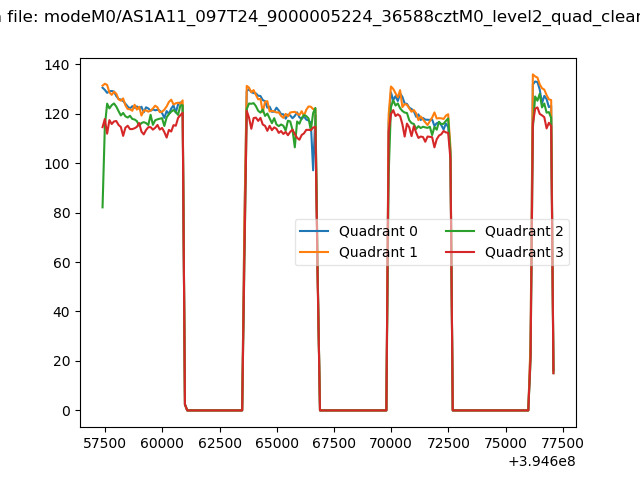 |
|
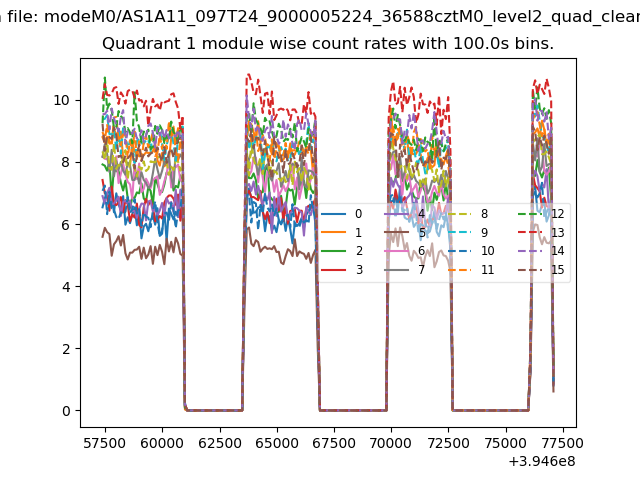
| Module-wise count rates for Quadrant A Data is divided into 100 sec bins |
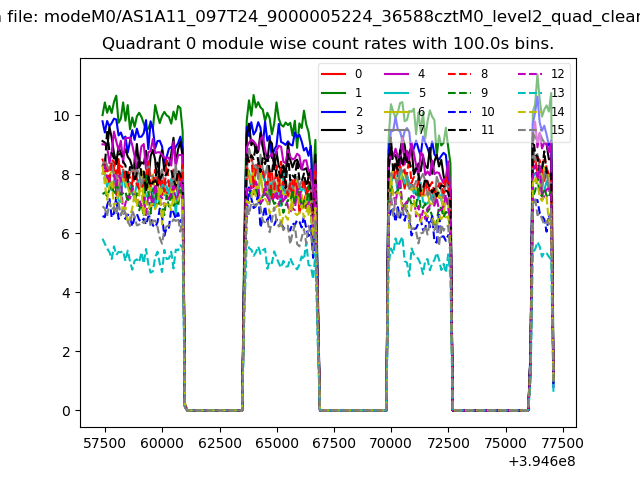 |
 |
| Module-wise count rates for Quadrant B Data is divided into 100 sec bins |
 |
 |
| Module-wise count rates for Quadrant C Data is divided into 100 sec bins |
 |
 |
| Module-wise count rates for Quadrant D Data is divided into 100 sec bins |
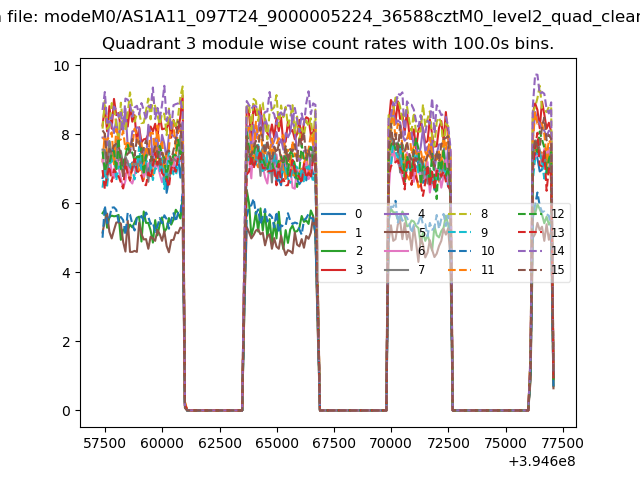 |
 |
| Parameter | Plot |
|---|---|
| CZT HV Monitor | 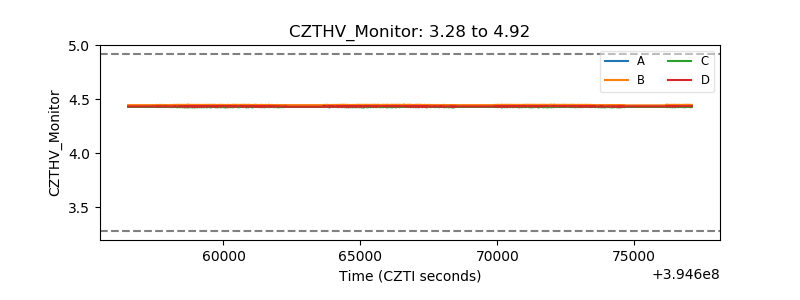 |
| D_VDD | 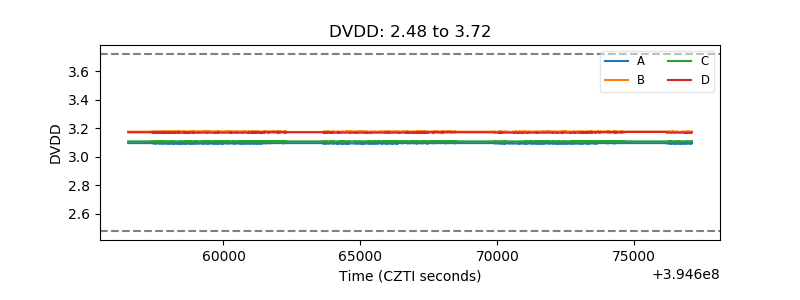 |
| Temperature 1 | 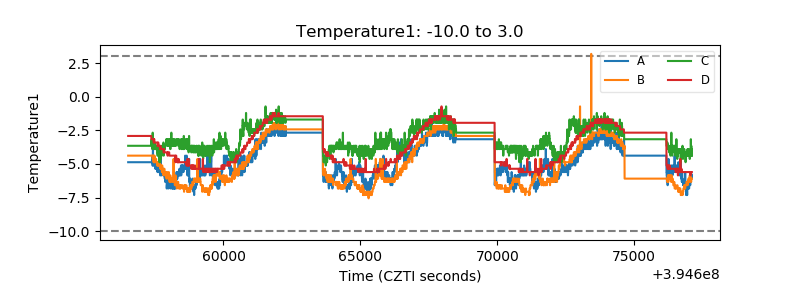 |
| Veto HV Monitor | 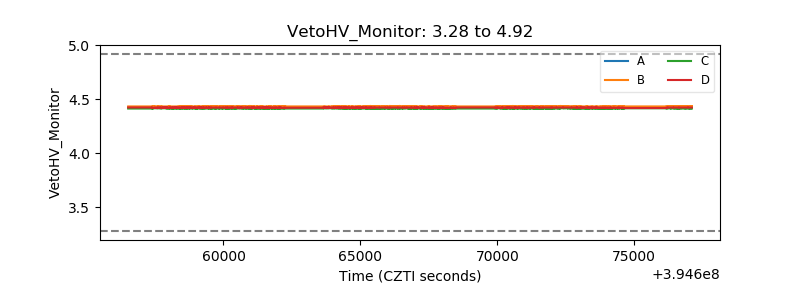 |
| Veto LLD | 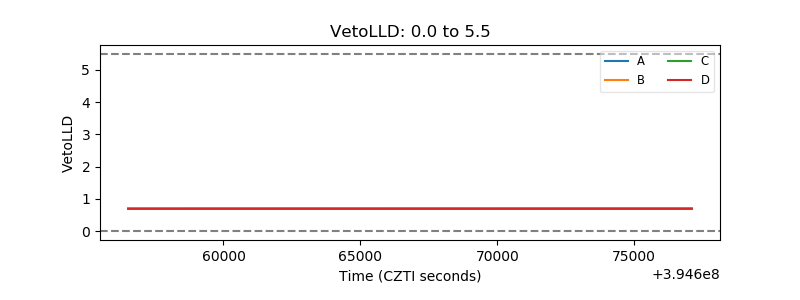 |
| Alpha Counter |  |
| _CPM_Rate | 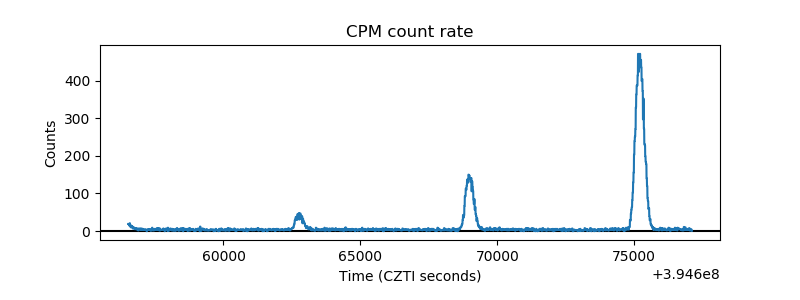 |
| CZT Counter | 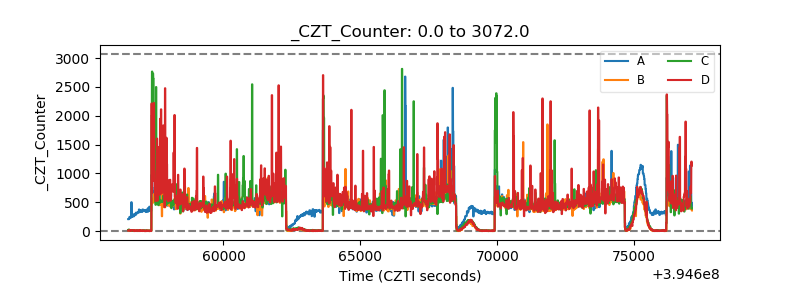 |
| +2.5 Volts monitor | 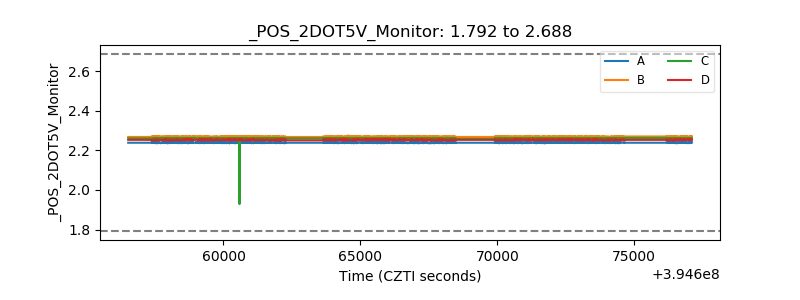 |
| +5 Volts monitor |  |
| _ROLL_ROT | 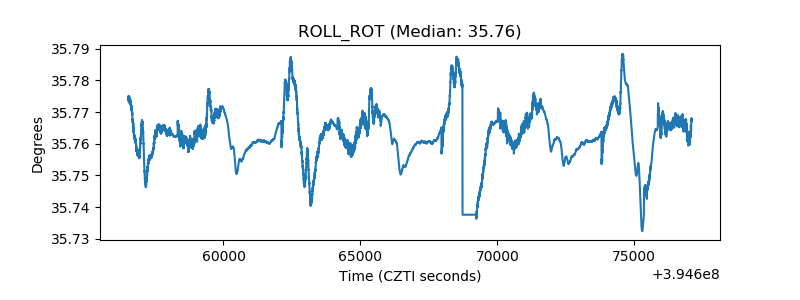 |
| _Roll_DEC | 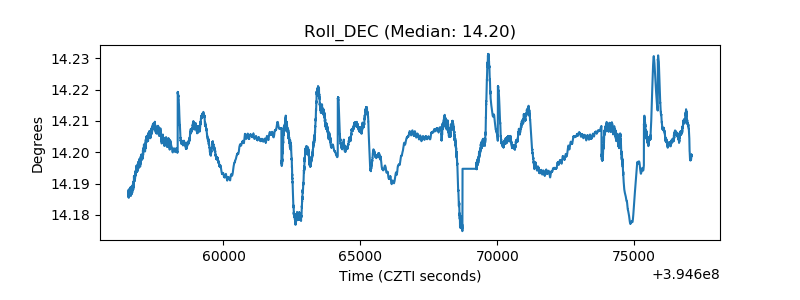 |
| _Roll_RA |  |
| Veto Counter | 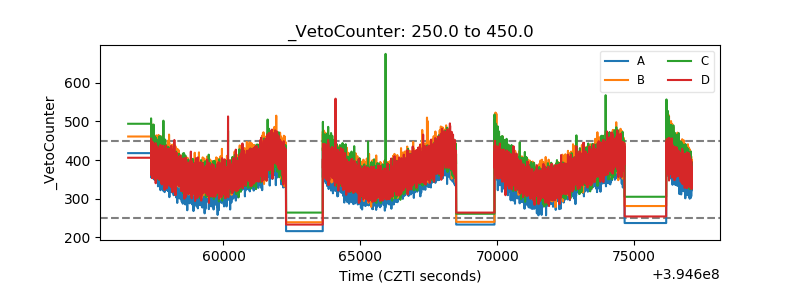 |