| Param | Original file | Final file |
|---|---|---|
| Filename | modeM0/AS1A11_097T24_9000005224_36589cztM0_level2.evt | modeM0/AS1A11_097T24_9000005224_36589cztM0_level2_quad_clean.evt |
| Size (bytes) | 437,598,720 | 65,462,400 |
| Size | 417.3 MB | 62.4 MB |
| Events in quadrant A | 2,864,873 | 413,157 |
| Events in quadrant B | 2,613,059 | 420,274 |
| Events in quadrant C | 3,700,722 | 379,061 |
| Events in quadrant D | 3,697,489 | 381,875 |
| Mode M0 | |||
|---|---|---|---|
| Quadrant | BADHDUFLAG | Total packets | Discarded packets |
| A | 0 | 12061 | 3 |
| B | 0 | 11379 | 2 |
| C | 0 | 14426 | 2 |
| D | 0 | 14882 | 2 |
| Mode M9 | |||
|---|---|---|---|
| Quadrant | BADHDUFLAG | Total packets | Discarded packets |
| A | 0 | 27 | 0 |
| B | 0 | 27 | 0 |
| C | 0 | 27 | 0 |
| D | 0 | 28 | 0 |
| Mode SS | |||
|---|---|---|---|
| Quadrant | BADHDUFLAG | Total packets | Discarded packets |
| A | 0 | 112 | 0 |
| B | 0 | 112 | 0 |
| C | 0 | 112 | 0 |
| D | 0 | 112 | 0 |
| Quadrant | Total seconds | Saturated seconds | Saturation percentage |
|---|---|---|---|
| A | 5542 | 29 | 0.523277% |
| B | 5542 | 8 | 0.144352% |
| C | 5542 | 310 | 5.593649% |
| D | 5542 | 200 | 3.608805% |
Noise dominated data is calculated using 1-second bins in cleaned event files. If a bin has >2000 counts, and if more than 50% of those come from <1% of pixels, then it is considered to be noise-dominated and hence unusable.
| Quadrant | # 1 sec bins | Bins with >0 counts | Bins with >2000 counts | High rate bins dominated by noise | Noise dominated (total time) | Noise dominated (detector-on time) | Marked lightcurve |
|---|---|---|---|---|---|---|---|
| A | 7216 | 5543 | 11 | 11 | 0.15% | 0.20% | 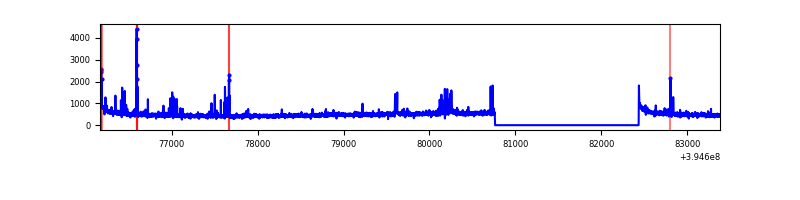 |
| B | 7216 | 5543 | 0 | 0 | 0.00% | 0.00% | 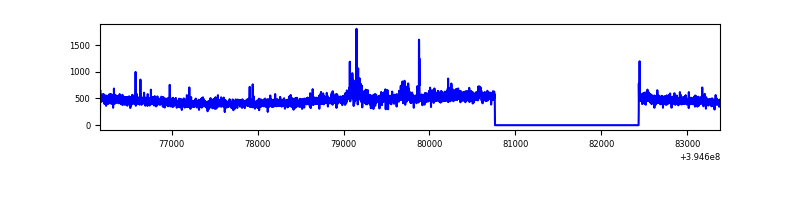 |
| C | 7216 | 5543 | 267 | 267 | 3.70% | 4.82% | 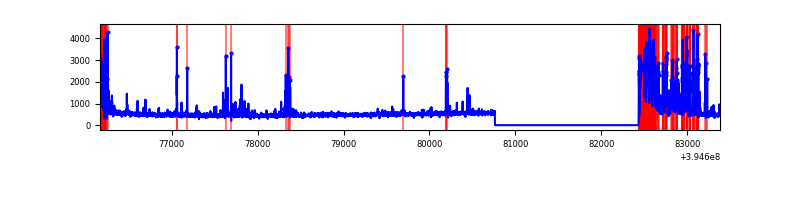 |
| D | 7216 | 5543 | 160 | 160 | 2.22% | 2.89% | 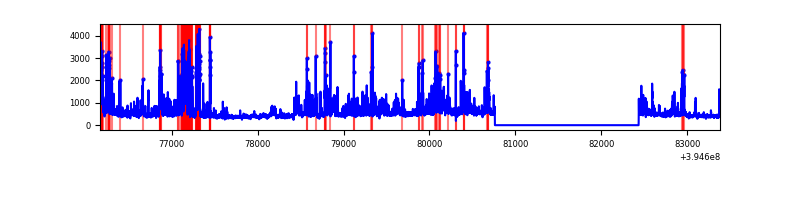 |
Top three noisy pixels from each quadrant. If the there are fewer than three noisy pixels in the level2.evt file, extra rows are filled as -1
| Pixel properties | Quadrant properties | ||||||
|---|---|---|---|---|---|---|---|
| Quadrant | DetID | PixID | Counts | Sigma | Mean | Median | Sigma |
| A | 10 | 83 | 206008 | 1606.6 | 637 | 625 | 127.8 |
| A | 15 | 223 | 143136 | 1114.79 | 637 | 625 | 127.8 |
| A | 9 | 143 | 30698 | 235.24 | 637 | 625 | 127.8 |
| B | 0 | 213 | 48077 | 385.96 | 632 | 615 | 123.0 |
| B | 4 | 232 | 29886 | 238.03 | 632 | 615 | 123.0 |
| B | 12 | 111 | 15375 | 120.03 | 632 | 615 | 123.0 |
| C | 14 | 254 | 786026 | 5648.71 | 597 | 602 | 139.0 |
| C | 0 | 10 | 314192 | 2255.32 | 597 | 602 | 139.0 |
| C | 15 | 214 | 233863 | 1677.6 | 597 | 602 | 139.0 |
| D | 12 | 16 | 387254 | 2598.03 | 605 | 588 | 148.8 |
| D | 2 | 250 | 198024 | 1326.58 | 605 | 588 | 148.8 |
| D | 12 | 227 | 187111 | 1253.26 | 605 | 588 | 148.8 |
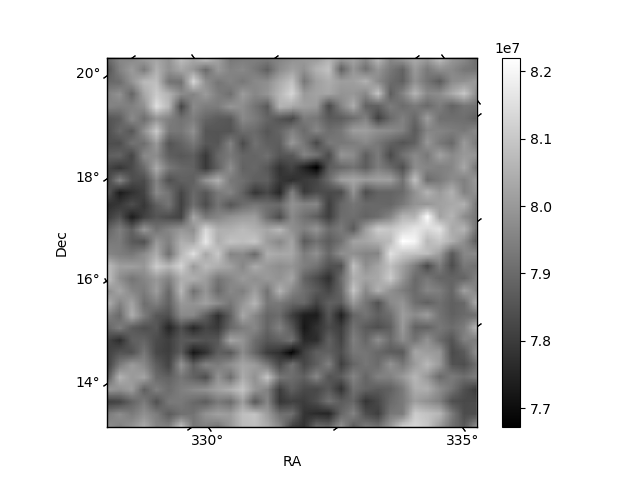
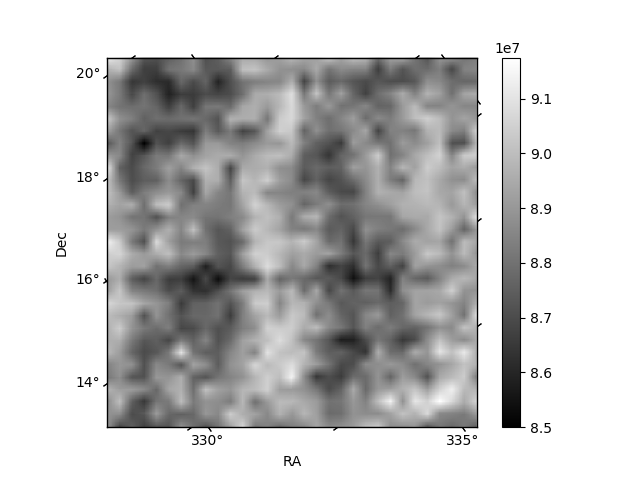
Histogram calculated using DETX and DETY for each event in the final _common_clean file
| Quadrant A | 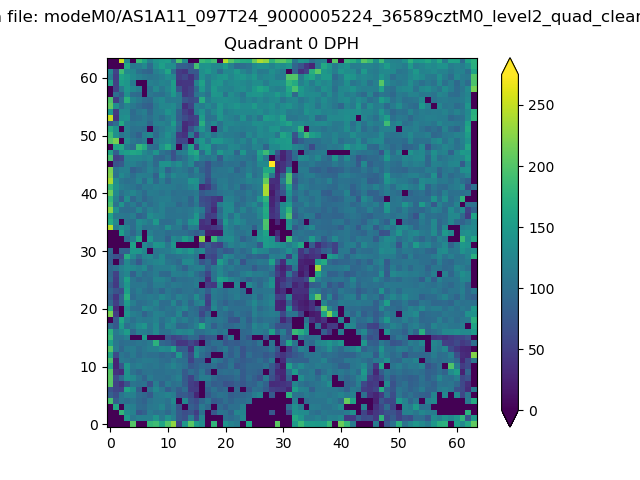 |
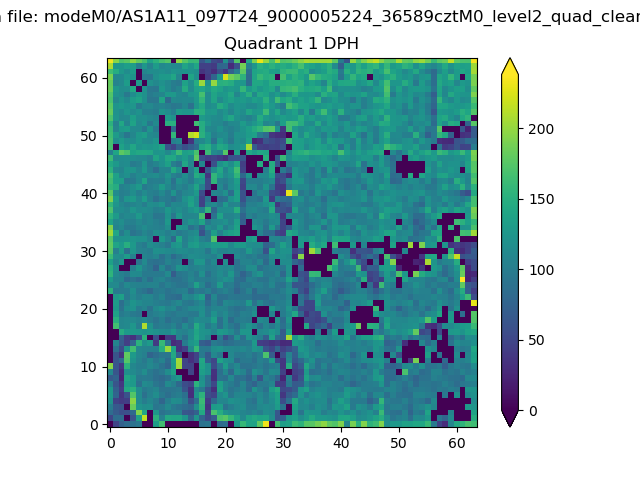 |
Quadrant B |
|---|---|---|---|
| Quadrant D | 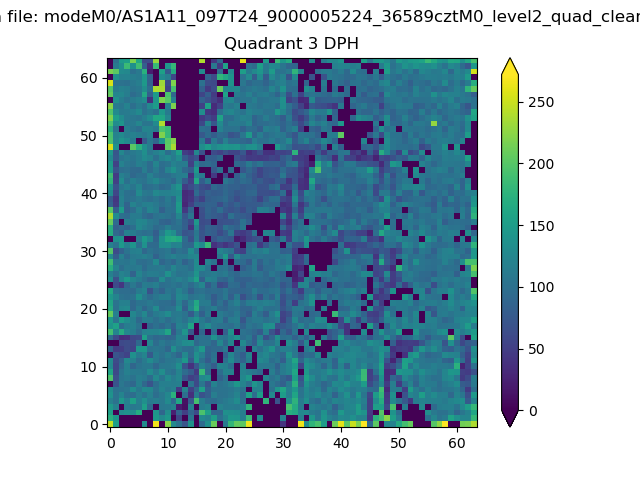 |
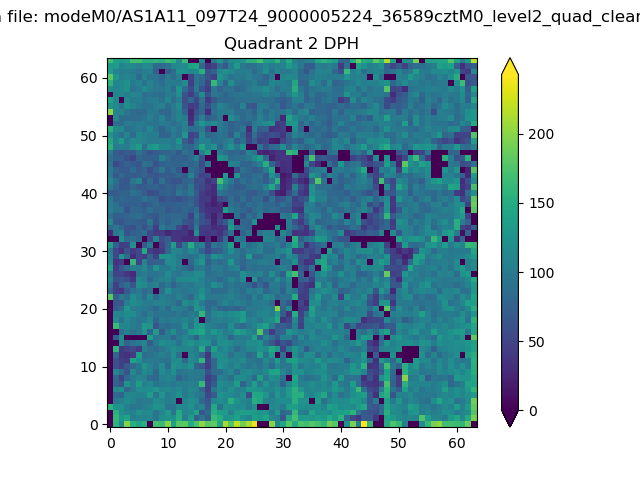 |
Quadrant C |
| Plot type | Count rate plots | Images |
|---|---|---|
| Comparison with Poisson distribution Blue bars denote a histogram of data divided into 1 sec bins. Red curve is a Poisson curve with rate = median count rate of data. |
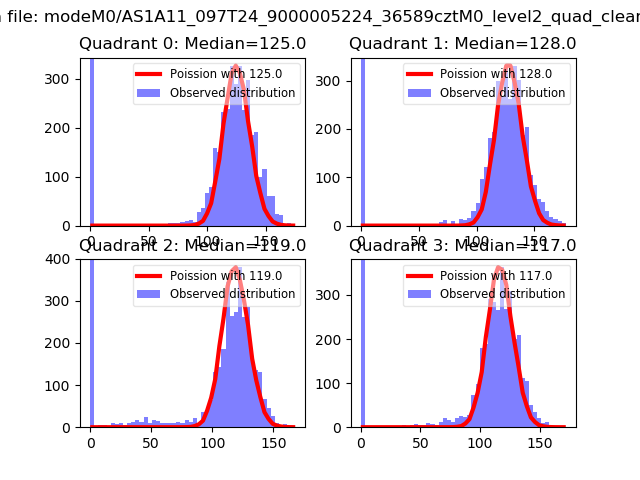 |
 |
| Quadrant-wise count rates Data is divided into 100 sec bins |
 |
|
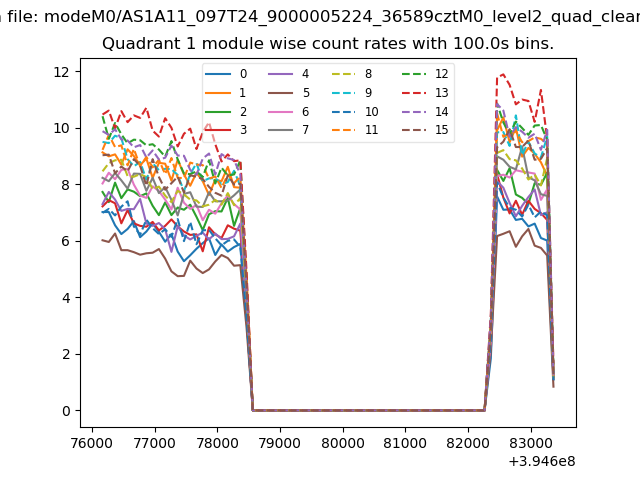
| Module-wise count rates for Quadrant A Data is divided into 100 sec bins |
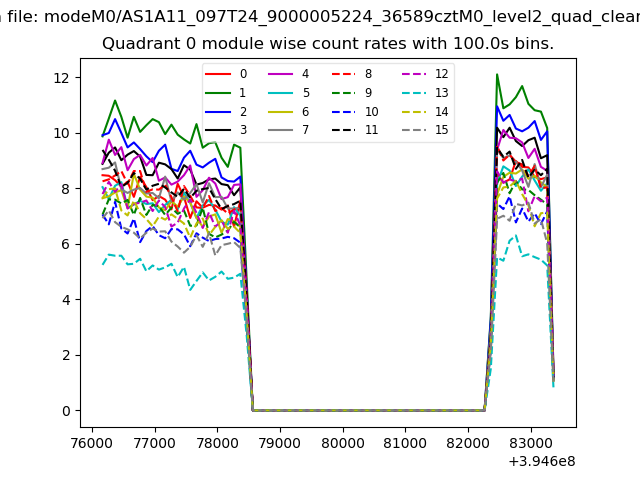 |
 |
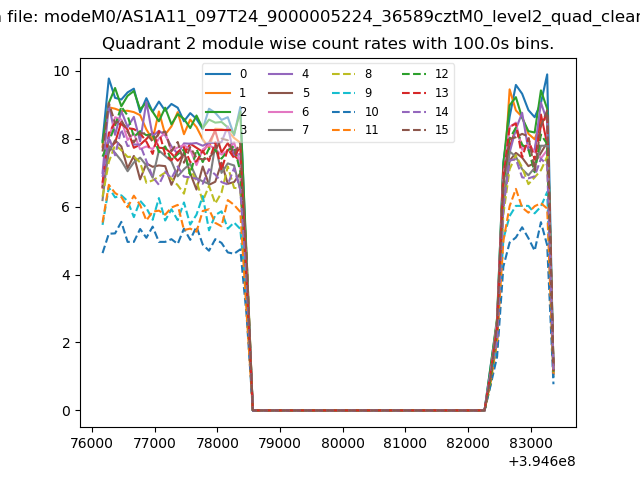
| Module-wise count rates for Quadrant B Data is divided into 100 sec bins |
 |
 |
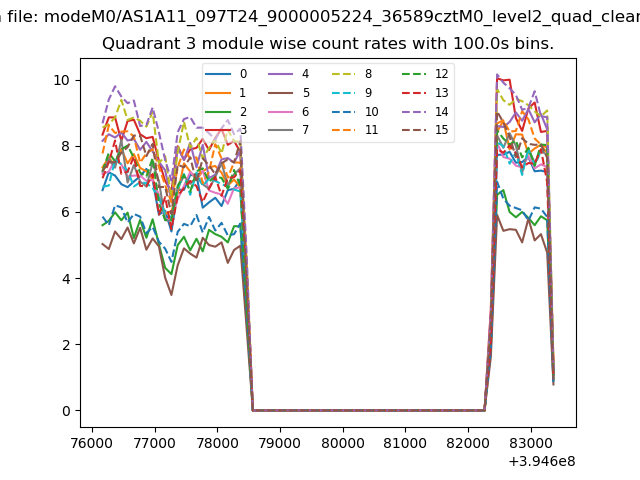
| Module-wise count rates for Quadrant C Data is divided into 100 sec bins |
 |
 |
| Module-wise count rates for Quadrant D Data is divided into 100 sec bins |
 |
 |
| Parameter | Plot |
|---|---|
| CZT HV Monitor | 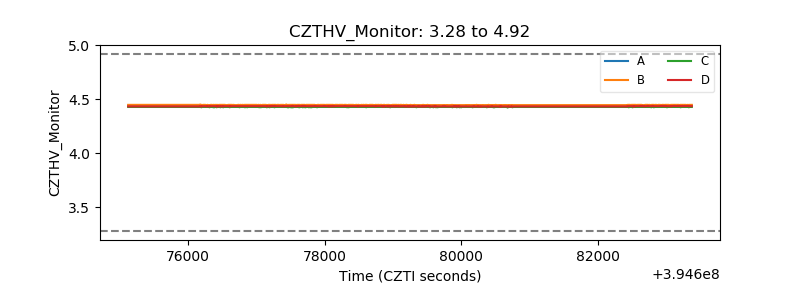 |
| D_VDD | 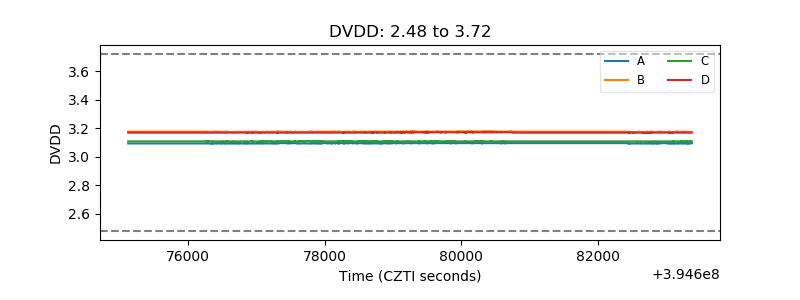 |
| Temperature 1 | 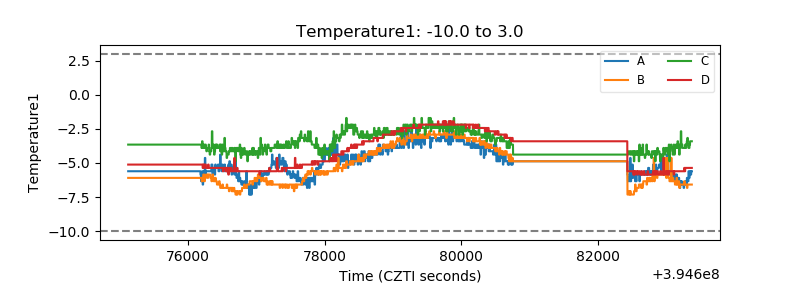 |
| Veto HV Monitor | 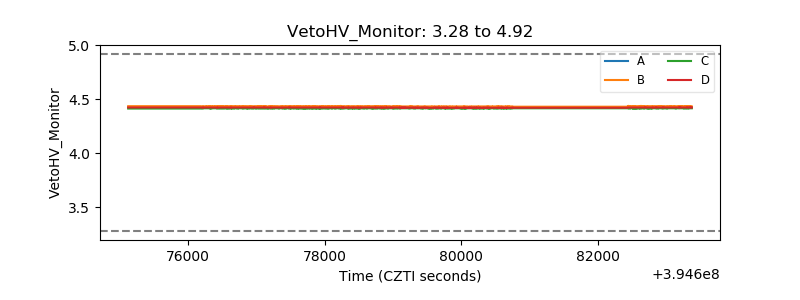 |
| Veto LLD | 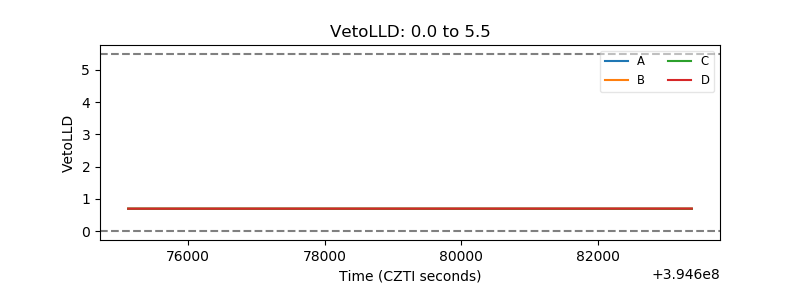 |
| Alpha Counter |  |
| _CPM_Rate | 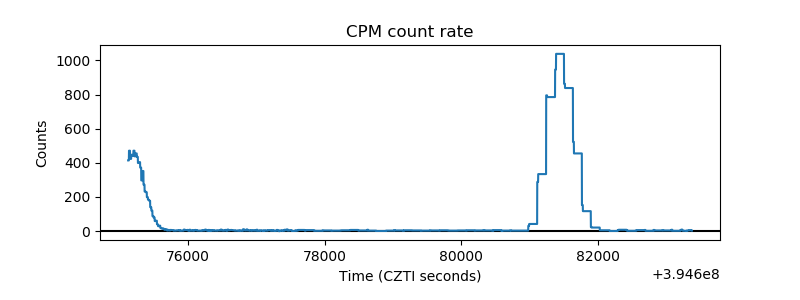 |
| CZT Counter | 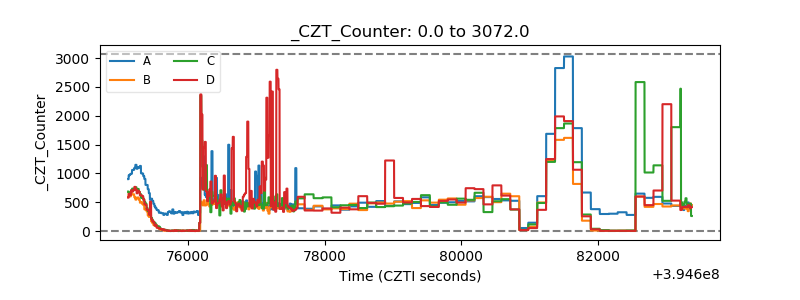 |
| +2.5 Volts monitor |  |
| +5 Volts monitor |  |
| _ROLL_ROT | 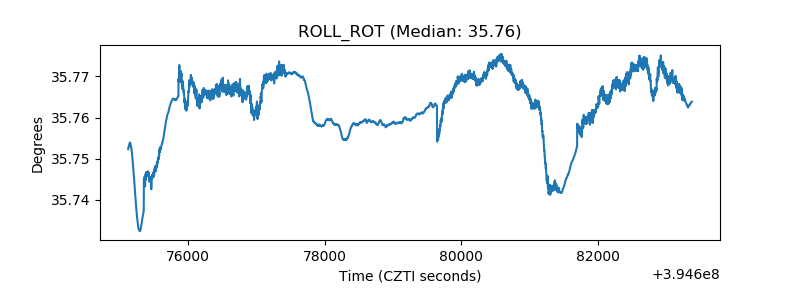 |
| _Roll_DEC | 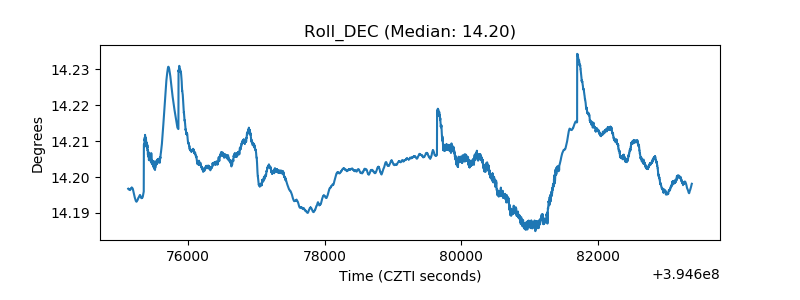 |
| _Roll_RA | 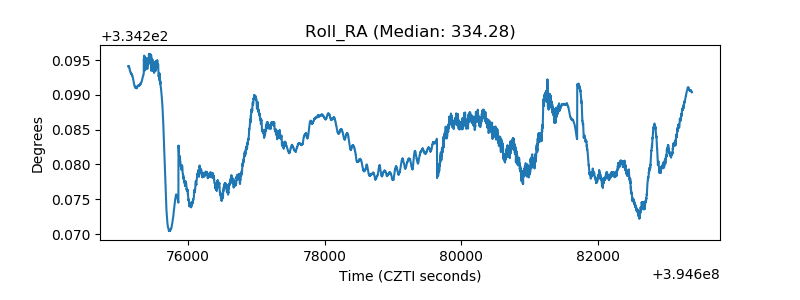 |
| Veto Counter | 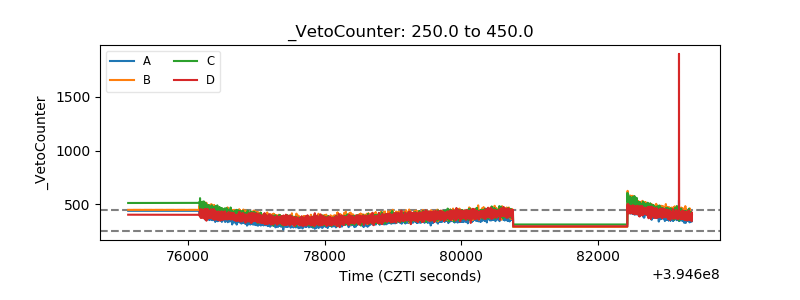 |