| Param | Original file | Final file |
|---|---|---|
| Filename | modeM0/AS1A11_097T24_9000005224_36591cztM0_level2.evt | modeM0/AS1A11_097T24_9000005224_36591cztM0_level2_quad_clean.evt |
| Size (bytes) | 412,191,360 | 65,701,440 |
| Size | 393.1 MB | 62.7 MB |
| Events in quadrant A | 2,703,651 | 418,696 |
| Events in quadrant B | 2,607,329 | 427,304 |
| Events in quadrant C | 3,672,544 | 381,293 |
| Events in quadrant D | 3,135,070 | 386,525 |
| Mode M0 | |||
|---|---|---|---|
| Quadrant | BADHDUFLAG | Total packets | Discarded packets |
| A | 0 | 11312 | 3 |
| B | 0 | 11066 | 2 |
| C | 0 | 14160 | 2 |
| D | 0 | 13046 | 2 |
| Mode M9 | |||
|---|---|---|---|
| Quadrant | BADHDUFLAG | Total packets | Discarded packets |
| A | 0 | 26 | 0 |
| B | 0 | 26 | 0 |
| C | 0 | 26 | 0 |
| D | 0 | 27 | 0 |
| Mode SS | |||
|---|---|---|---|
| Quadrant | BADHDUFLAG | Total packets | Discarded packets |
| A | 0 | 108 | 0 |
| B | 0 | 108 | 0 |
| C | 0 | 108 | 0 |
| D | 0 | 108 | 0 |
| Quadrant | Total seconds | Saturated seconds | Saturation percentage |
|---|---|---|---|
| A | 5368 | 17 | 0.316692% |
| B | 5368 | 16 | 0.298063% |
| C | 5368 | 312 | 5.812221% |
| D | 5368 | 63 | 1.173621% |
Noise dominated data is calculated using 1-second bins in cleaned event files. If a bin has >2000 counts, and if more than 50% of those come from <1% of pixels, then it is considered to be noise-dominated and hence unusable.
| Quadrant | # 1 sec bins | Bins with >0 counts | Bins with >2000 counts | High rate bins dominated by noise | Noise dominated (total time) | Noise dominated (detector-on time) | Marked lightcurve |
|---|---|---|---|---|---|---|---|
| A | 7161 | 5369 | 2 | 2 | 0.03% | 0.04% | 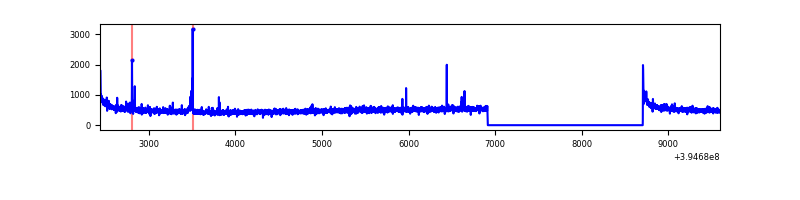 |
| B | 7161 | 5369 | 7 | 7 | 0.10% | 0.13% | 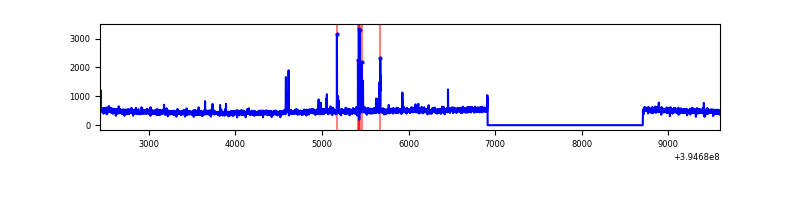 |
| C | 7161 | 5369 | 278 | 278 | 3.88% | 5.18% | 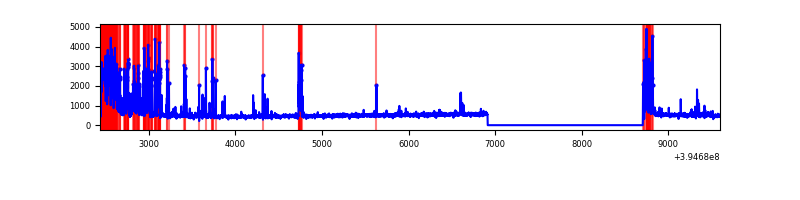 |
| D | 7161 | 5369 | 49 | 49 | 0.68% | 0.91% | 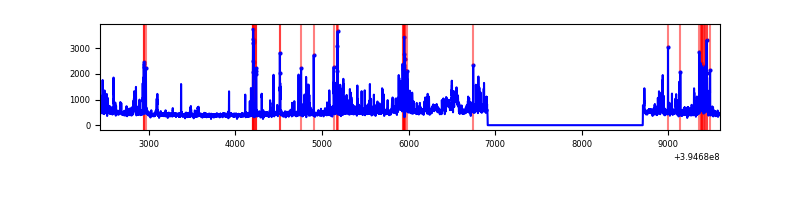 |
Top three noisy pixels from each quadrant. If the there are fewer than three noisy pixels in the level2.evt file, extra rows are filled as -1
| Pixel properties | Quadrant properties | ||||||
|---|---|---|---|---|---|---|---|
| Quadrant | DetID | PixID | Counts | Sigma | Mean | Median | Sigma |
| A | 10 | 83 | 197414 | 1545.4 | 634 | 624 | 127.3 |
| A | 15 | 223 | 25863 | 198.2 | 634 | 624 | 127.3 |
| A | 9 | 143 | 13504 | 101.15 | 634 | 624 | 127.3 |
| B | 5 | 255 | 64003 | 521.84 | 627 | 610 | 121.5 |
| B | 0 | 199 | 37637 | 304.8 | 627 | 610 | 121.5 |
| B | 0 | 213 | 18815 | 149.86 | 627 | 610 | 121.5 |
| C | 14 | 254 | 859948 | 6291.05 | 588 | 594 | 136.6 |
| C | 0 | 10 | 274895 | 2008.07 | 588 | 594 | 136.6 |
| C | 15 | 214 | 227197 | 1658.89 | 588 | 594 | 136.6 |
| D | 13 | 249 | 153742 | 1047.18 | 605 | 589 | 146.3 |
| D | 2 | 250 | 148751 | 1013.05 | 605 | 589 | 146.3 |
| D | 13 | 171 | 106089 | 721.35 | 605 | 589 | 146.3 |
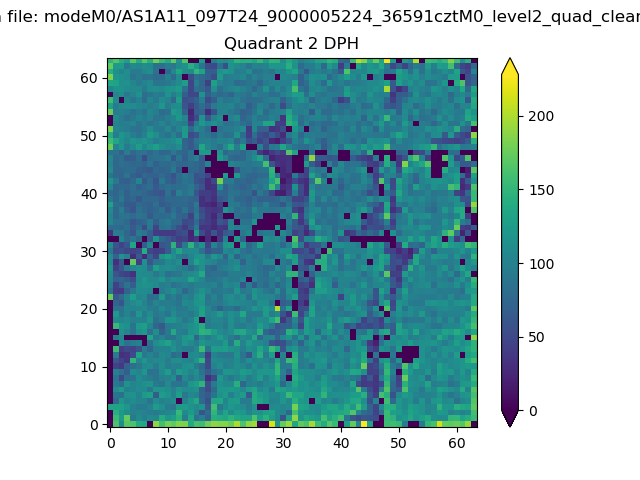
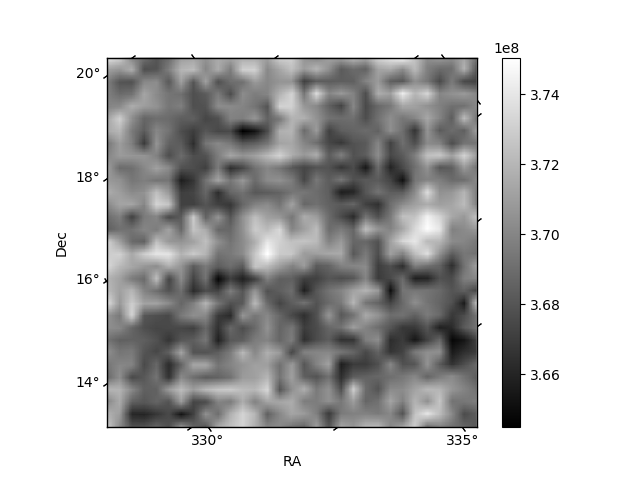
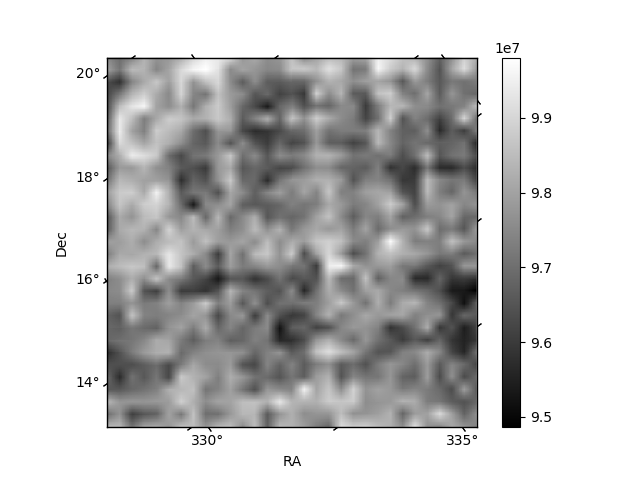
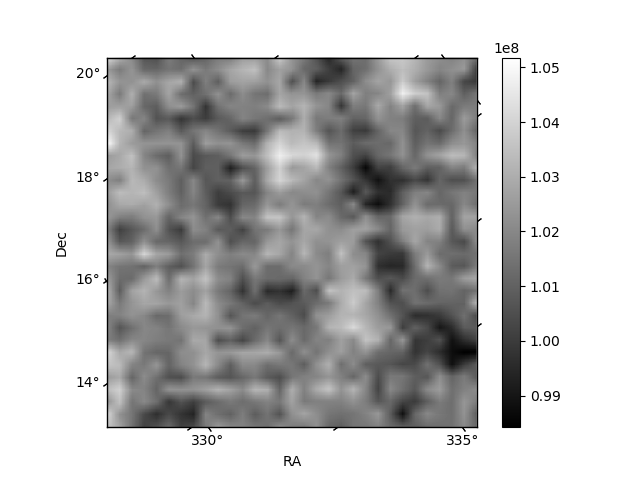
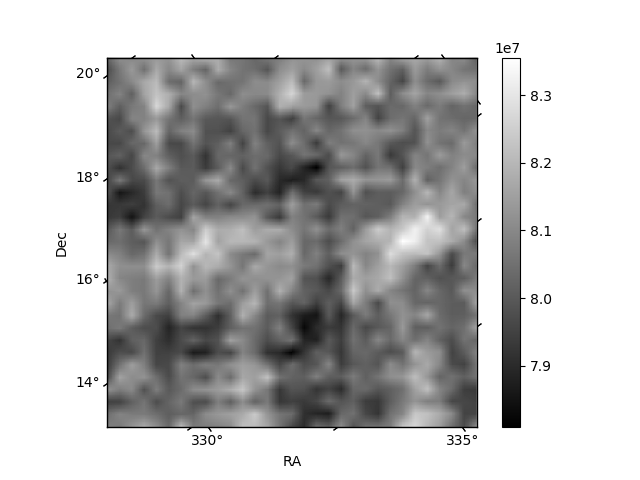
Histogram calculated using DETX and DETY for each event in the final _common_clean file
| Quadrant A | 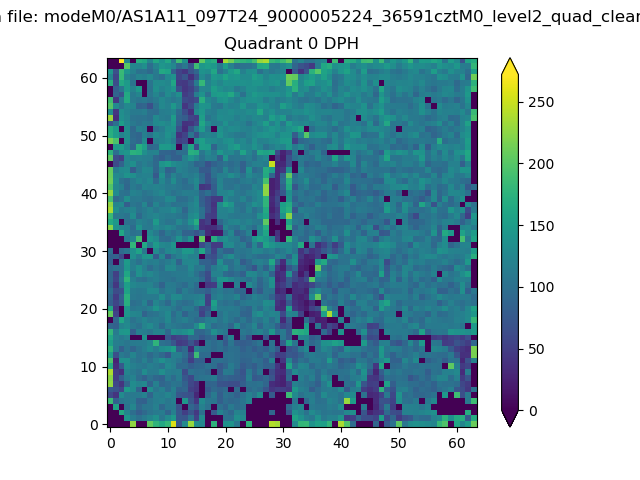 |
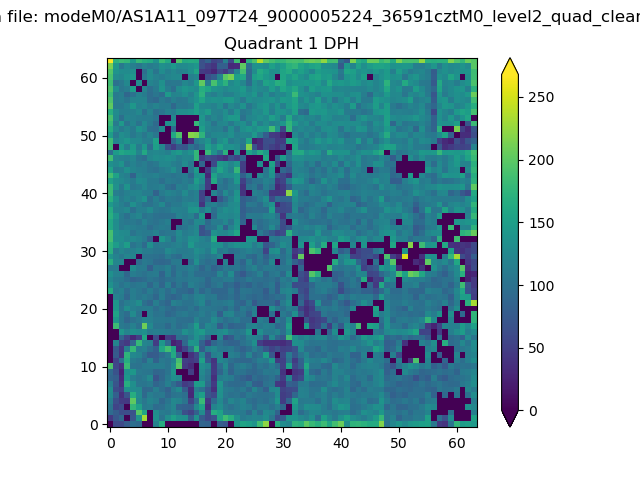 |
Quadrant B |
|---|---|---|---|
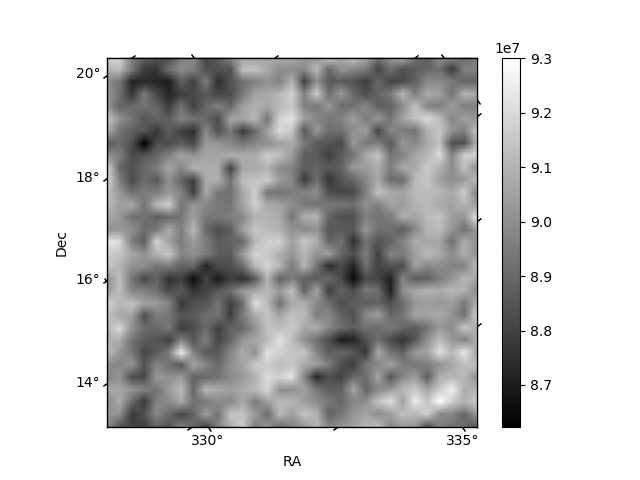
| Quadrant D | 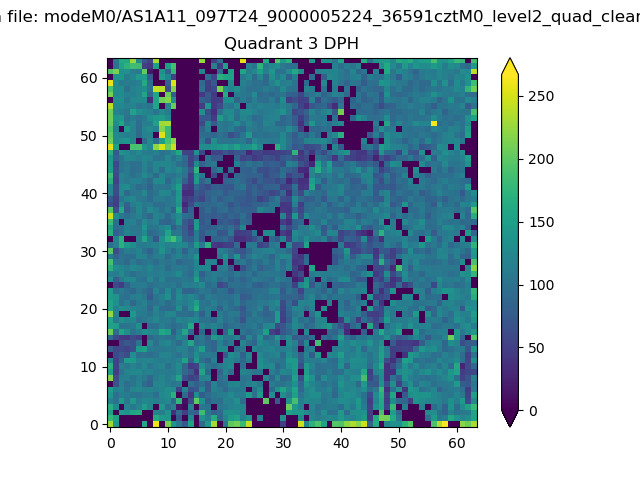 |
 |
Quadrant C |
| Plot type | Count rate plots | Images |
|---|---|---|
| Comparison with Poisson distribution Blue bars denote a histogram of data divided into 1 sec bins. Red curve is a Poisson curve with rate = median count rate of data. |
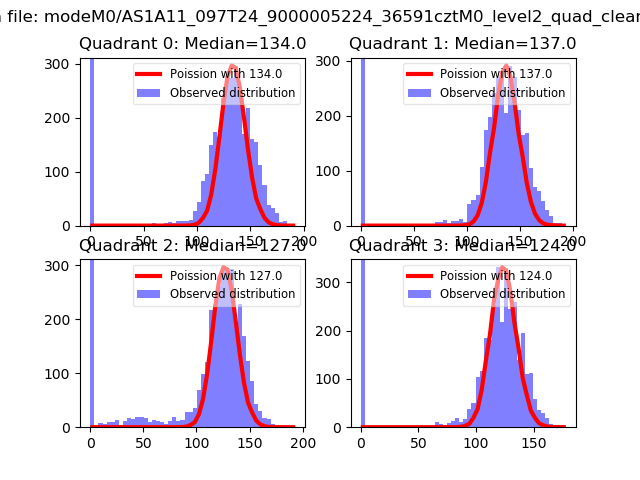 |
 |
| Quadrant-wise count rates Data is divided into 100 sec bins |
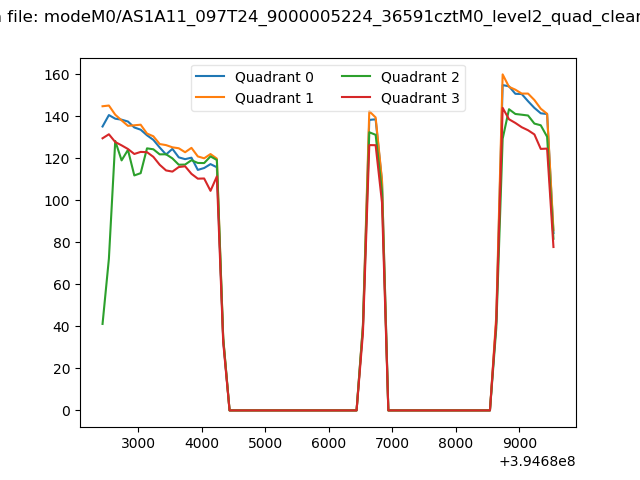 |
|
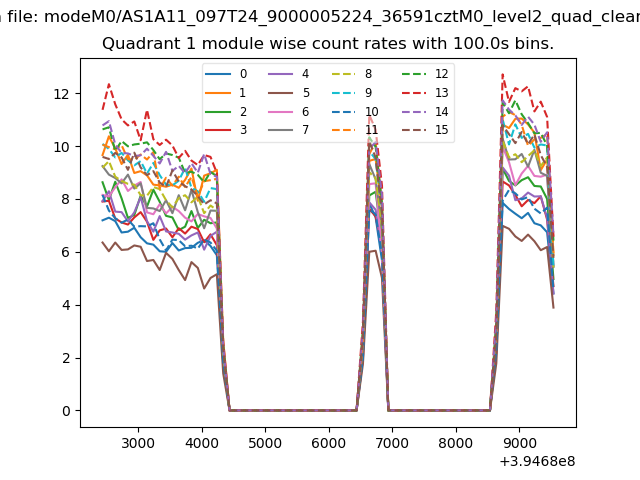
| Module-wise count rates for Quadrant A Data is divided into 100 sec bins |
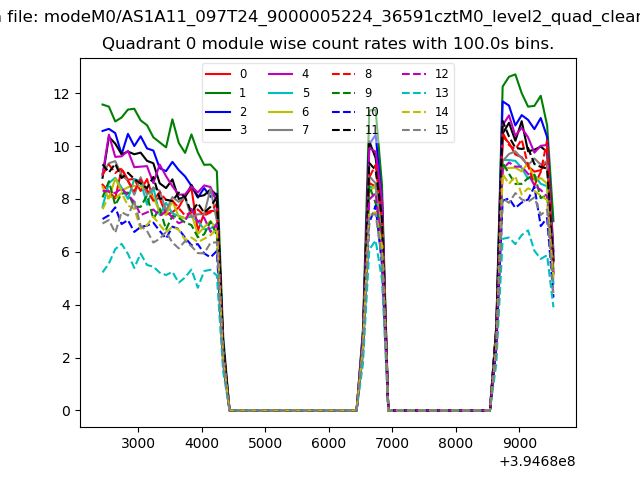 |
 |
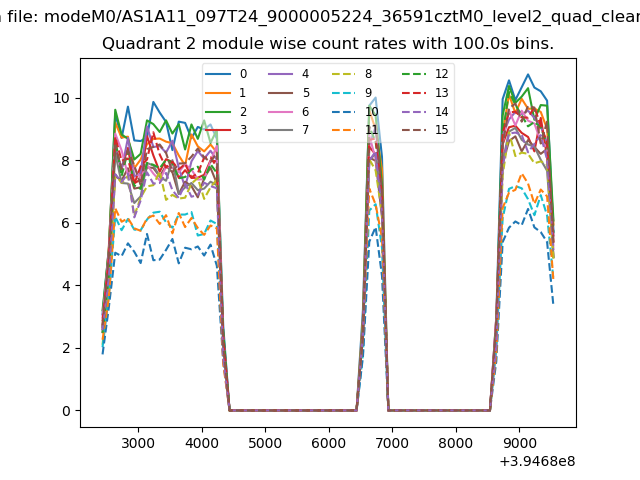
| Module-wise count rates for Quadrant B Data is divided into 100 sec bins |
 |
 |
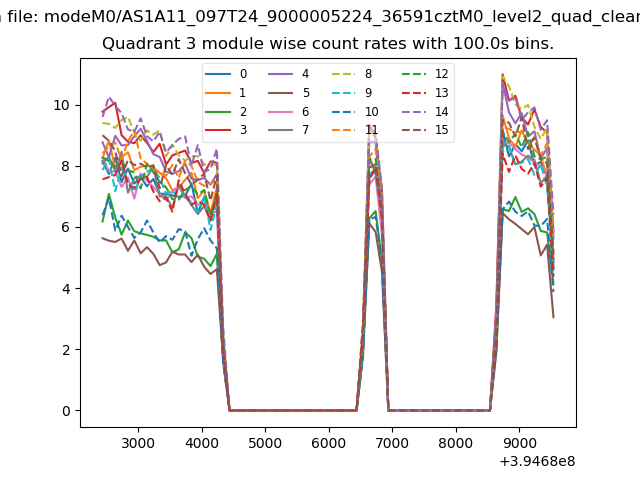
| Module-wise count rates for Quadrant C Data is divided into 100 sec bins |
 |
 |
| Module-wise count rates for Quadrant D Data is divided into 100 sec bins |
 |
 |
| Parameter | Plot |
|---|---|
| CZT HV Monitor | 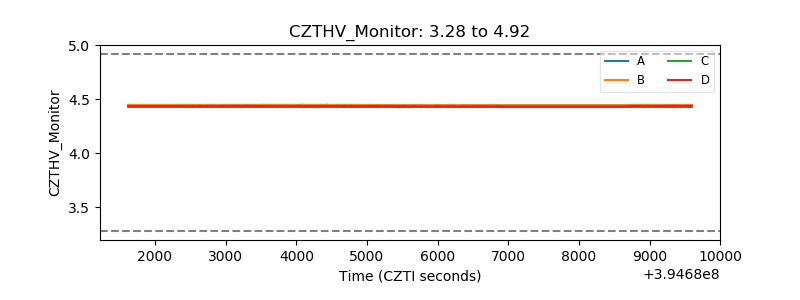 |
| D_VDD |  |
| Temperature 1 | 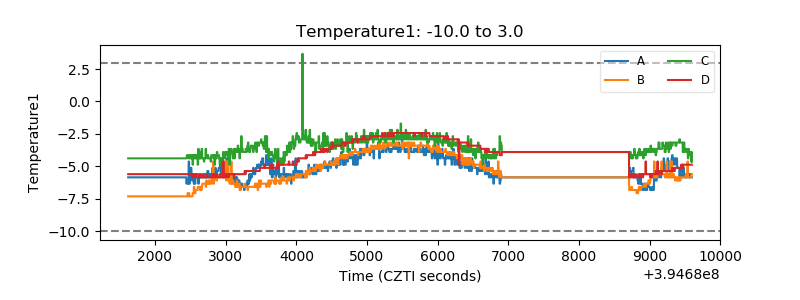 |
| Veto HV Monitor | 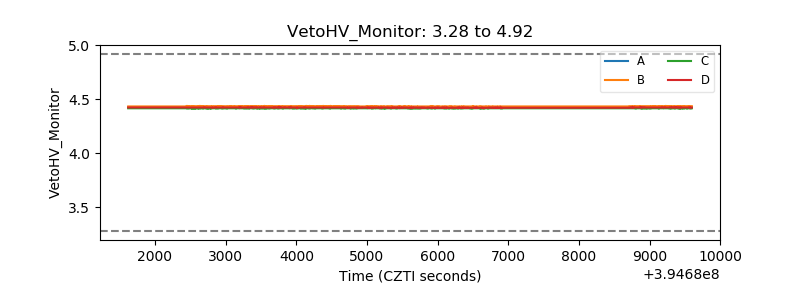 |
| Veto LLD | 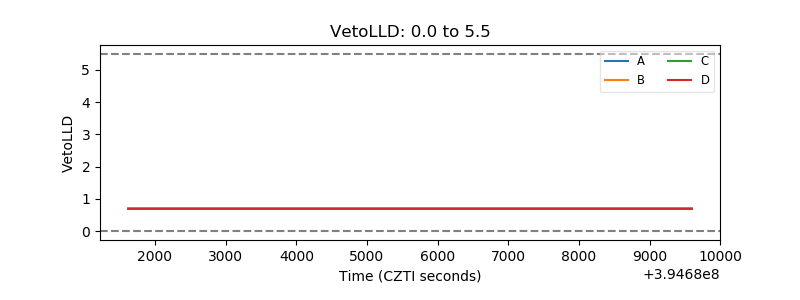 |
| Alpha Counter | 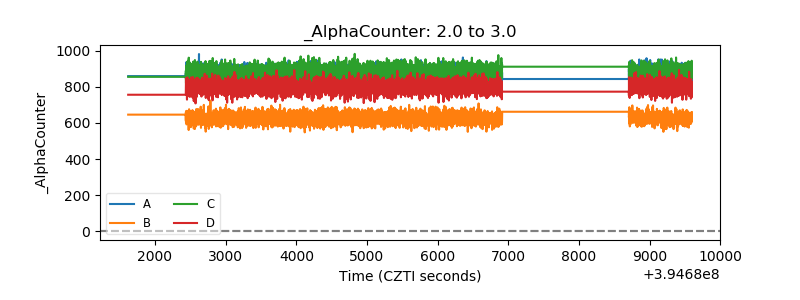 |
| _CPM_Rate | 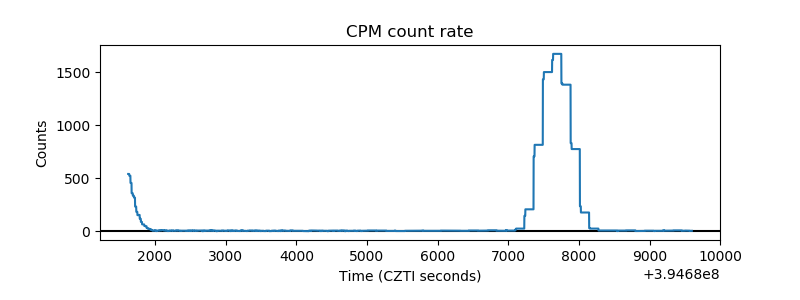 |
| CZT Counter | 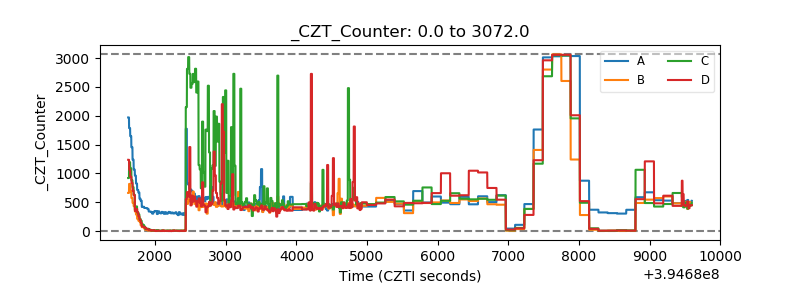 |
| +2.5 Volts monitor |  |
| +5 Volts monitor |  |
| _ROLL_ROT | 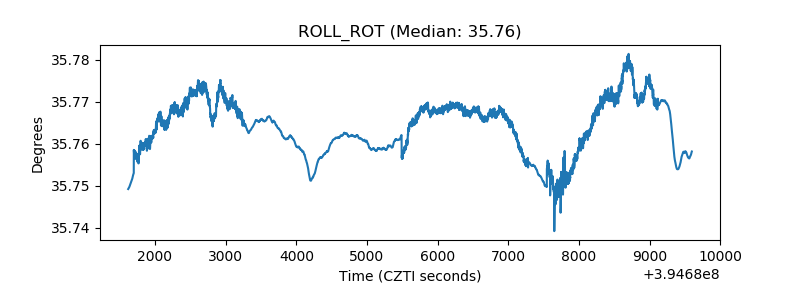 |
| _Roll_DEC | 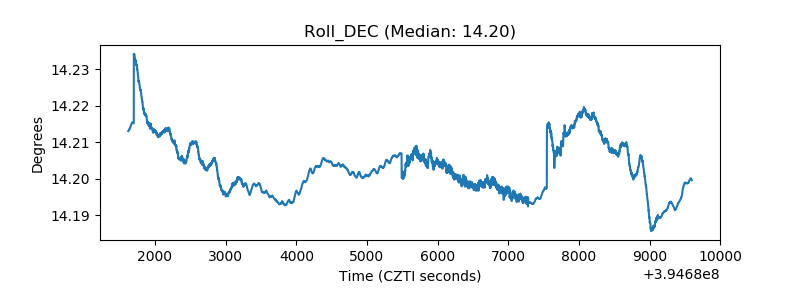 |
| _Roll_RA | 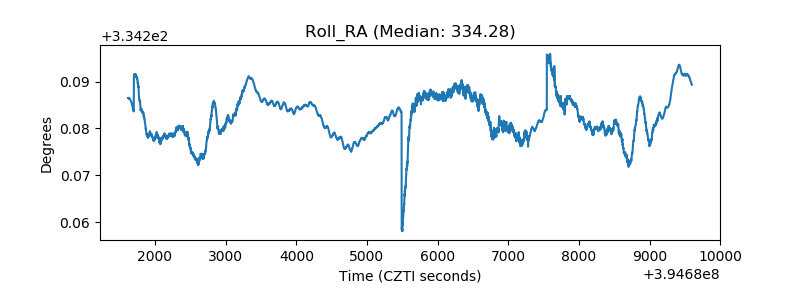 |
| Veto Counter | 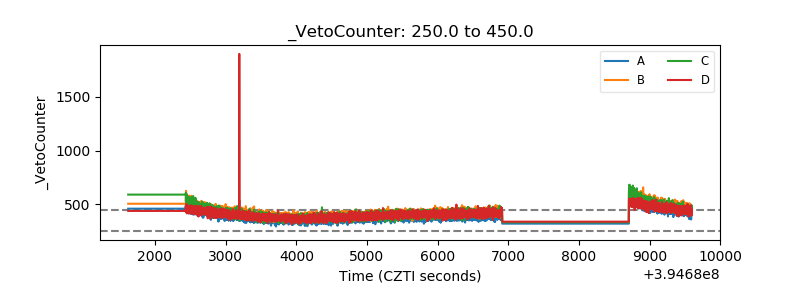 |