| Param | Original file | Final file |
|---|---|---|
| Filename | modeM0/AS1A11_097T24_9000005224_36592cztM0_level2.evt | modeM0/AS1A11_097T24_9000005224_36592cztM0_level2_quad_clean.evt |
| Size (bytes) | 430,142,400 | 71,625,600 |
| Size | 410.2 MB | 68.3 MB |
| Events in quadrant A | 2,829,911 | 462,992 |
| Events in quadrant B | 2,680,298 | 470,070 |
| Events in quadrant C | 3,410,113 | 431,200 |
| Events in quadrant D | 3,736,867 | 423,476 |
| Mode M0 | |||
|---|---|---|---|
| Quadrant | BADHDUFLAG | Total packets | Discarded packets |
| A | 0 | 11516 | 3 |
| B | 0 | 11113 | 2 |
| C | 0 | 13318 | 2 |
| D | 0 | 14668 | 2 |
| Mode M9 | |||
|---|---|---|---|
| Quadrant | BADHDUFLAG | Total packets | Discarded packets |
| A | 0 | 26 | 0 |
| B | 0 | 26 | 0 |
| C | 0 | 26 | 0 |
| D | 0 | 27 | 0 |
| Mode SS | |||
|---|---|---|---|
| Quadrant | BADHDUFLAG | Total packets | Discarded packets |
| A | 0 | 112 | 0 |
| B | 0 | 112 | 0 |
| C | 0 | 112 | 0 |
| D | 0 | 112 | 0 |
| Quadrant | Total seconds | Saturated seconds | Saturation percentage |
|---|---|---|---|
| A | 5438 | 9 | 0.165502% |
| B | 5438 | 7 | 0.128724% |
| C | 5438 | 164 | 3.015815% |
| D | 5438 | 112 | 2.059581% |
Noise dominated data is calculated using 1-second bins in cleaned event files. If a bin has >2000 counts, and if more than 50% of those come from <1% of pixels, then it is considered to be noise-dominated and hence unusable.
| Quadrant | # 1 sec bins | Bins with >0 counts | Bins with >2000 counts | High rate bins dominated by noise | Noise dominated (total time) | Noise dominated (detector-on time) | Marked lightcurve |
|---|---|---|---|---|---|---|---|
| A | 7351 | 5439 | 0 | 0 | 0.00% | 0.00% | 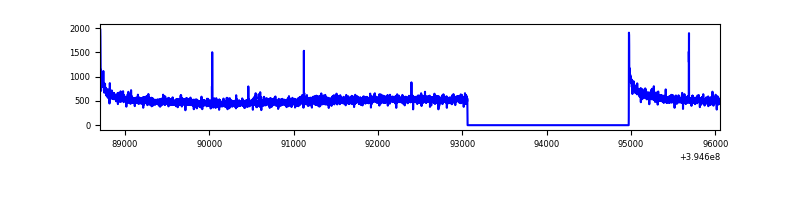 |
| B | 7351 | 5439 | 2 | 2 | 0.03% | 0.04% | 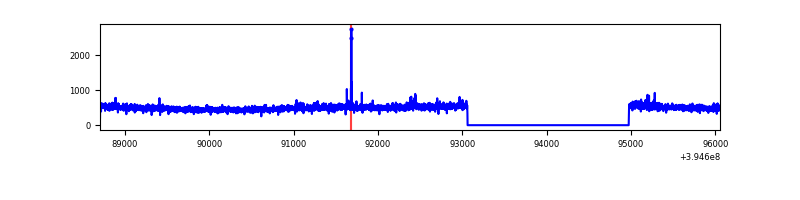 |
| C | 7351 | 5439 | 137 | 137 | 1.86% | 2.52% | 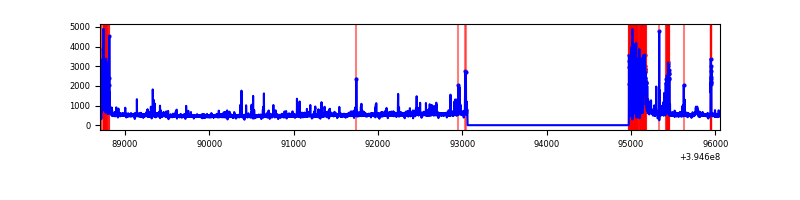 |
| D | 7351 | 5439 | 104 | 104 | 1.41% | 1.91% | 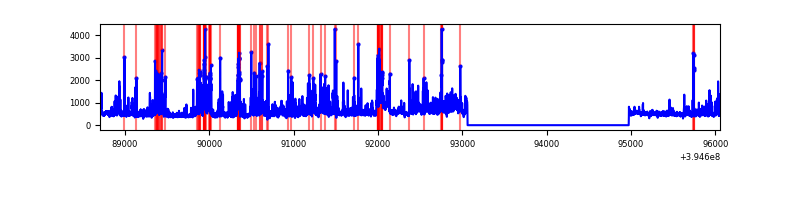 |
Top three noisy pixels from each quadrant. If the there are fewer than three noisy pixels in the level2.evt file, extra rows are filled as -1
| Pixel properties | Quadrant properties | ||||||
|---|---|---|---|---|---|---|---|
| Quadrant | DetID | PixID | Counts | Sigma | Mean | Median | Sigma |
| A | 10 | 83 | 197957 | 1467.02 | 675 | 663 | 134.5 |
| A | 15 | 223 | 16242 | 115.84 | 675 | 663 | 134.5 |
| A | 9 | 143 | 8797 | 60.48 | 675 | 663 | 134.5 |
| B | 0 | 213 | 29731 | 229.67 | 663 | 647 | 126.6 |
| B | 12 | 111 | 15515 | 117.41 | 663 | 647 | 126.6 |
| B | 11 | 111 | 14344 | 108.16 | 663 | 647 | 126.6 |
| C | 0 | 10 | 385994 | 2662.69 | 628 | 633 | 144.7 |
| C | 0 | 207 | 260145 | 1793.12 | 628 | 633 | 144.7 |
| C | 15 | 214 | 234448 | 1615.57 | 628 | 633 | 144.7 |
| D | 12 | 227 | 488229 | 3144.57 | 641 | 626 | 155.1 |
| D | 13 | 249 | 207798 | 1336.06 | 641 | 626 | 155.1 |
| D | 2 | 250 | 181123 | 1164.03 | 641 | 626 | 155.1 |
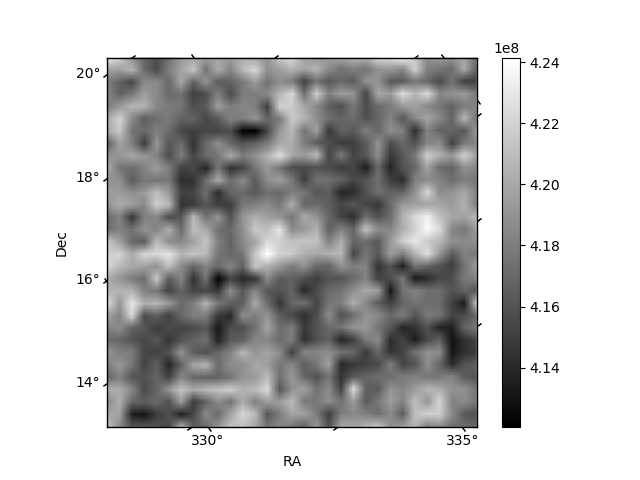
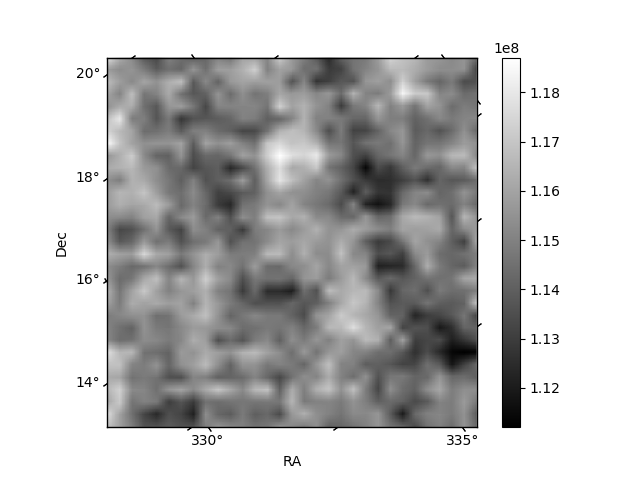
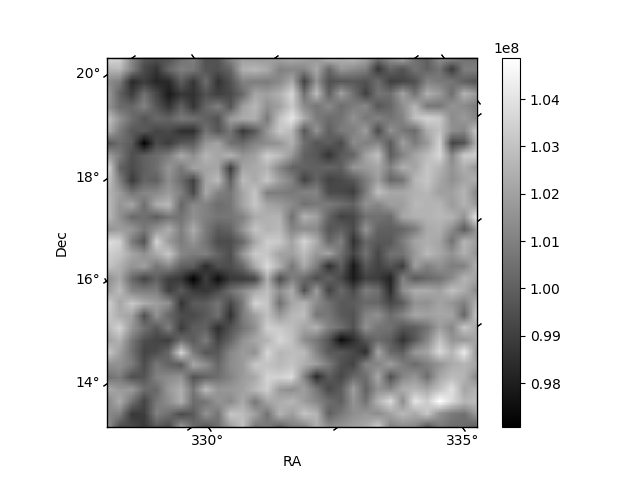
Histogram calculated using DETX and DETY for each event in the final _common_clean file
| Quadrant A | 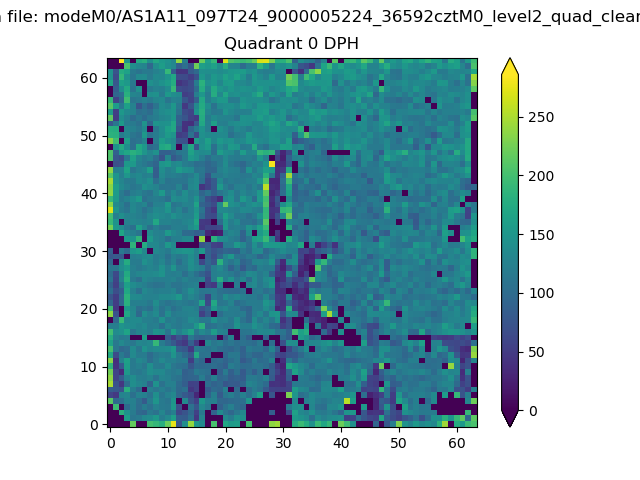 |
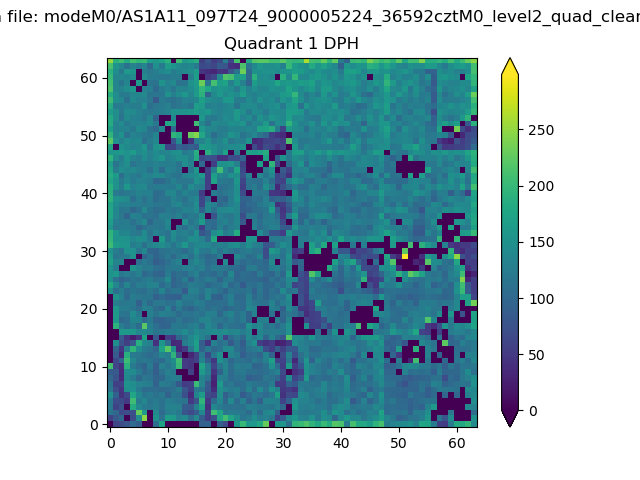 |
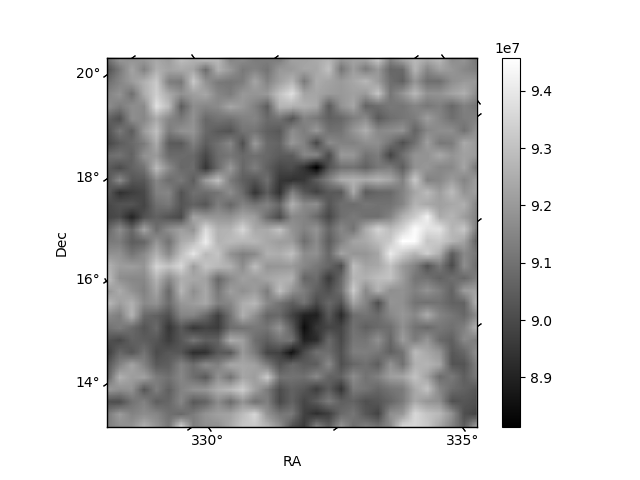
Quadrant B |
|---|---|---|---|
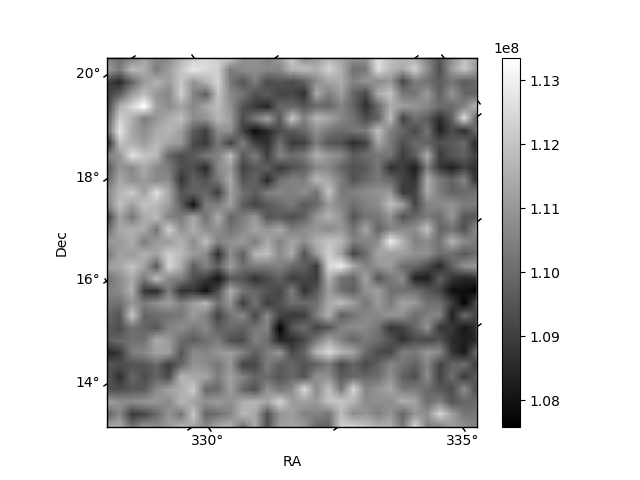
| Quadrant D |  |
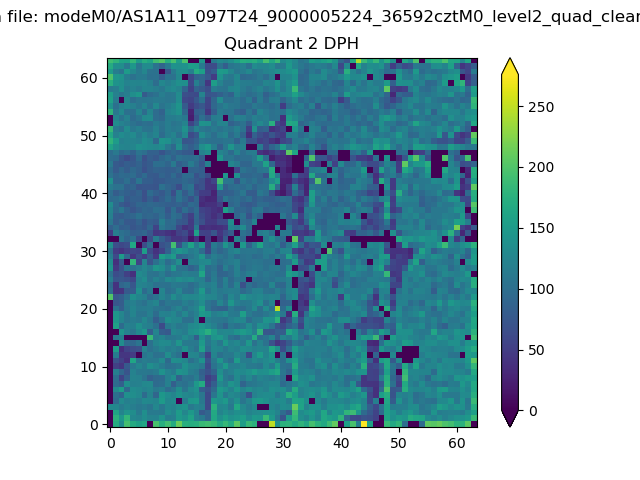 |
Quadrant C |
| Plot type | Count rate plots | Images |
|---|---|---|
| Comparison with Poisson distribution Blue bars denote a histogram of data divided into 1 sec bins. Red curve is a Poisson curve with rate = median count rate of data. |
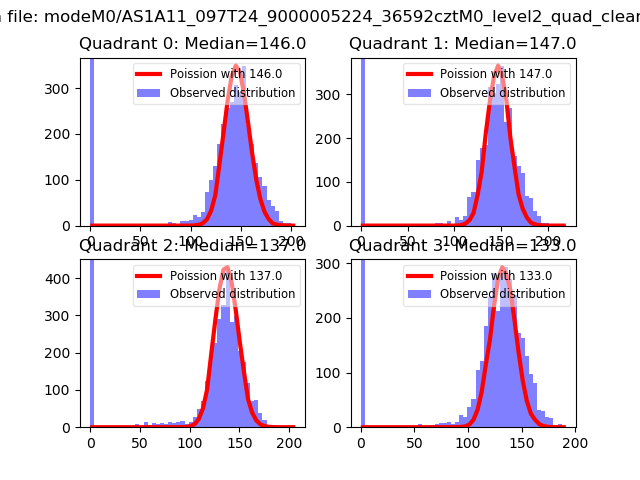 |
 |
| Quadrant-wise count rates Data is divided into 100 sec bins |
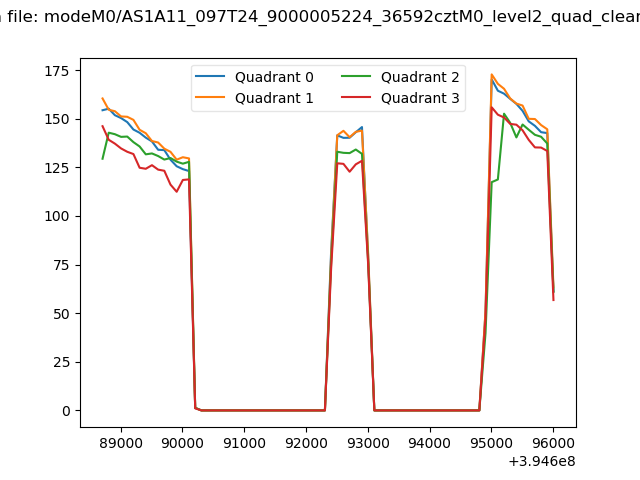 |
|
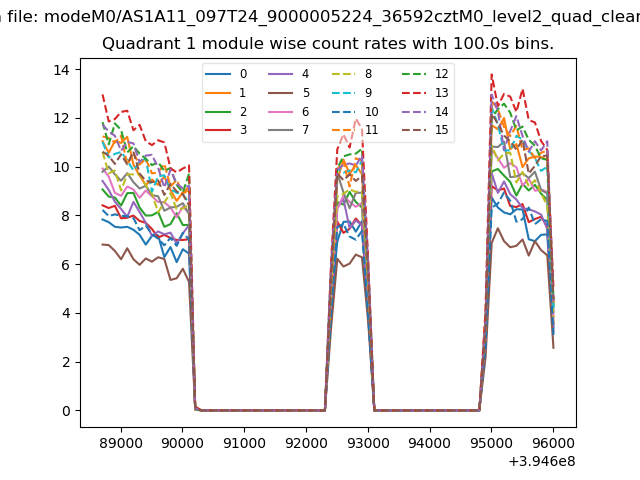
| Module-wise count rates for Quadrant A Data is divided into 100 sec bins |
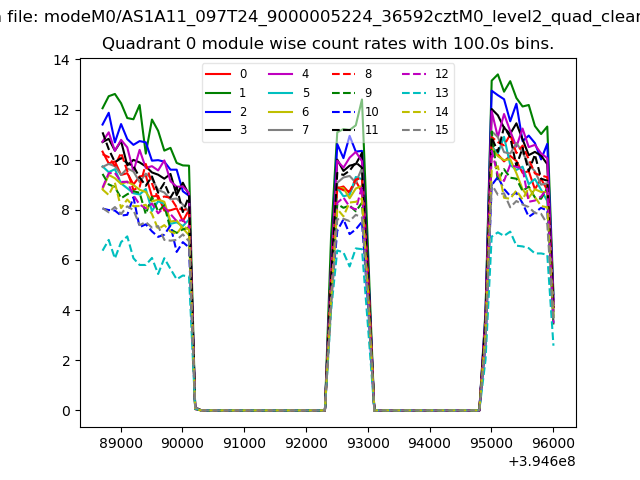 |
 |
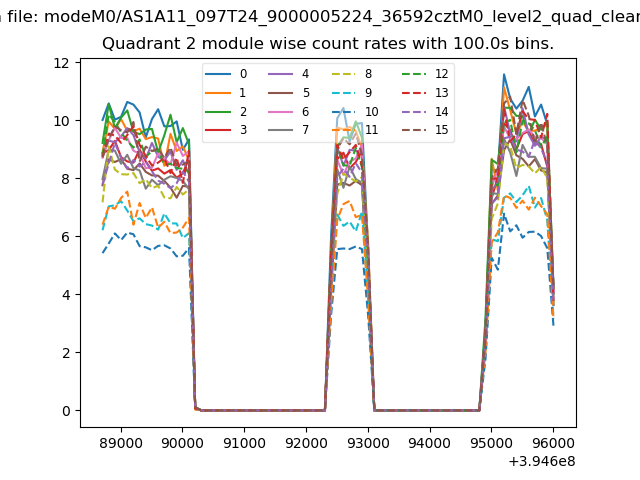
| Module-wise count rates for Quadrant B Data is divided into 100 sec bins |
 |
 |
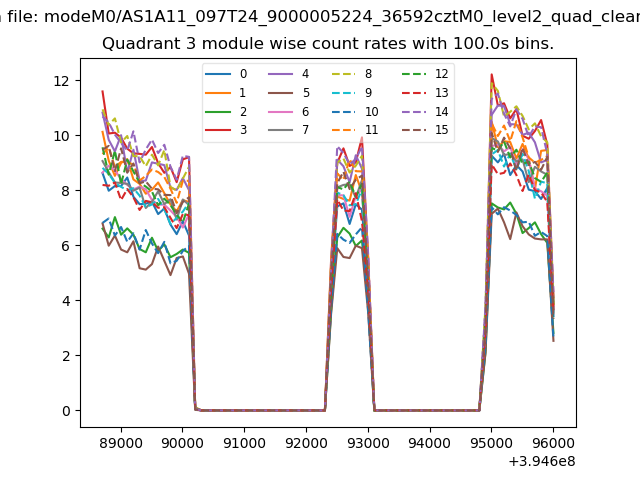
| Module-wise count rates for Quadrant C Data is divided into 100 sec bins |
 |
 |
| Module-wise count rates for Quadrant D Data is divided into 100 sec bins |
 |
 |
| Parameter | Plot |
|---|---|
| CZT HV Monitor | 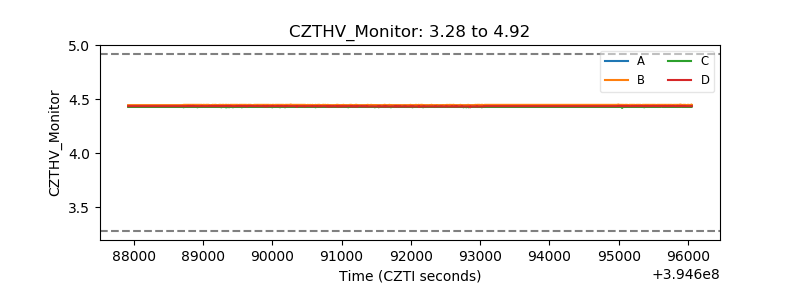 |
| D_VDD | 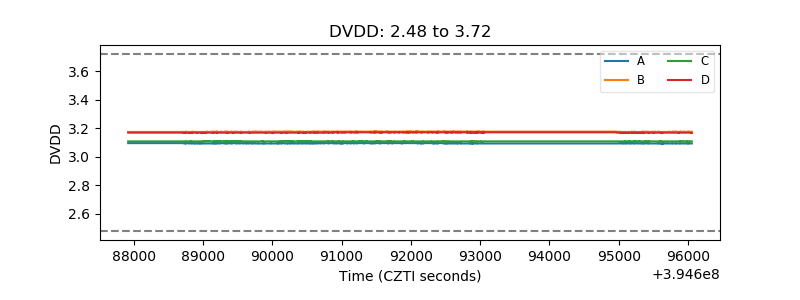 |
| Temperature 1 | 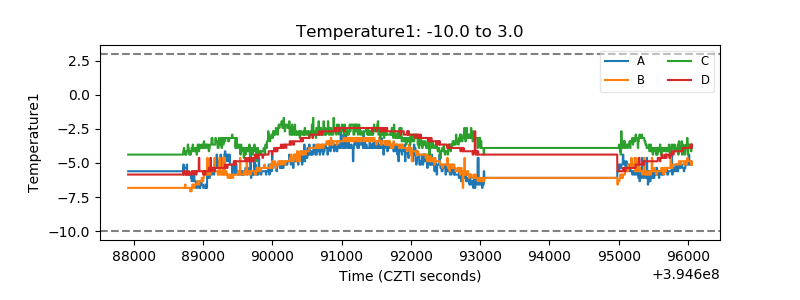 |
| Veto HV Monitor |  |
| Veto LLD | 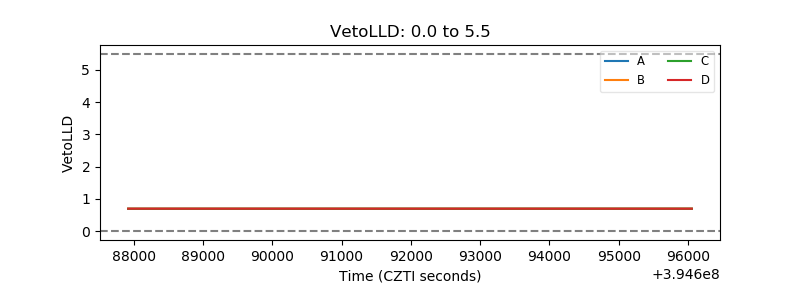 |
| Alpha Counter | 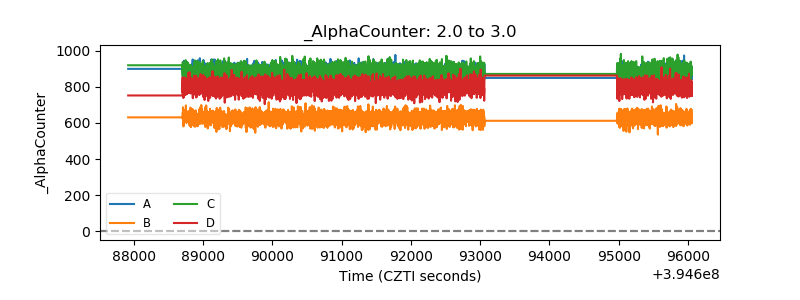 |
| _CPM_Rate |  |
| CZT Counter | 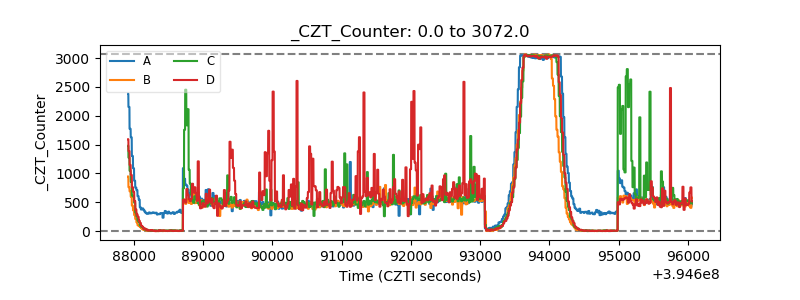 |
| +2.5 Volts monitor | 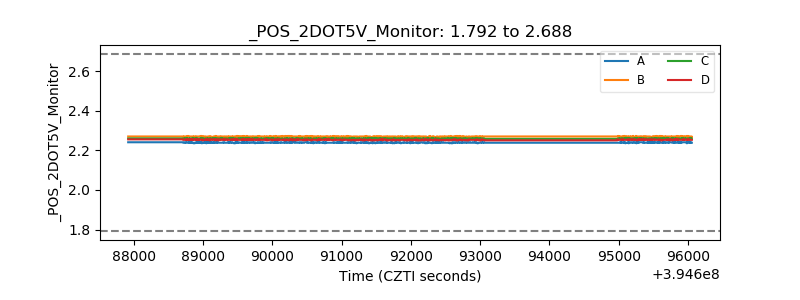 |
| +5 Volts monitor |  |
| _ROLL_ROT | 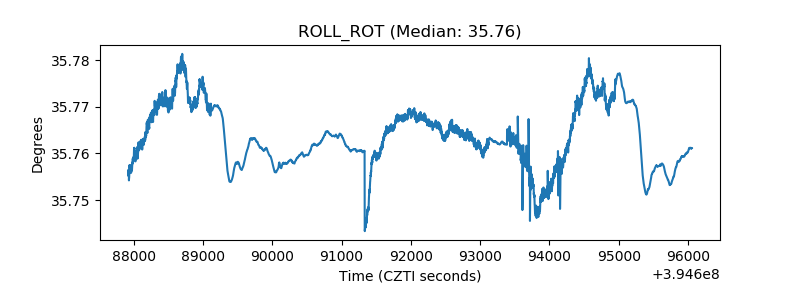 |
| _Roll_DEC | 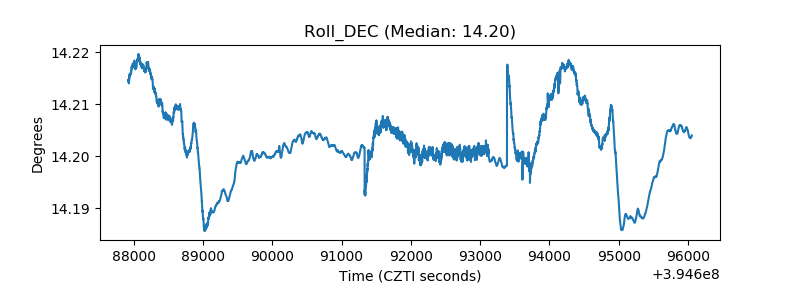 |
| _Roll_RA | 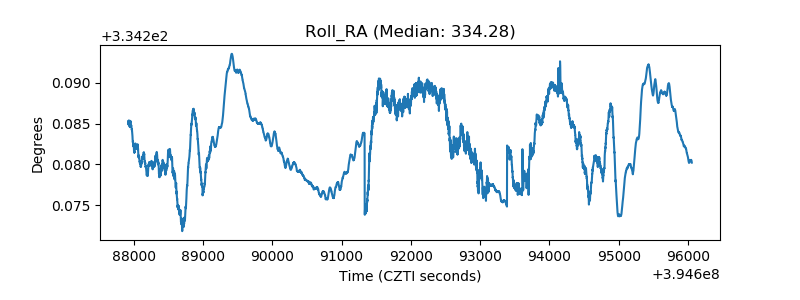 |
| Veto Counter | 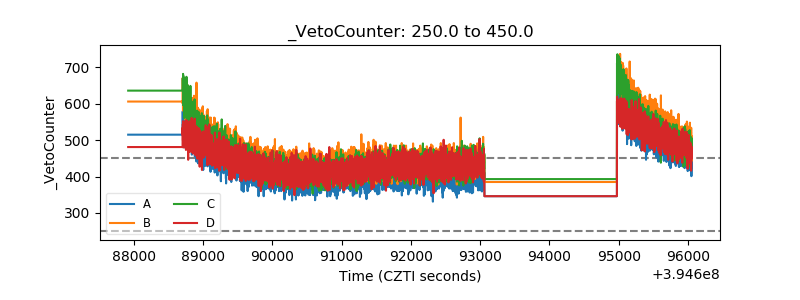 |