| Param | Original file | Final file |
|---|---|---|
| Filename | modeM0/AS1A11_097T24_9000005224_36593cztM0_level2.evt | modeM0/AS1A11_097T24_9000005224_36593cztM0_level2_quad_clean.evt |
| Size (bytes) | 482,958,720 | 63,437,760 |
| Size | 460.6 MB | 60.5 MB |
| Events in quadrant A | 2,902,255 | 406,340 |
| Events in quadrant B | 2,812,379 | 411,896 |
| Events in quadrant C | 4,849,430 | 364,214 |
| Events in quadrant D | 3,698,328 | 362,189 |
| Mode M0 | |||
|---|---|---|---|
| Quadrant | BADHDUFLAG | Total packets | Discarded packets |
| A | 0 | 11570 | 3 |
| B | 0 | 11331 | 2 |
| C | 0 | 17790 | 2 |
| D | 0 | 14333 | 2 |
| Mode M9 | |||
|---|---|---|---|
| Quadrant | BADHDUFLAG | Total packets | Discarded packets |
| A | 0 | 27 | 0 |
| B | 0 | 27 | 0 |
| C | 0 | 27 | 0 |
| D | 0 | 28 | 0 |
| Mode SS | |||
|---|---|---|---|
| Quadrant | BADHDUFLAG | Total packets | Discarded packets |
| A | 0 | 108 | 0 |
| B | 0 | 108 | 0 |
| C | 0 | 108 | 0 |
| D | 0 | 108 | 0 |
| Quadrant | Total seconds | Saturated seconds | Saturation percentage |
|---|---|---|---|
| A | 5374 | 11 | 0.204689% |
| B | 5374 | 15 | 0.279122% |
| C | 5374 | 373 | 6.940826% |
| D | 5374 | 227 | 4.224042% |
Noise dominated data is calculated using 1-second bins in cleaned event files. If a bin has >2000 counts, and if more than 50% of those come from <1% of pixels, then it is considered to be noise-dominated and hence unusable.
| Quadrant | # 1 sec bins | Bins with >0 counts | Bins with >2000 counts | High rate bins dominated by noise | Noise dominated (total time) | Noise dominated (detector-on time) | Marked lightcurve |
|---|---|---|---|---|---|---|---|
| A | 7407 | 5375 | 1 | 1 | 0.01% | 0.02% | 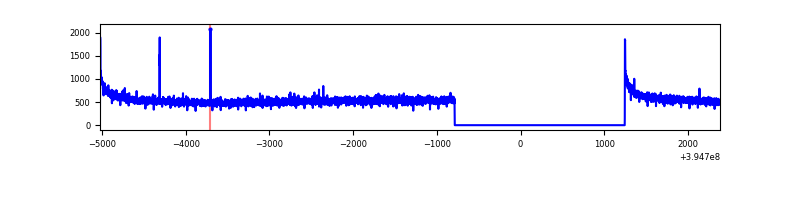 |
| B | 7407 | 5375 | 6 | 6 | 0.08% | 0.11% | 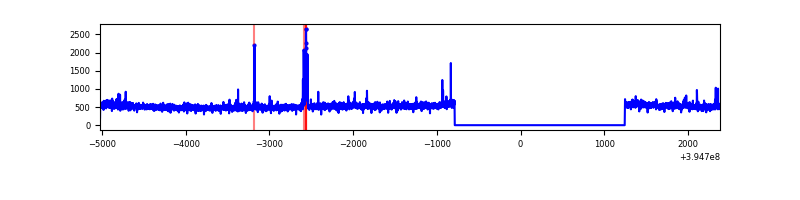 |
| C | 7407 | 5375 | 269 | 269 | 3.63% | 5.00% | 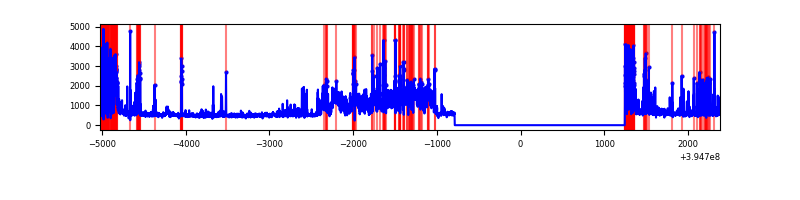 |
| D | 7407 | 5375 | 185 | 185 | 2.50% | 3.44% | 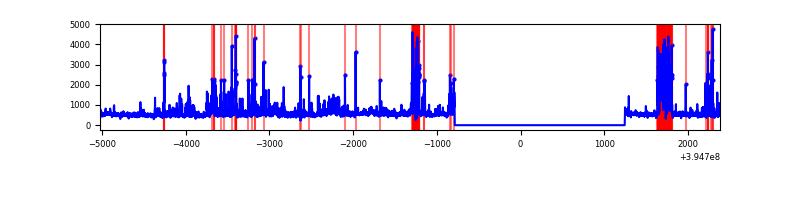 |
Top three noisy pixels from each quadrant. If the there are fewer than three noisy pixels in the level2.evt file, extra rows are filled as -1
| Pixel properties | Quadrant properties | ||||||
|---|---|---|---|---|---|---|---|
| Quadrant | DetID | PixID | Counts | Sigma | Mean | Median | Sigma |
| A | 10 | 83 | 196826 | 1430.16 | 696 | 685 | 137.1 |
| A | 15 | 223 | 11201 | 76.68 | 696 | 685 | 137.1 |
| A | 13 | 254 | 7952 | 52.99 | 696 | 685 | 137.1 |
| B | 0 | 213 | 48335 | 366.43 | 681 | 666 | 130.1 |
| B | 15 | 85 | 44200 | 334.65 | 681 | 666 | 130.1 |
| B | 12 | 111 | 15606 | 114.84 | 681 | 666 | 130.1 |
| C | 10 | 49 | 1060853 | 7200.69 | 637 | 642 | 147.2 |
| C | 0 | 10 | 609816 | 4137.36 | 637 | 642 | 147.2 |
| C | 0 | 207 | 392172 | 2659.17 | 637 | 642 | 147.2 |
| D | 10 | 253 | 281083 | 1788.54 | 654 | 638 | 156.8 |
| D | 13 | 249 | 248122 | 1578.33 | 654 | 638 | 156.8 |
| D | 12 | 128 | 219908 | 1398.4 | 654 | 638 | 156.8 |
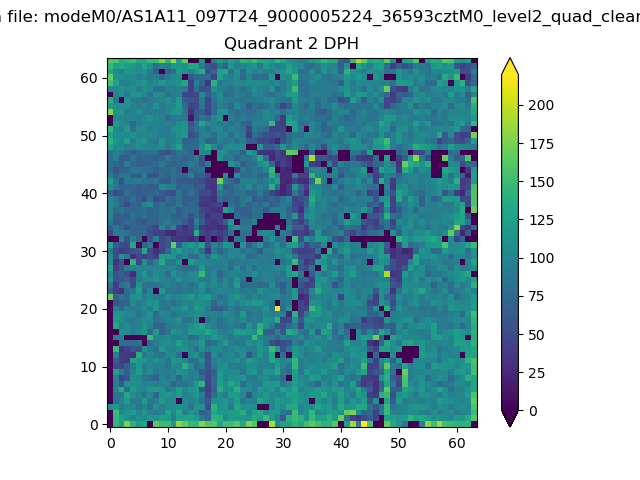
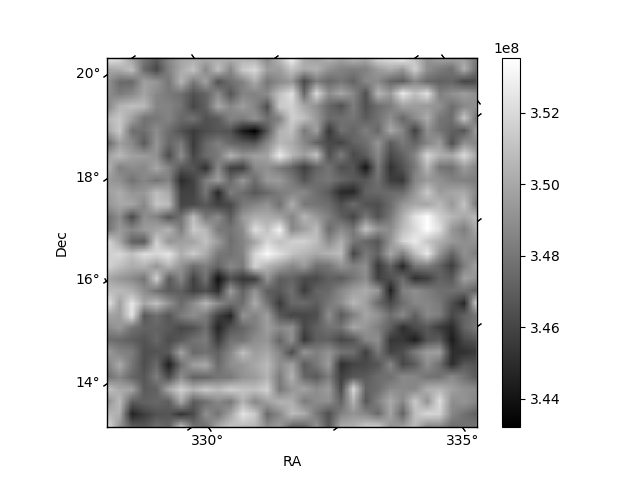
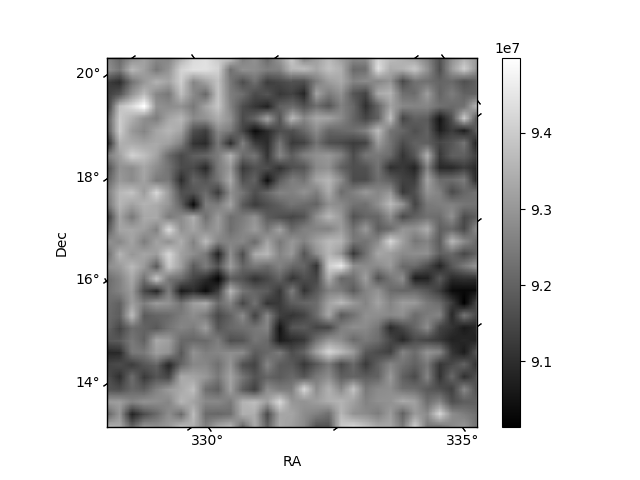
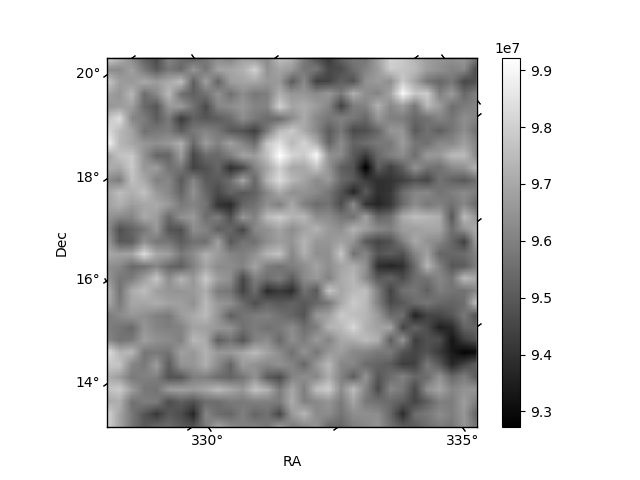
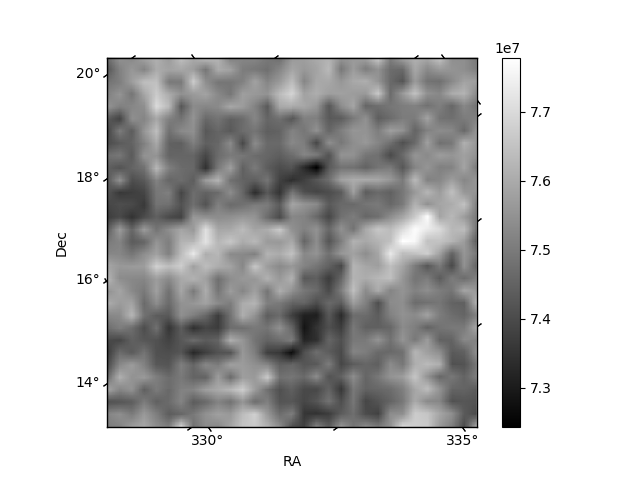
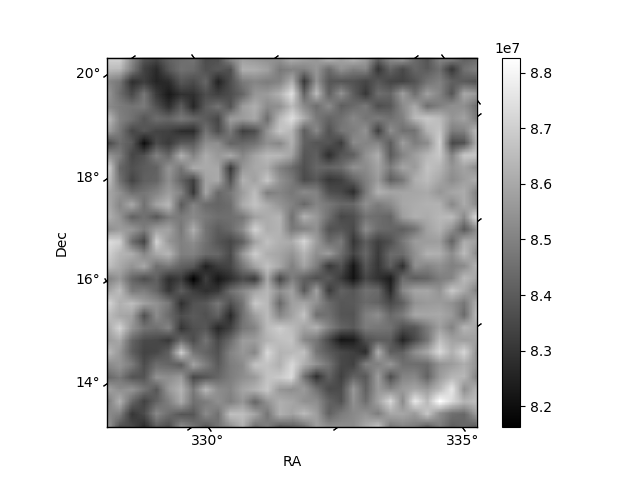
Histogram calculated using DETX and DETY for each event in the final _common_clean file
| Quadrant A | 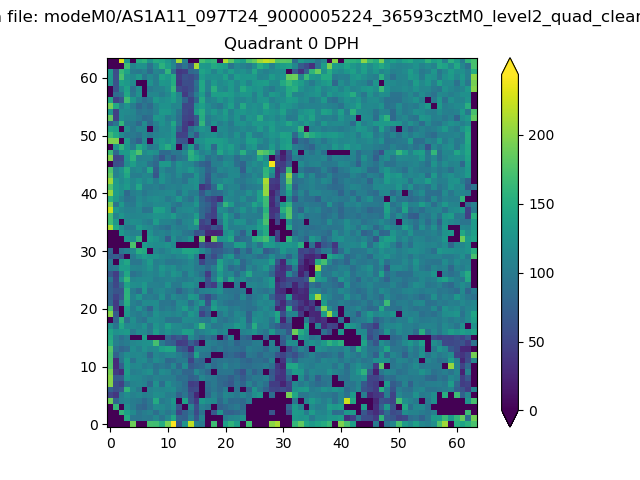 |
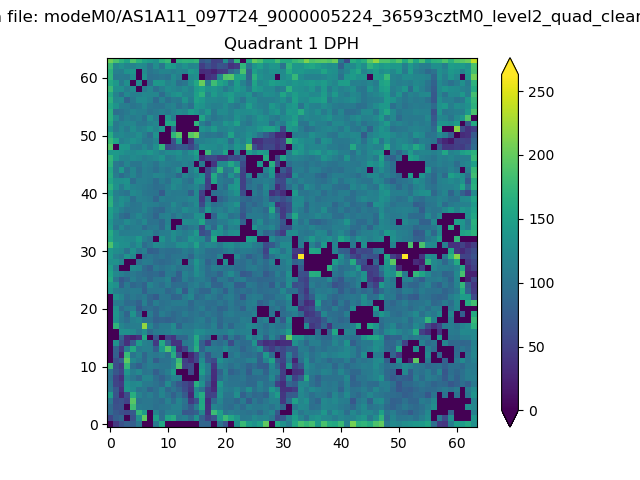 |
Quadrant B |
|---|---|---|---|
| Quadrant D | 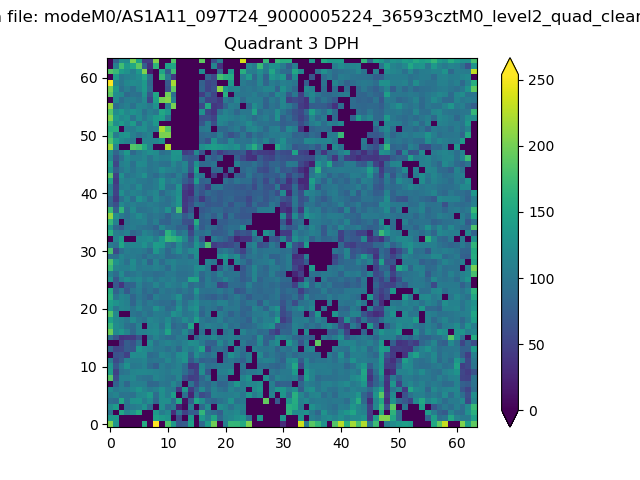 |
 |
Quadrant C |
| Plot type | Count rate plots | Images |
|---|---|---|
| Comparison with Poisson distribution Blue bars denote a histogram of data divided into 1 sec bins. Red curve is a Poisson curve with rate = median count rate of data. |
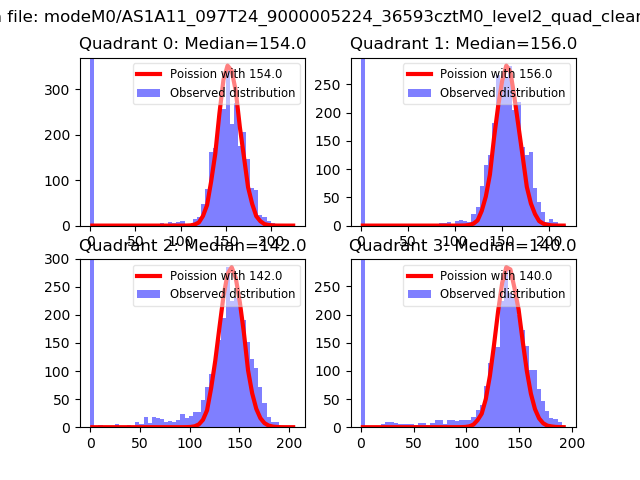 |
 |
| Quadrant-wise count rates Data is divided into 100 sec bins |
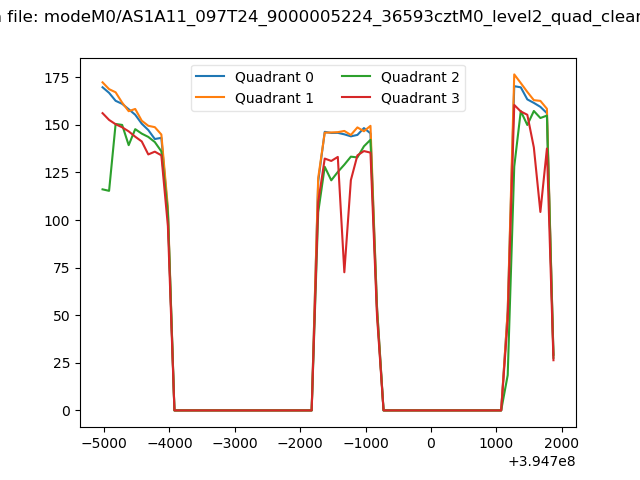 |
|
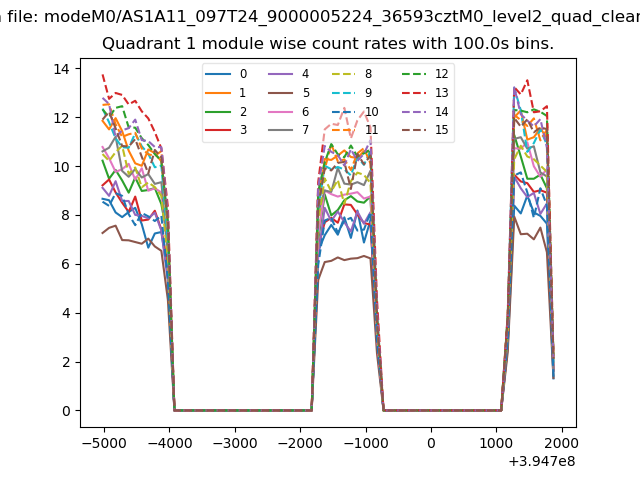
| Module-wise count rates for Quadrant A Data is divided into 100 sec bins |
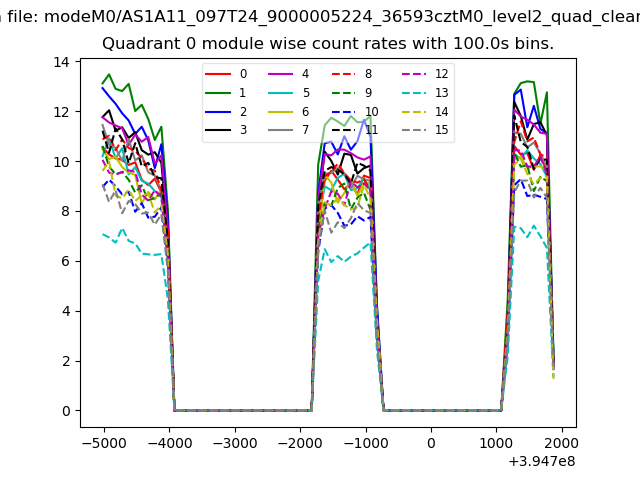 |
 |
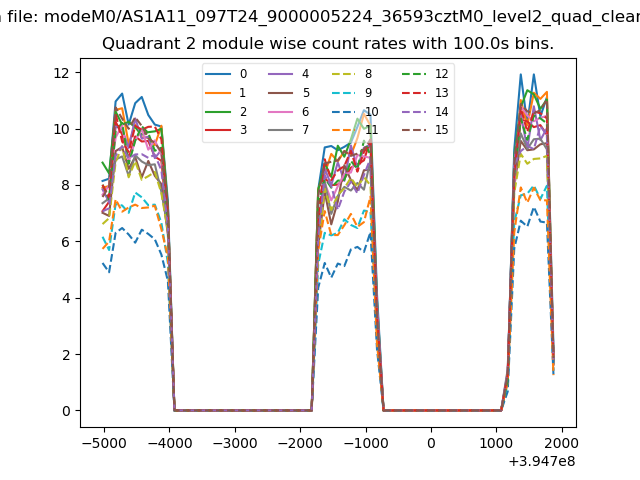
| Module-wise count rates for Quadrant B Data is divided into 100 sec bins |
 |
 |
| Module-wise count rates for Quadrant C Data is divided into 100 sec bins |
 |
 |
| Module-wise count rates for Quadrant D Data is divided into 100 sec bins |
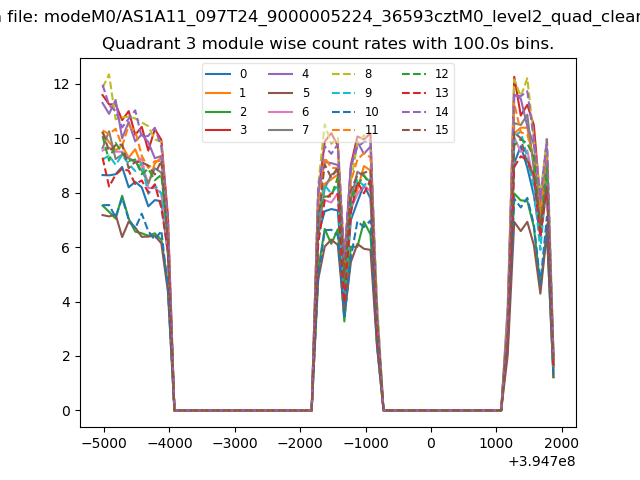 |
 |
| Parameter | Plot |
|---|---|
| CZT HV Monitor | 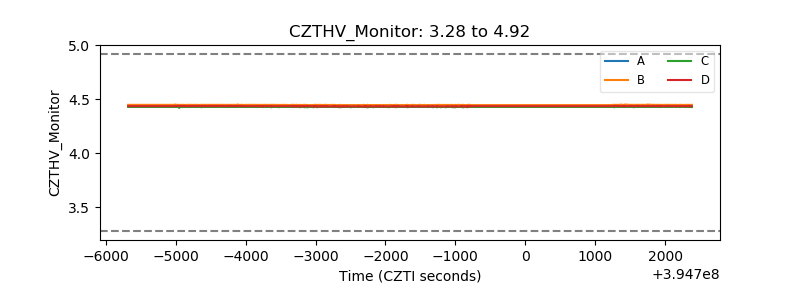 |
| D_VDD | 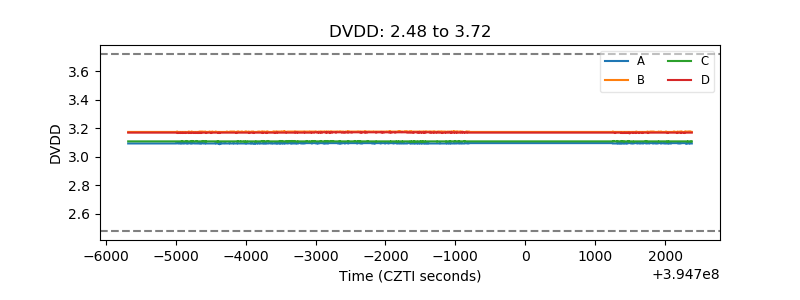 |
| Temperature 1 | 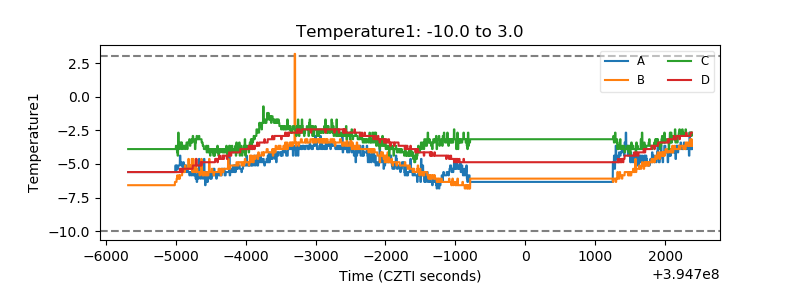 |
| Veto HV Monitor | 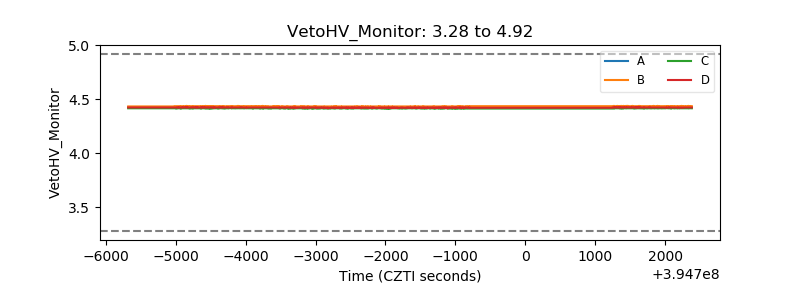 |
| Veto LLD | 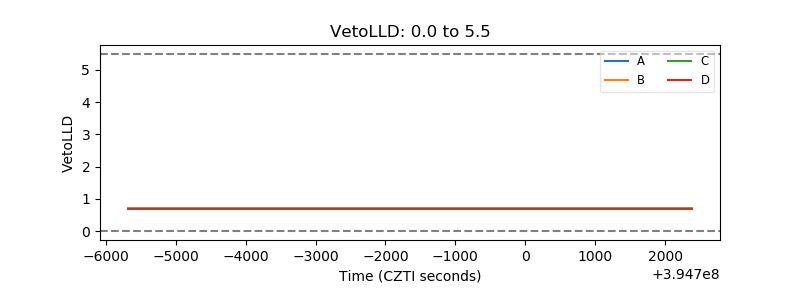 |
| Alpha Counter | 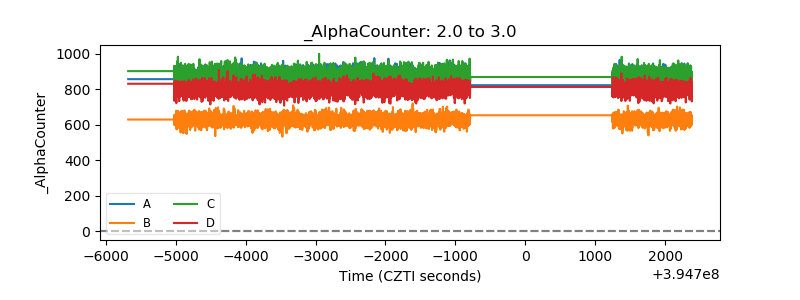 |
| _CPM_Rate | 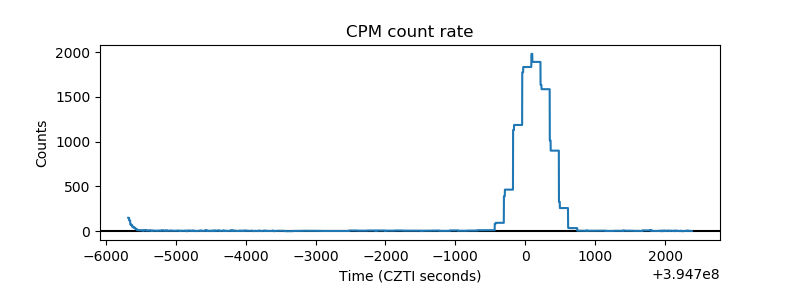 |
| CZT Counter | 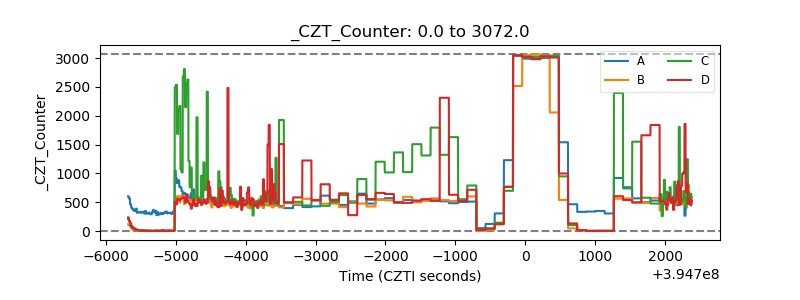 |
| +2.5 Volts monitor |  |
| +5 Volts monitor | 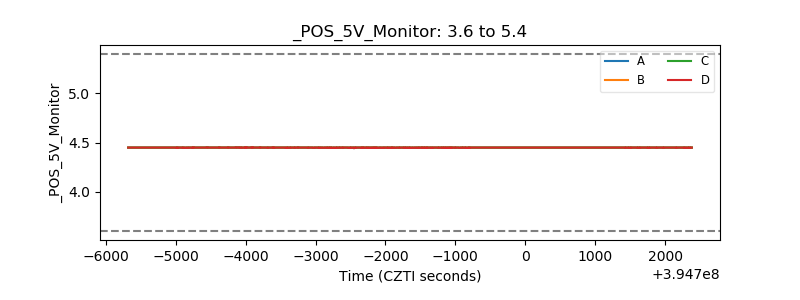 |
| _ROLL_ROT | 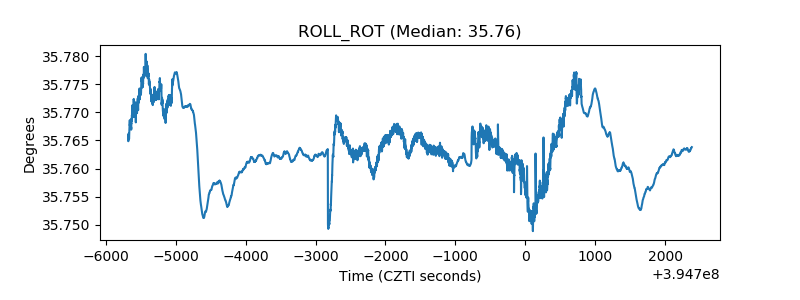 |
| _Roll_DEC |  |
| _Roll_RA | 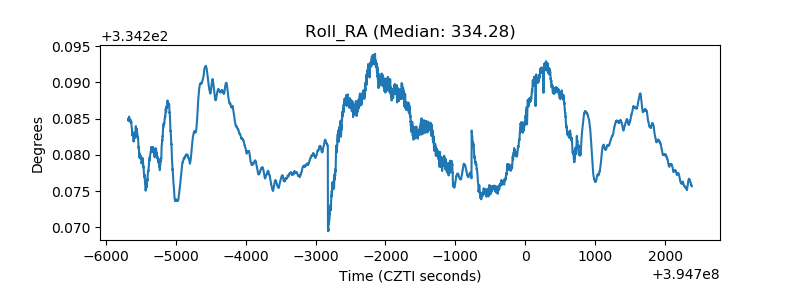 |
| Veto Counter | 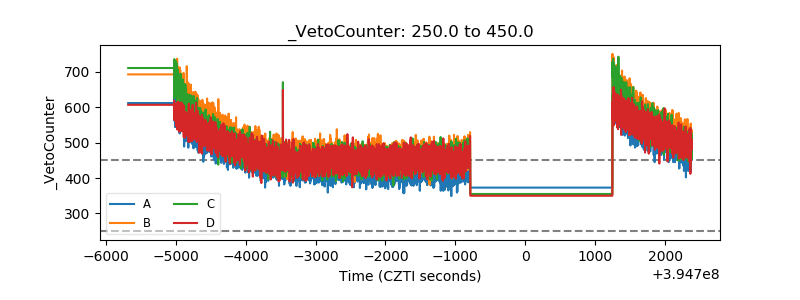 |