| Param | Original file | Final file |
|---|---|---|
| Filename | modeM0/AS1A11_097T24_9000005224_36595cztM0_level2.evt | modeM0/AS1A11_097T24_9000005224_36595cztM0_level2_quad_clean.evt |
| Size (bytes) | 406,203,840 | 46,808,640 |
| Size | 387.4 MB | 44.6 MB |
| Events in quadrant A | 2,788,201 | 276,061 |
| Events in quadrant B | 2,682,130 | 277,400 |
| Events in quadrant C | 3,281,682 | 255,566 |
| Events in quadrant D | 3,207,370 | 254,374 |
| Mode M0 | |||
|---|---|---|---|
| Quadrant | BADHDUFLAG | Total packets | Discarded packets |
| A | 0 | 11085 | 3 |
| B | 0 | 10745 | 2 |
| C | 0 | 12512 | 2 |
| D | 0 | 12584 | 2 |
| Mode M9 | |||
|---|---|---|---|
| Quadrant | BADHDUFLAG | Total packets | Discarded packets |
| A | 0 | 27 | 0 |
| B | 0 | 27 | 0 |
| C | 0 | 27 | 0 |
| D | 0 | 28 | 0 |
| Mode SS | |||
|---|---|---|---|
| Quadrant | BADHDUFLAG | Total packets | Discarded packets |
| A | 0 | 104 | 0 |
| B | 0 | 104 | 0 |
| C | 0 | 104 | 0 |
| D | 0 | 104 | 0 |
| Quadrant | Total seconds | Saturated seconds | Saturation percentage |
|---|---|---|---|
| A | 5036 | 13 | 0.258141% |
| B | 5036 | 10 | 0.198570% |
| C | 5036 | 194 | 3.852264% |
| D | 5036 | 99 | 1.965846% |
Noise dominated data is calculated using 1-second bins in cleaned event files. If a bin has >2000 counts, and if more than 50% of those come from <1% of pixels, then it is considered to be noise-dominated and hence unusable.
| Quadrant | # 1 sec bins | Bins with >0 counts | Bins with >2000 counts | High rate bins dominated by noise | Noise dominated (total time) | Noise dominated (detector-on time) | Marked lightcurve |
|---|---|---|---|---|---|---|---|
| A | 7189 | 5037 | 0 | 0 | 0.00% | 0.00% | 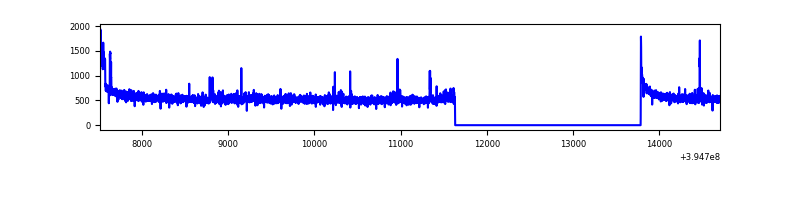 |
| B | 7189 | 5037 | 0 | 0 | 0.00% | 0.00% | 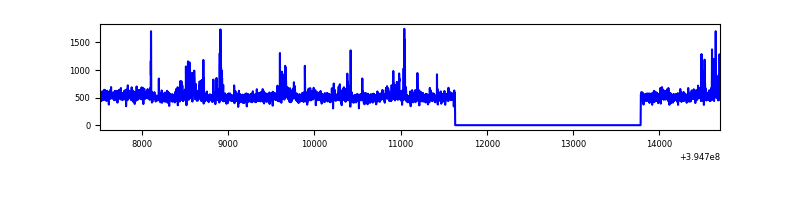 |
| C | 7189 | 5037 | 147 | 147 | 2.04% | 2.92% | 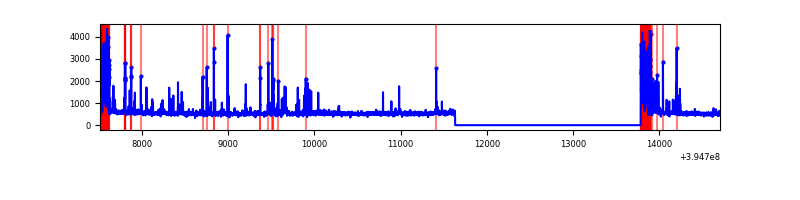 |
| D | 7189 | 5037 | 85 | 85 | 1.18% | 1.69% | 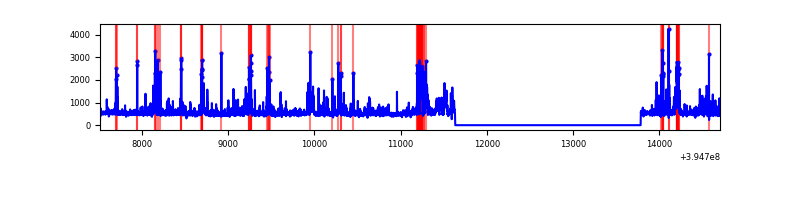 |
Top three noisy pixels from each quadrant. If the there are fewer than three noisy pixels in the level2.evt file, extra rows are filled as -1
| Pixel properties | Quadrant properties | ||||||
|---|---|---|---|---|---|---|---|
| Quadrant | DetID | PixID | Counts | Sigma | Mean | Median | Sigma |
| A | 10 | 83 | 194205 | 1489.1 | 649 | 639 | 130.0 |
| A | 15 | 223 | 52326 | 397.63 | 649 | 639 | 130.0 |
| A | 9 | 143 | 12602 | 92.03 | 649 | 639 | 130.0 |
| B | 0 | 213 | 52485 | 430.4 | 635 | 622 | 120.5 |
| B | 4 | 232 | 28558 | 231.84 | 635 | 622 | 120.5 |
| B | 4 | 171 | 27297 | 221.37 | 635 | 622 | 120.5 |
| C | 0 | 10 | 631929 | 4541.4 | 601 | 607 | 139.0 |
| C | 15 | 214 | 214016 | 1535.15 | 601 | 607 | 139.0 |
| C | 14 | 254 | 66784 | 476.04 | 601 | 607 | 139.0 |
| D | 2 | 153 | 209071 | 1393.17 | 620 | 603 | 149.6 |
| D | 2 | 250 | 199216 | 1327.31 | 620 | 603 | 149.6 |
| D | 2 | 137 | 106358 | 706.75 | 620 | 603 | 149.6 |
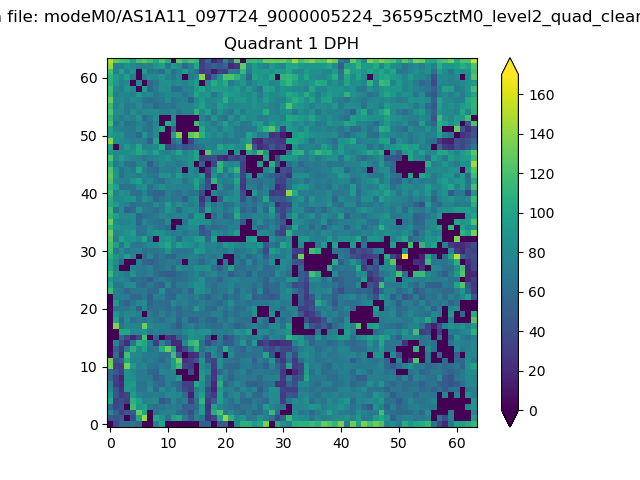
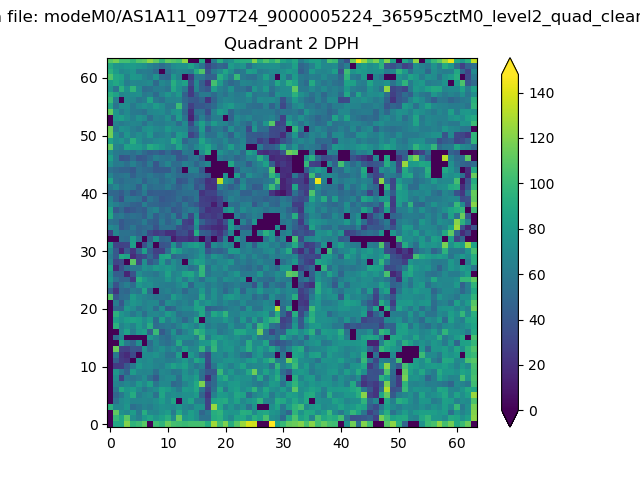
Histogram calculated using DETX and DETY for each event in the final _common_clean file
| Quadrant A |  |
 |
Quadrant B |
|---|---|---|---|
| Quadrant D | 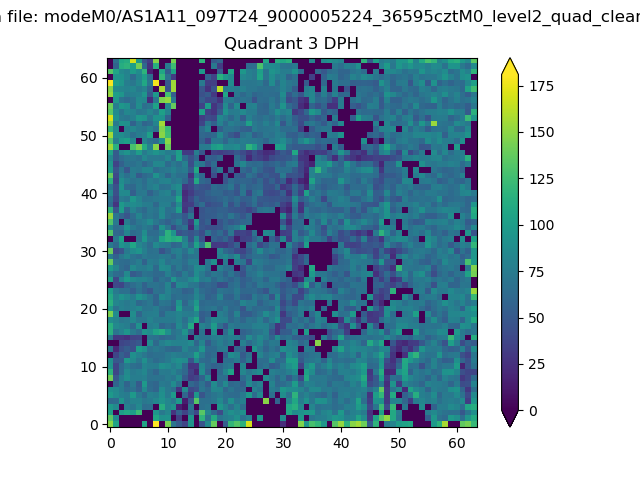 |
 |
Quadrant C |
| Plot type | Count rate plots | Images |
|---|---|---|
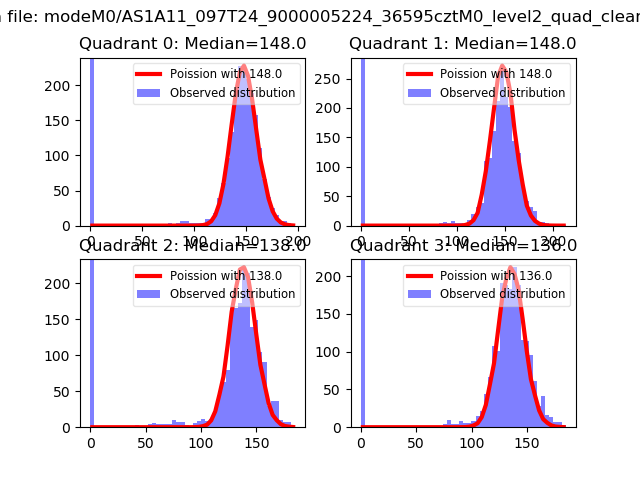
| Comparison with Poisson distribution Blue bars denote a histogram of data divided into 1 sec bins. Red curve is a Poisson curve with rate = median count rate of data. |
 |
 |
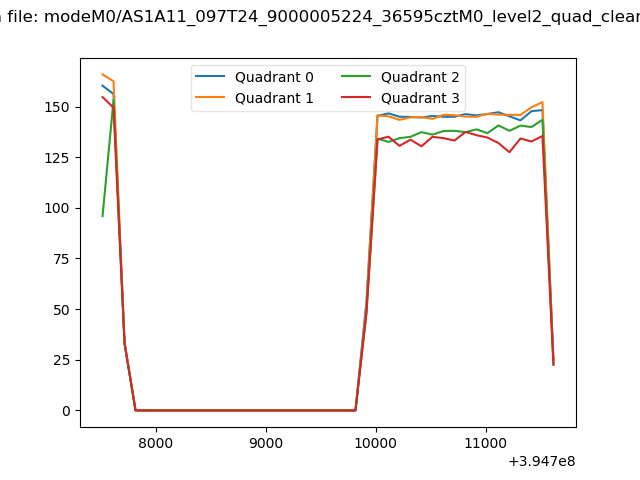
| Quadrant-wise count rates Data is divided into 100 sec bins |
 |
|
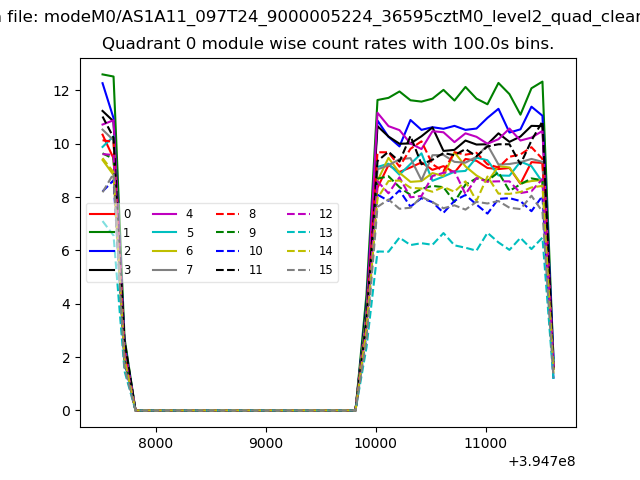
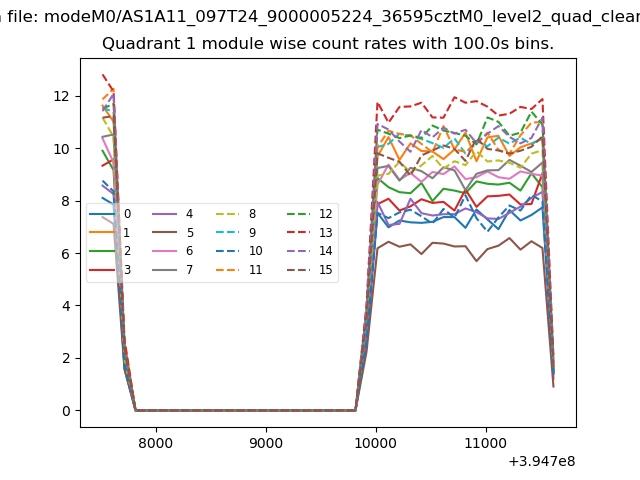
| Module-wise count rates for Quadrant A Data is divided into 100 sec bins |
 |
 |
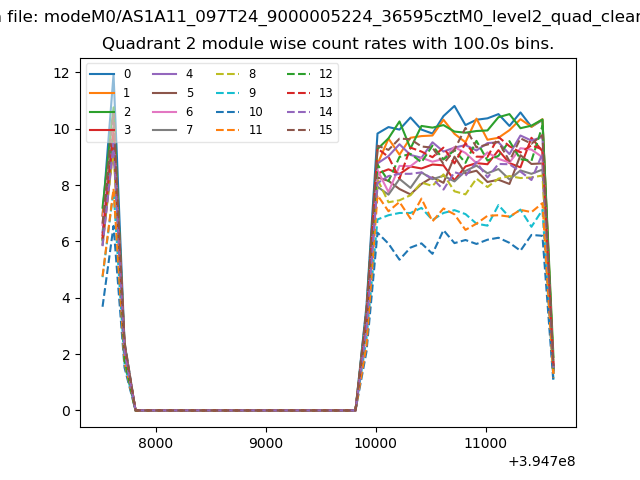
| Module-wise count rates for Quadrant B Data is divided into 100 sec bins |
 |
 |
| Module-wise count rates for Quadrant C Data is divided into 100 sec bins |
 |
 |
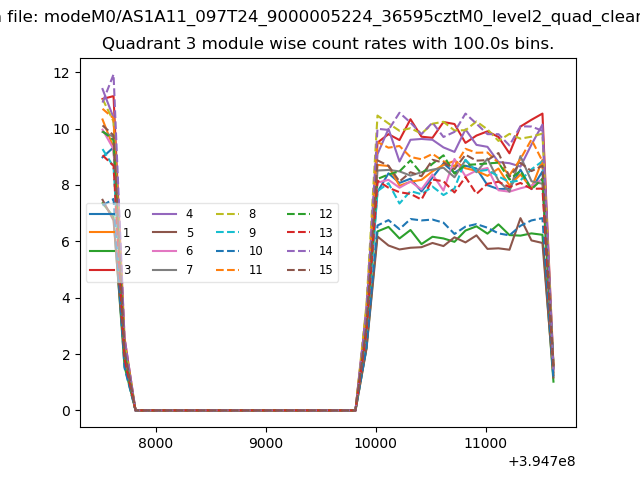
| Module-wise count rates for Quadrant D Data is divided into 100 sec bins |
 |
 |
| Parameter | Plot |
|---|---|
| CZT HV Monitor | 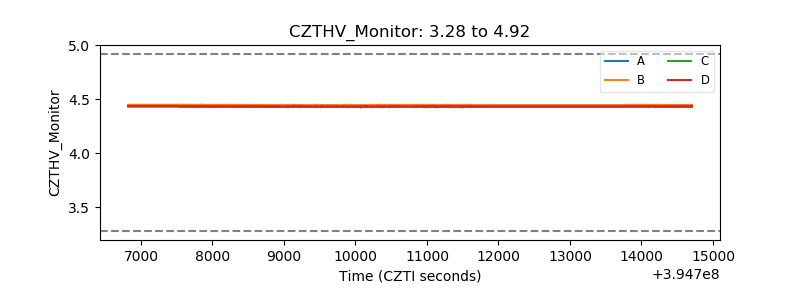 |
| D_VDD | 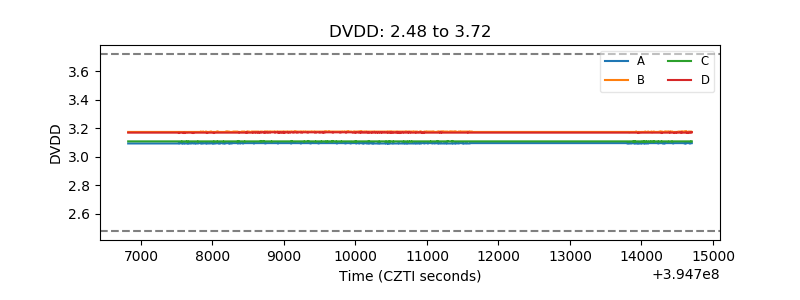 |
| Temperature 1 | 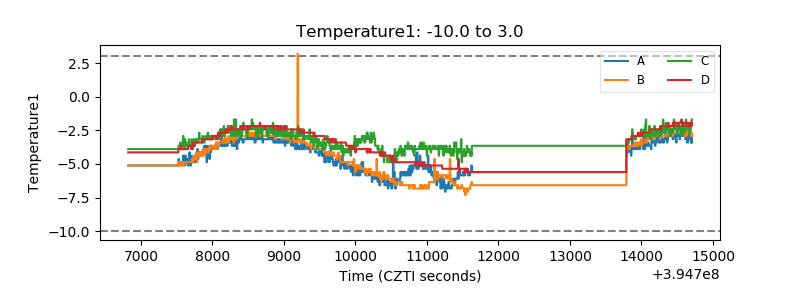 |
| Veto HV Monitor | 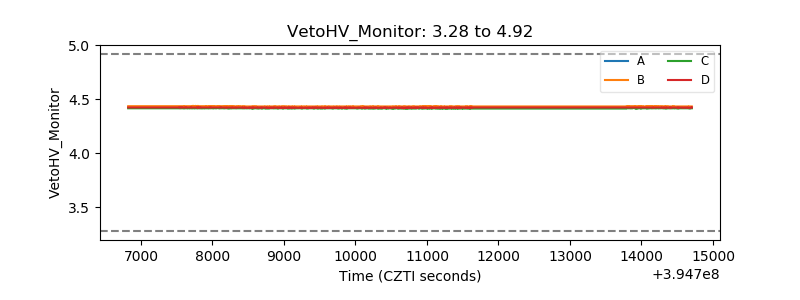 |
| Veto LLD | 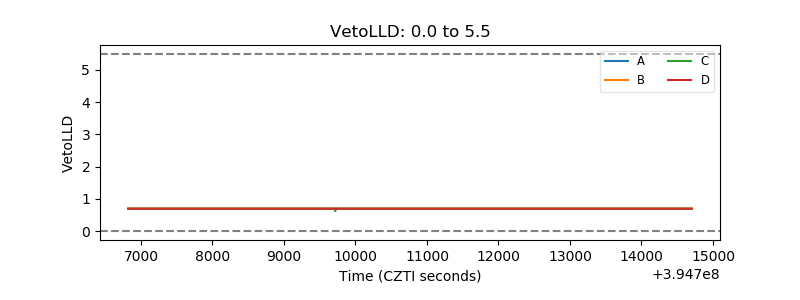 |
| Alpha Counter | 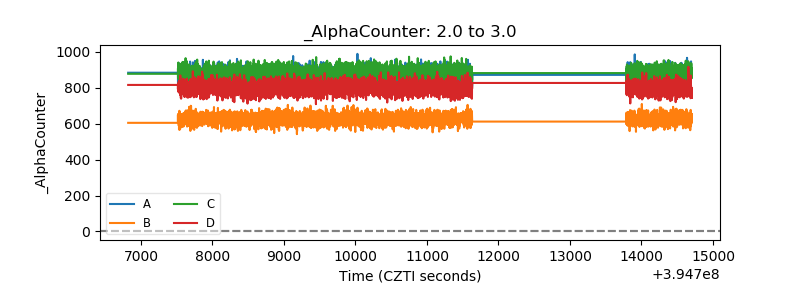 |
| _CPM_Rate | 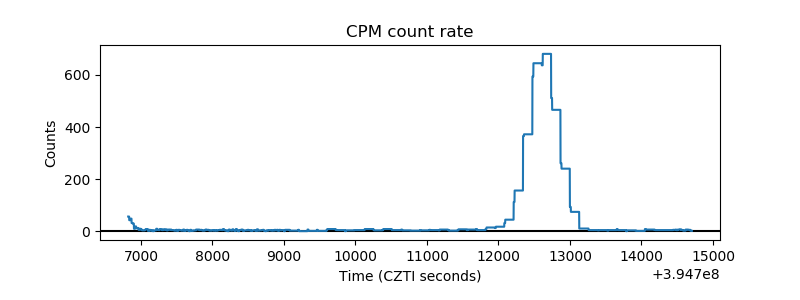 |
| CZT Counter | 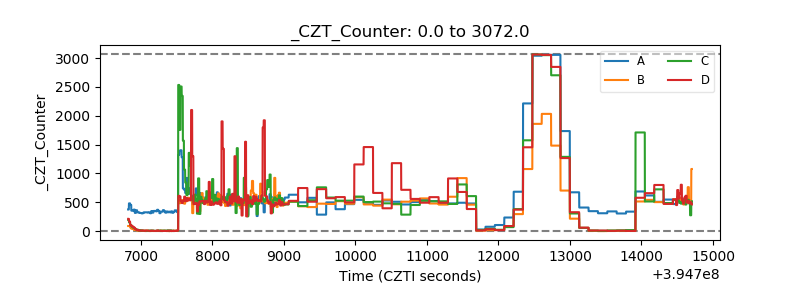 |
| +2.5 Volts monitor |  |
| +5 Volts monitor | 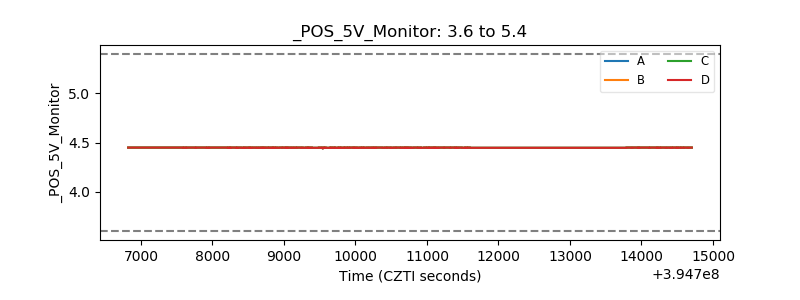 |
| _ROLL_ROT | 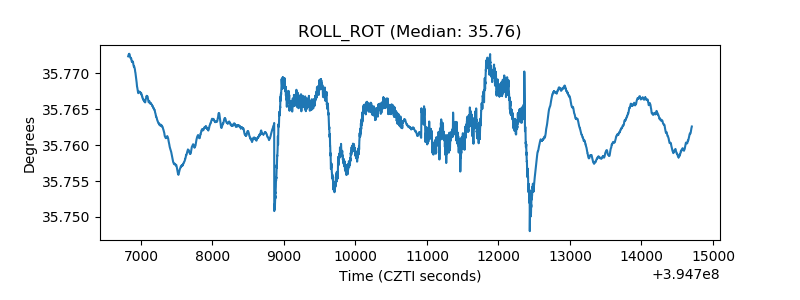 |
| _Roll_DEC | 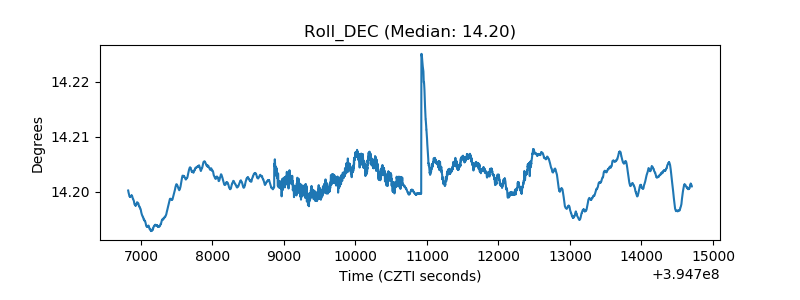 |
| _Roll_RA | 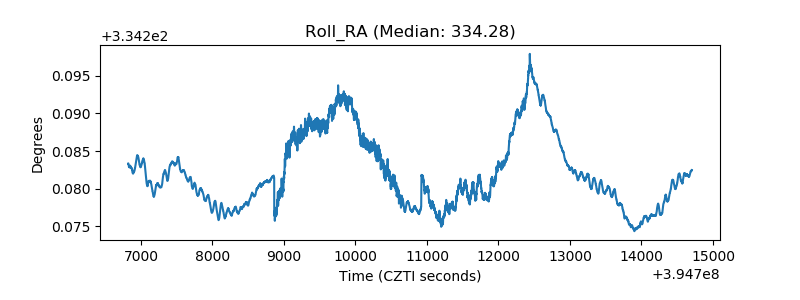 |
| Veto Counter | 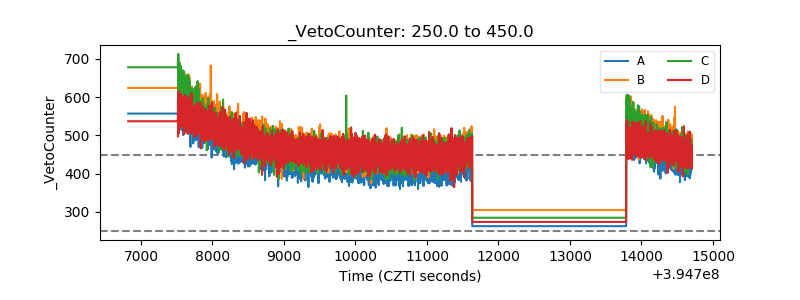 |