| Param | Original file | Final file |
|---|---|---|
| Filename | modeM0/AS1A11_097T24_9000005224_36596cztM0_level2.evt | modeM0/AS1A11_097T24_9000005224_36596cztM0_level2_quad_clean.evt |
| Size (bytes) | 415,270,080 | 49,939,200 |
| Size | 396.0 MB | 47.6 MB |
| Events in quadrant A | 2,797,215 | 298,486 |
| Events in quadrant B | 2,694,770 | 298,044 |
| Events in quadrant C | 3,318,317 | 283,231 |
| Events in quadrant D | 3,416,693 | 271,411 |
| Mode M0 | |||
|---|---|---|---|
| Quadrant | BADHDUFLAG | Total packets | Discarded packets |
| A | 0 | 11279 | 3 |
| B | 0 | 11006 | 2 |
| C | 0 | 12701 | 2 |
| D | 0 | 13510 | 2 |
| Mode M9 | |||
|---|---|---|---|
| Quadrant | BADHDUFLAG | Total packets | Discarded packets |
| A | 0 | 25 | 0 |
| B | 0 | 25 | 0 |
| C | 0 | 25 | 0 |
| D | 0 | 26 | 0 |
| Mode SS | |||
|---|---|---|---|
| Quadrant | BADHDUFLAG | Total packets | Discarded packets |
| A | 0 | 104 | 0 |
| B | 0 | 104 | 0 |
| C | 0 | 104 | 0 |
| D | 0 | 104 | 0 |
| Quadrant | Total seconds | Saturated seconds | Saturation percentage |
|---|---|---|---|
| A | 5147 | 47 | 0.913153% |
| B | 5147 | 28 | 0.544006% |
| C | 5147 | 232 | 4.507480% |
| D | 5147 | 115 | 2.234311% |
Noise dominated data is calculated using 1-second bins in cleaned event files. If a bin has >2000 counts, and if more than 50% of those come from <1% of pixels, then it is considered to be noise-dominated and hence unusable.
| Quadrant | # 1 sec bins | Bins with >0 counts | Bins with >2000 counts | High rate bins dominated by noise | Noise dominated (total time) | Noise dominated (detector-on time) | Marked lightcurve |
|---|---|---|---|---|---|---|---|
| A | 7210 | 5148 | 31 | 31 | 0.43% | 0.60% | 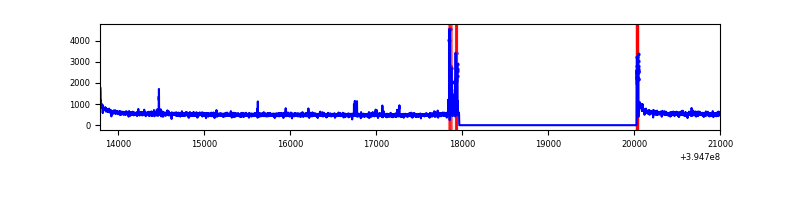 |
| B | 7210 | 5148 | 8 | 8 | 0.11% | 0.16% | 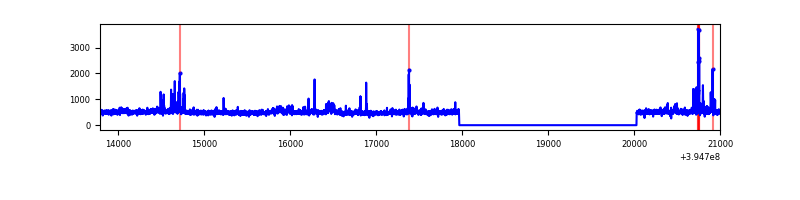 |
| C | 7210 | 5148 | 174 | 174 | 2.41% | 3.38% | 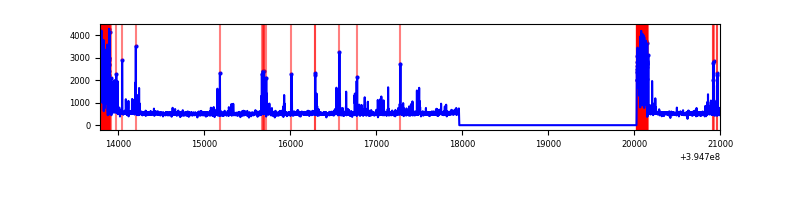 |
| D | 7210 | 5148 | 87 | 87 | 1.21% | 1.69% | 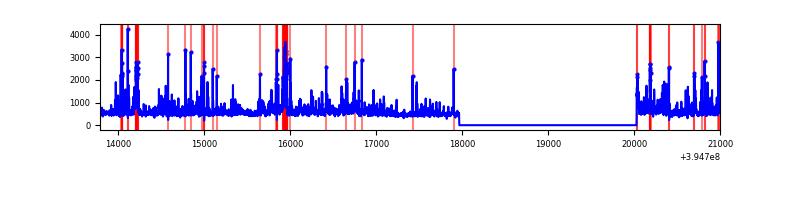 |
Top three noisy pixels from each quadrant. If the there are fewer than three noisy pixels in the level2.evt file, extra rows are filled as -1
| Pixel properties | Quadrant properties | ||||||
|---|---|---|---|---|---|---|---|
| Quadrant | DetID | PixID | Counts | Sigma | Mean | Median | Sigma |
| A | 10 | 83 | 191584 | 1500.9 | 633 | 623 | 127.2 |
| A | 15 | 223 | 141112 | 1104.21 | 633 | 623 | 127.2 |
| A | 9 | 143 | 12307 | 91.83 | 633 | 623 | 127.2 |
| B | 15 | 85 | 79582 | 658.43 | 625 | 609 | 119.9 |
| B | 0 | 190 | 54232 | 447.08 | 625 | 609 | 119.9 |
| B | 5 | 255 | 37884 | 310.78 | 625 | 609 | 119.9 |
| C | 0 | 10 | 697321 | 5051.45 | 594 | 599 | 137.9 |
| C | 15 | 214 | 217884 | 1575.38 | 594 | 599 | 137.9 |
| C | 0 | 207 | 66137 | 475.17 | 594 | 599 | 137.9 |
| D | 2 | 153 | 173507 | 1174.94 | 606 | 590 | 147.2 |
| D | 2 | 250 | 165861 | 1122.98 | 606 | 590 | 147.2 |
| D | 7 | 223 | 146704 | 992.82 | 606 | 590 | 147.2 |
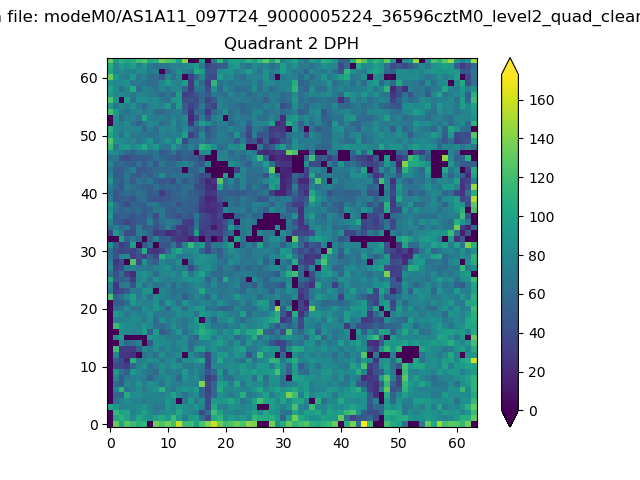
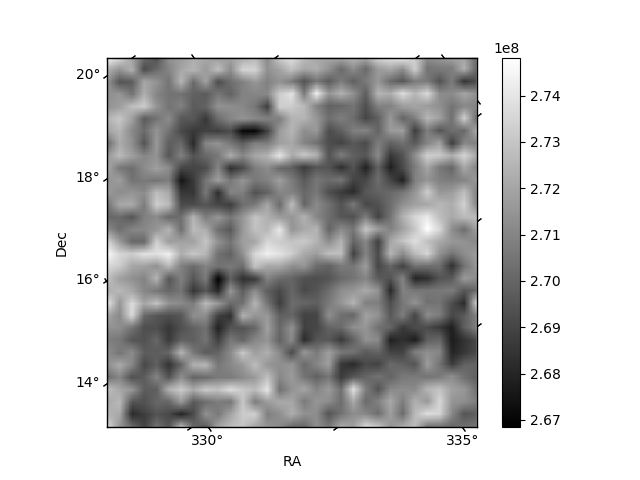
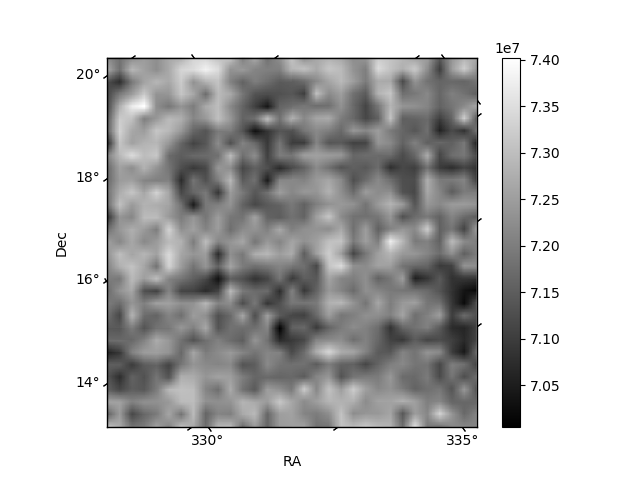
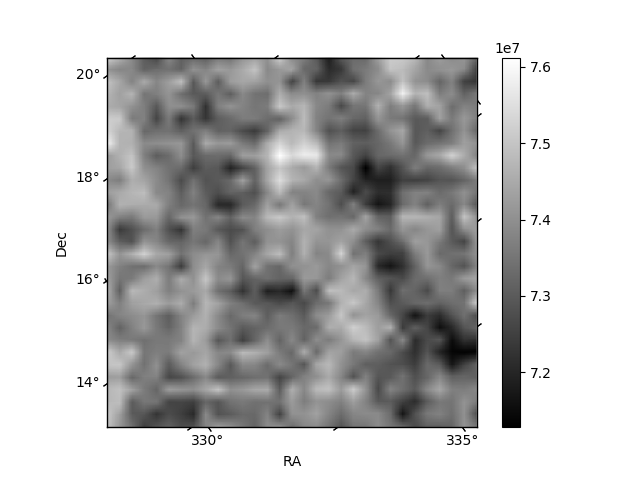
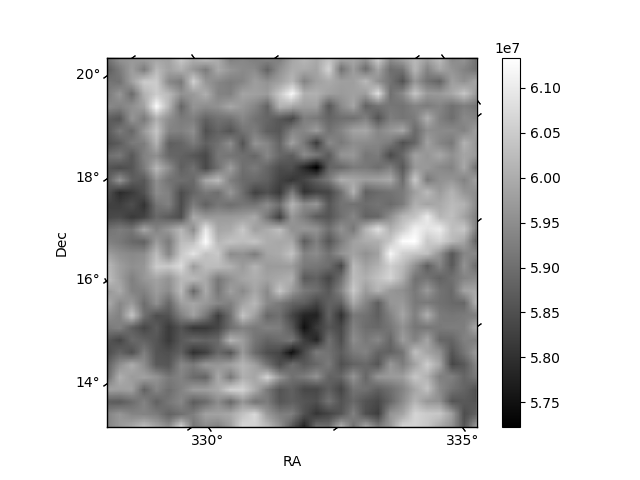
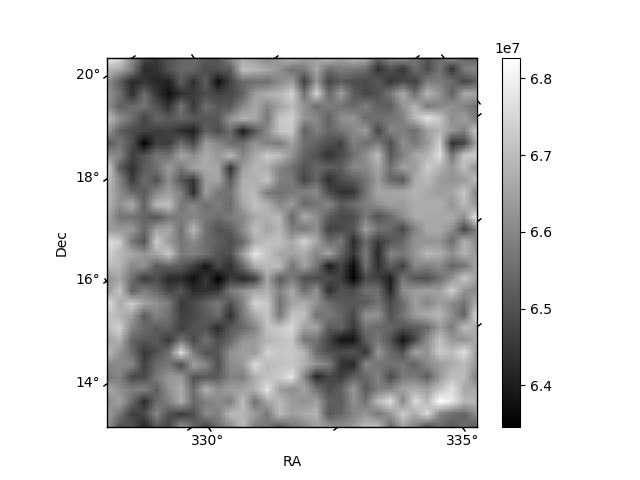
Histogram calculated using DETX and DETY for each event in the final _common_clean file
| Quadrant A | 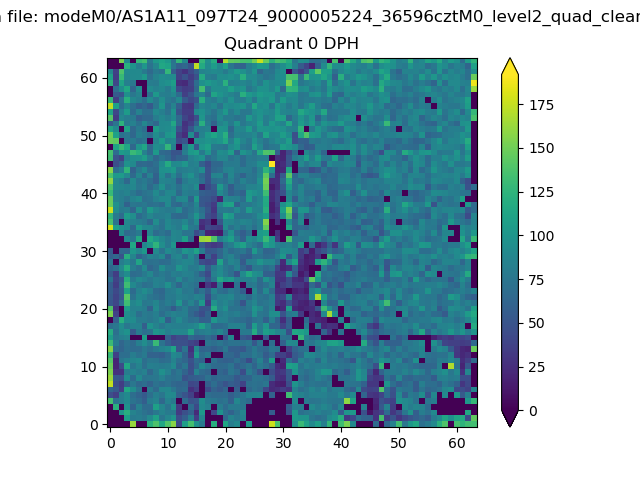 |
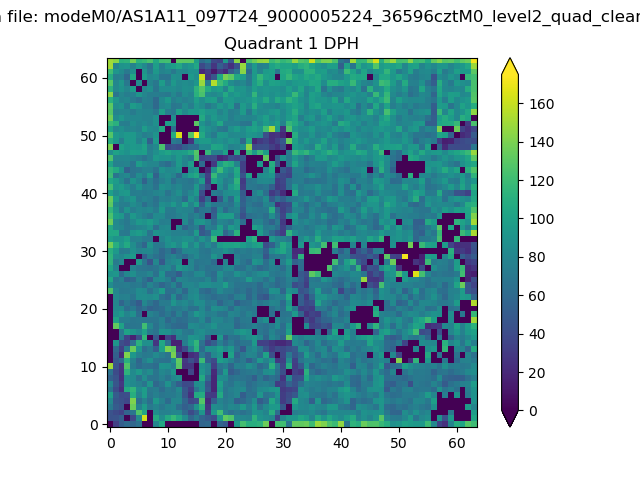 |
Quadrant B |
|---|---|---|---|
| Quadrant D | 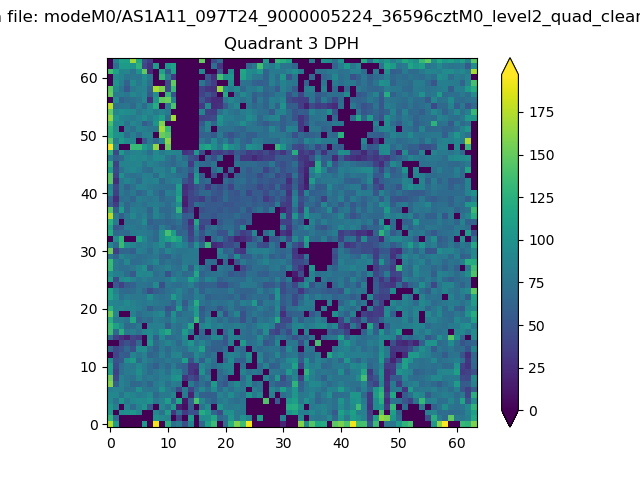 |
 |
Quadrant C |
| Plot type | Count rate plots | Images |
|---|---|---|
| Comparison with Poisson distribution Blue bars denote a histogram of data divided into 1 sec bins. Red curve is a Poisson curve with rate = median count rate of data. |
 |
 |
| Quadrant-wise count rates Data is divided into 100 sec bins |
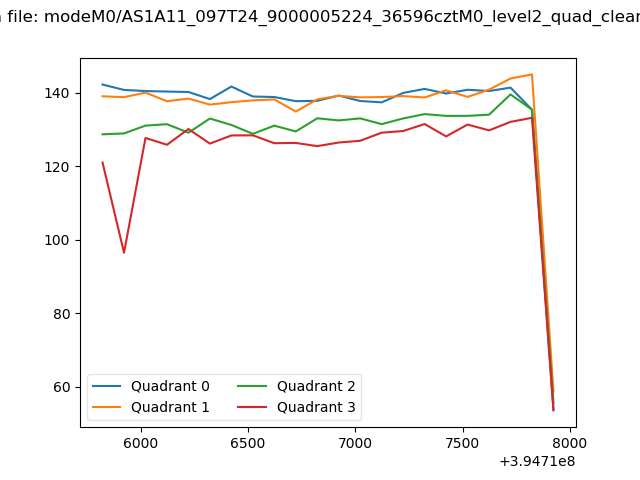 |
|
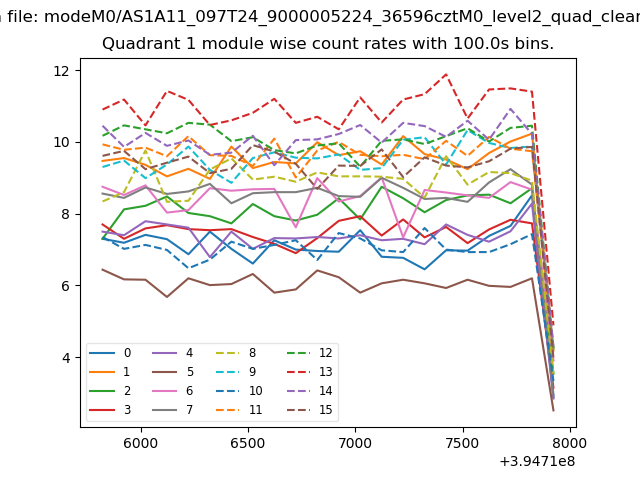
| Module-wise count rates for Quadrant A Data is divided into 100 sec bins |
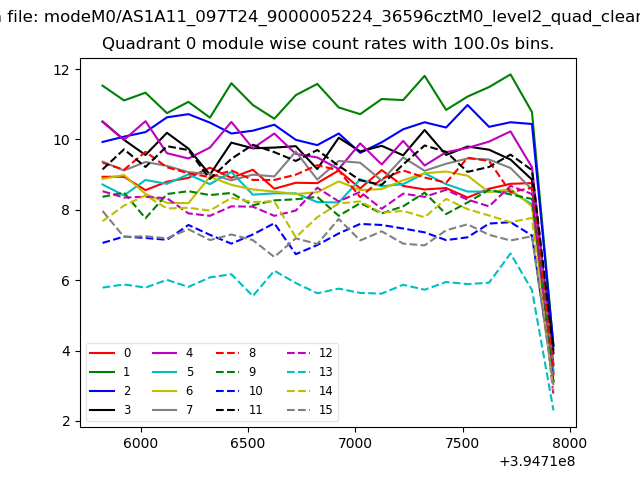 |
 |
| Module-wise count rates for Quadrant B Data is divided into 100 sec bins |
 |
 |
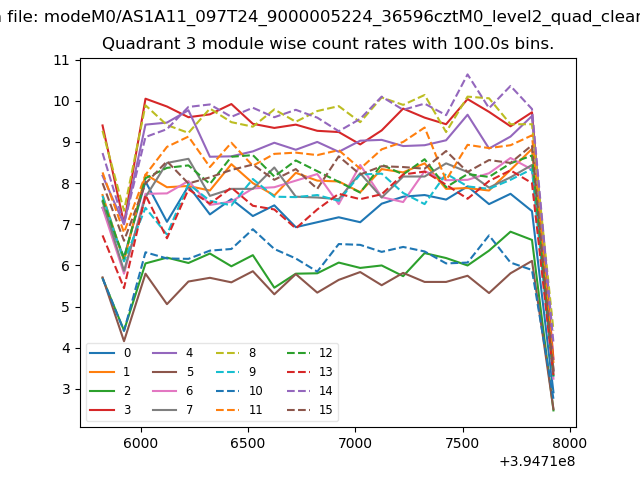
| Module-wise count rates for Quadrant C Data is divided into 100 sec bins |
 |
 |
| Module-wise count rates for Quadrant D Data is divided into 100 sec bins |
 |
 |
| Parameter | Plot |
|---|---|
| CZT HV Monitor | 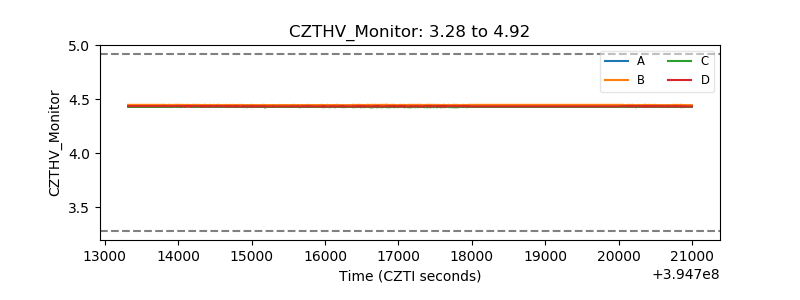 |
| D_VDD | 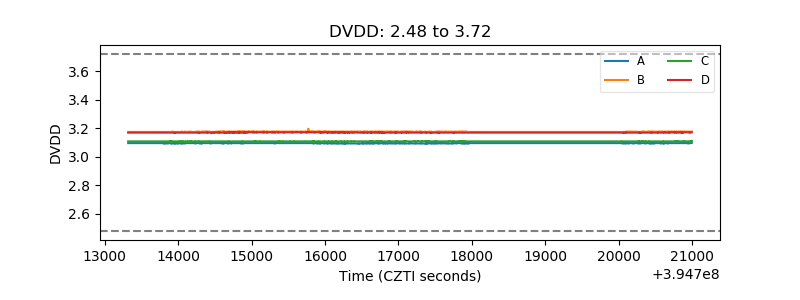 |
| Temperature 1 | 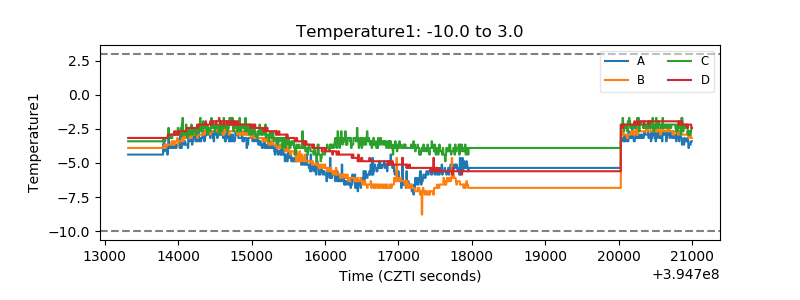 |
| Veto HV Monitor | 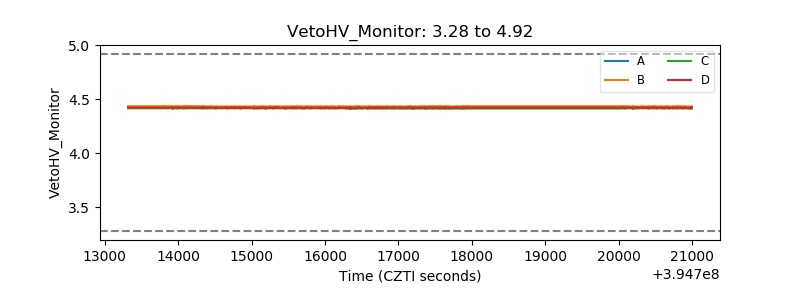 |
| Veto LLD | 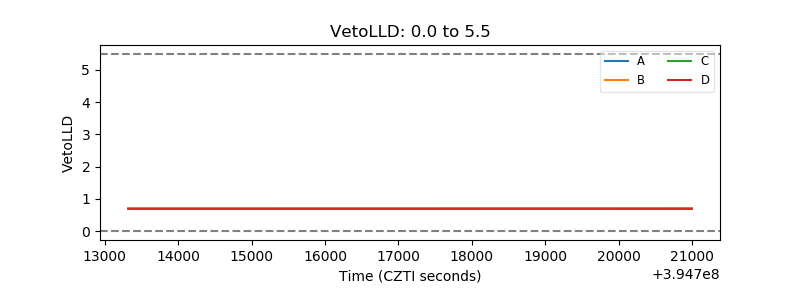 |
| Alpha Counter | 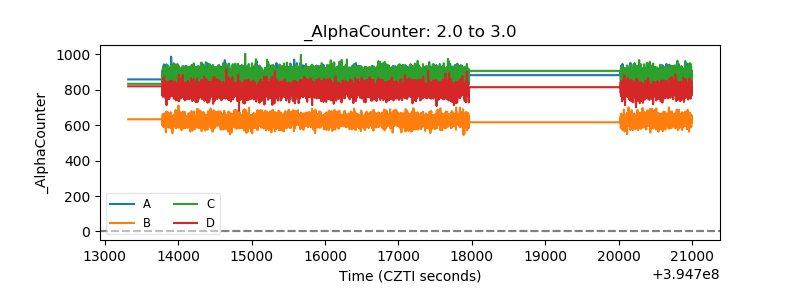 |
| _CPM_Rate | 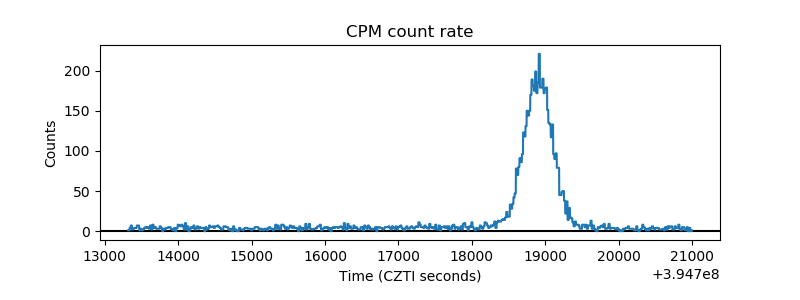 |
| CZT Counter | 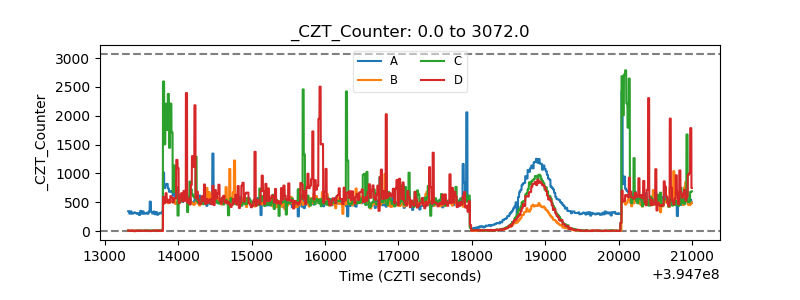 |
| +2.5 Volts monitor | 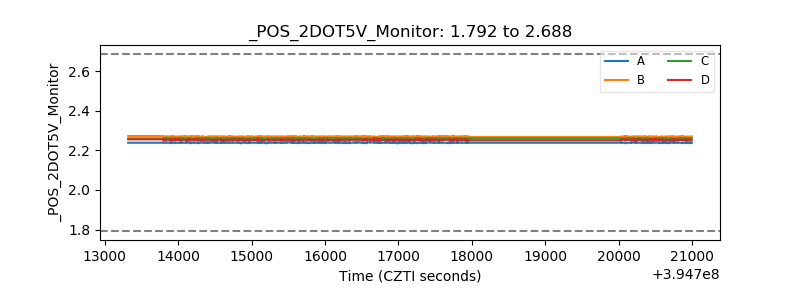 |
| +5 Volts monitor |  |
| _ROLL_ROT | 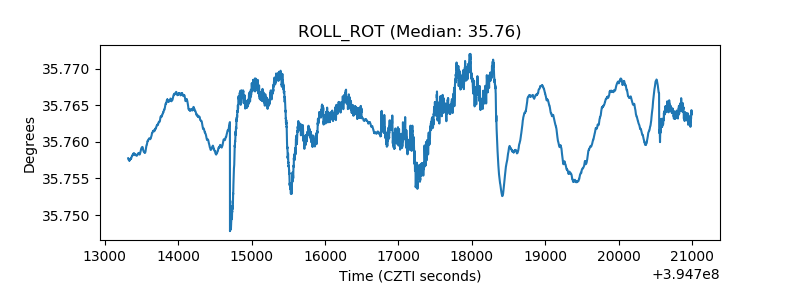 |
| _Roll_DEC | 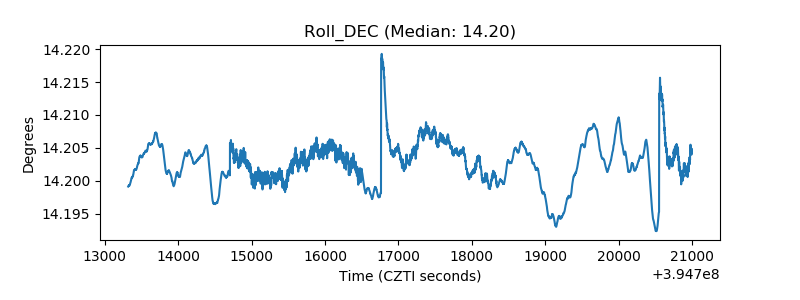 |
| _Roll_RA | 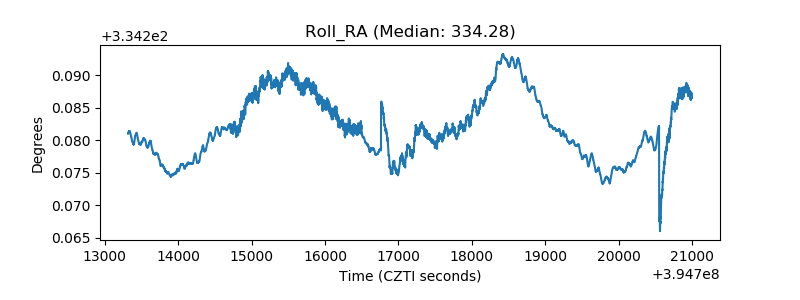 |
| Veto Counter | 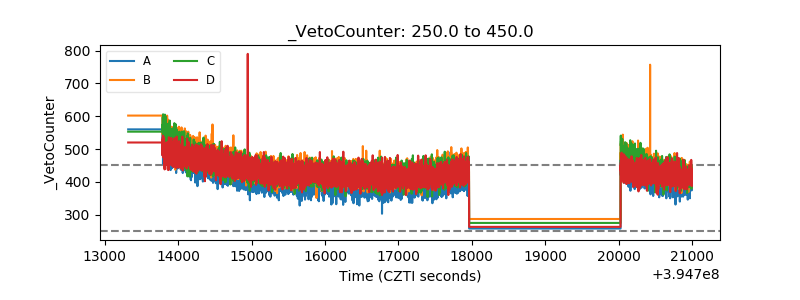 |