| Param | Original file | Final file |
|---|---|---|
| Filename | modeM0/AS1A11_097T24_9000005224_36597cztM0_level2.evt | modeM0/AS1A11_097T24_9000005224_36597cztM0_level2_quad_clean.evt |
| Size (bytes) | 423,789,120 | 60,505,920 |
| Size | 404.2 MB | 57.7 MB |
| Events in quadrant A | 2,789,888 | 378,483 |
| Events in quadrant B | 2,668,934 | 378,510 |
| Events in quadrant C | 3,544,624 | 358,508 |
| Events in quadrant D | 3,472,650 | 347,168 |
| Mode M0 | |||
|---|---|---|---|
| Quadrant | BADHDUFLAG | Total packets | Discarded packets |
| A | 0 | 11463 | 3 |
| B | 0 | 11152 | 2 |
| C | 0 | 13568 | 2 |
| D | 0 | 13814 | 2 |
| Mode M9 | |||
|---|---|---|---|
| Quadrant | BADHDUFLAG | Total packets | Discarded packets |
| A | 0 | 29 | 0 |
| B | 0 | 29 | 0 |
| C | 0 | 29 | 0 |
| D | 0 | 30 | 0 |
| Mode SS | |||
|---|---|---|---|
| Quadrant | BADHDUFLAG | Total packets | Discarded packets |
| A | 0 | 106 | 0 |
| B | 0 | 106 | 0 |
| C | 0 | 106 | 0 |
| D | 0 | 106 | 0 |
| Quadrant | Total seconds | Saturated seconds | Saturation percentage |
|---|---|---|---|
| A | 5277 | 32 | 0.606405% |
| B | 5277 | 26 | 0.492704% |
| C | 5277 | 336 | 6.367254% |
| D | 5277 | 146 | 2.766724% |
Noise dominated data is calculated using 1-second bins in cleaned event files. If a bin has >2000 counts, and if more than 50% of those come from <1% of pixels, then it is considered to be noise-dominated and hence unusable.
| Quadrant | # 1 sec bins | Bins with >0 counts | Bins with >2000 counts | High rate bins dominated by noise | Noise dominated (total time) | Noise dominated (detector-on time) | Marked lightcurve |
|---|---|---|---|---|---|---|---|
| A | 7070 | 5278 | 21 | 21 | 0.30% | 0.40% | 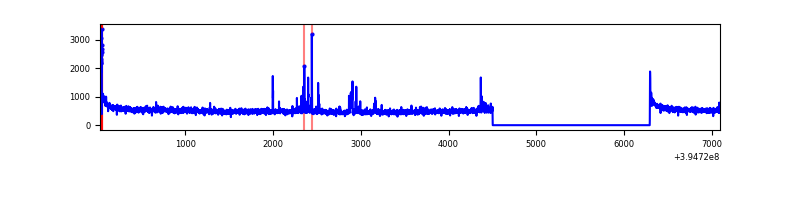 |
| B | 7070 | 5278 | 7 | 7 | 0.10% | 0.13% | 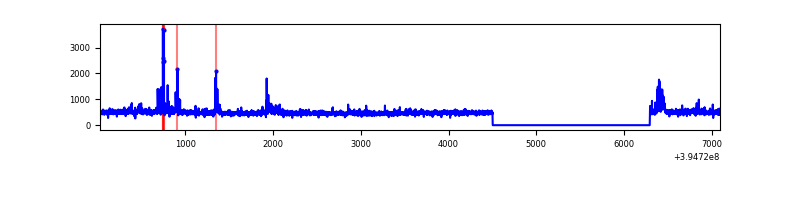 |
| C | 7070 | 5278 | 263 | 263 | 3.72% | 4.98% | 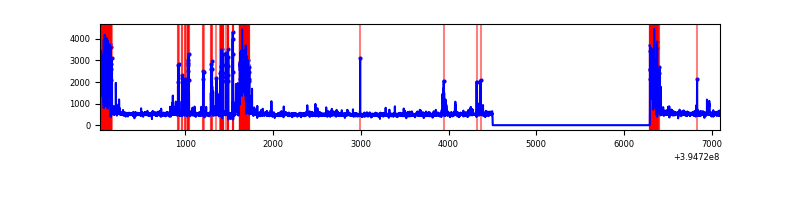 |
| D | 7070 | 5278 | 117 | 117 | 1.65% | 2.22% | 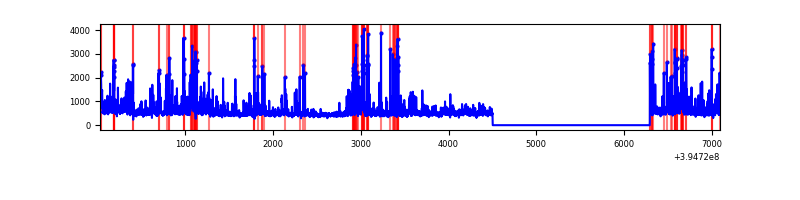 |
Top three noisy pixels from each quadrant. If the there are fewer than three noisy pixels in the level2.evt file, extra rows are filled as -1
| Pixel properties | Quadrant properties | ||||||
|---|---|---|---|---|---|---|---|
| Quadrant | DetID | PixID | Counts | Sigma | Mean | Median | Sigma |
| A | 10 | 83 | 196194 | 1552.0 | 629 | 618 | 126.0 |
| A | 15 | 223 | 136559 | 1078.76 | 629 | 618 | 126.0 |
| A | 9 | 143 | 18602 | 142.71 | 629 | 618 | 126.0 |
| B | 4 | 232 | 60746 | 504.26 | 621 | 605 | 119.3 |
| B | 15 | 85 | 53852 | 446.46 | 621 | 605 | 119.3 |
| B | 5 | 255 | 36124 | 297.81 | 621 | 605 | 119.3 |
| C | 0 | 207 | 501087 | 3670.15 | 585 | 590 | 136.4 |
| C | 0 | 10 | 494205 | 3619.68 | 585 | 590 | 136.4 |
| C | 15 | 214 | 221205 | 1617.77 | 585 | 590 | 136.4 |
| D | 13 | 171 | 287299 | 1940.91 | 602 | 586 | 147.7 |
| D | 10 | 199 | 213885 | 1443.93 | 602 | 586 | 147.7 |
| D | 13 | 249 | 199104 | 1343.87 | 602 | 586 | 147.7 |
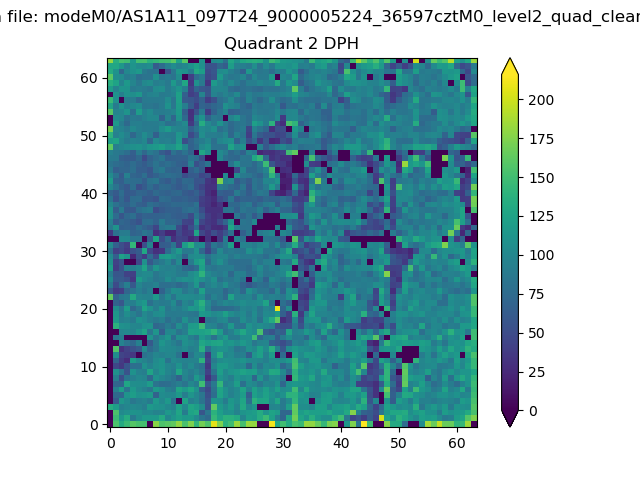
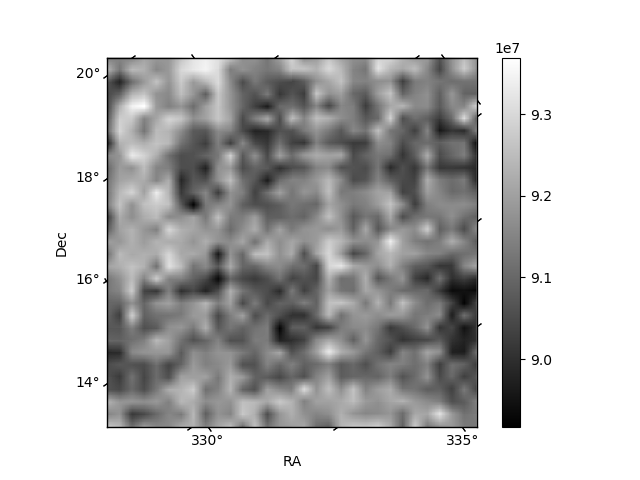
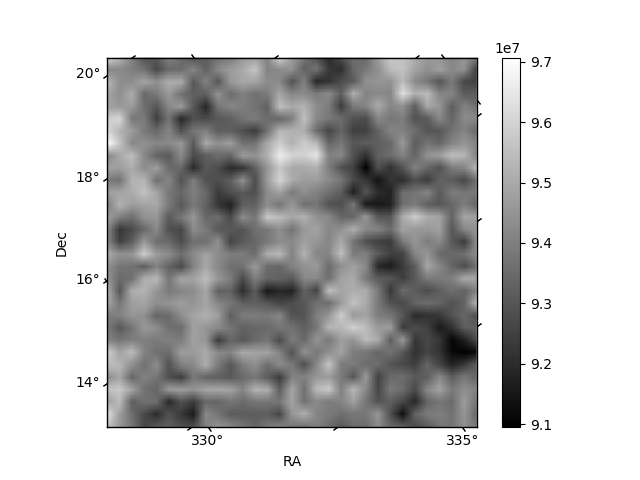
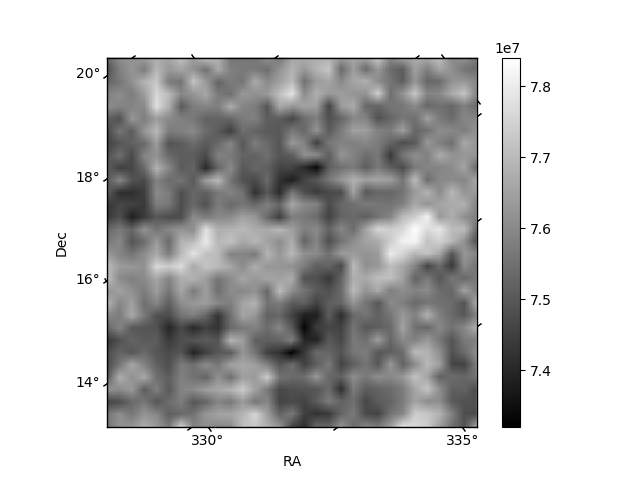
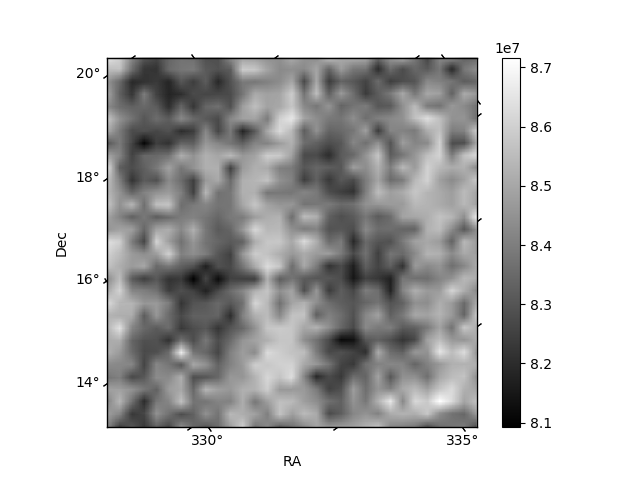
Histogram calculated using DETX and DETY for each event in the final _common_clean file
| Quadrant A | 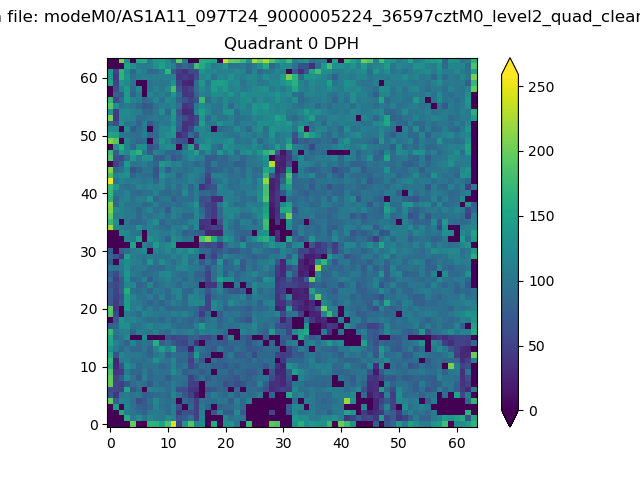 |
 |
Quadrant B |
|---|---|---|---|
| Quadrant D |  |
 |
Quadrant C |
| Plot type | Count rate plots | Images |
|---|---|---|
| Comparison with Poisson distribution Blue bars denote a histogram of data divided into 1 sec bins. Red curve is a Poisson curve with rate = median count rate of data. |
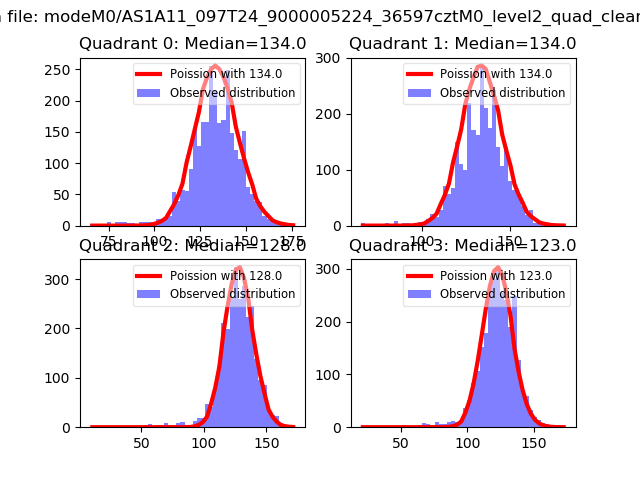 |
 |
| Quadrant-wise count rates Data is divided into 100 sec bins |
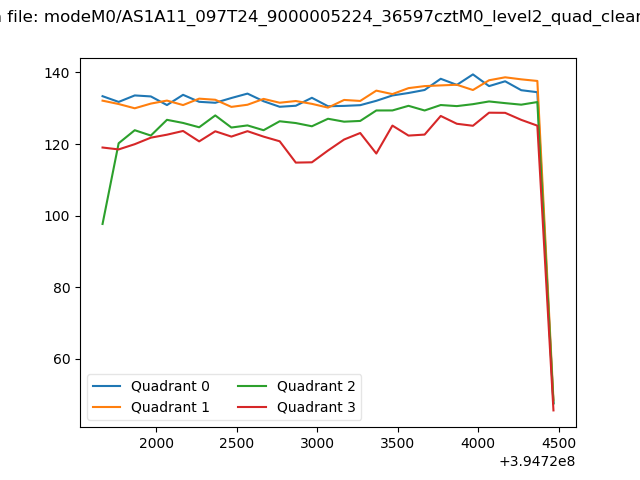 |
|
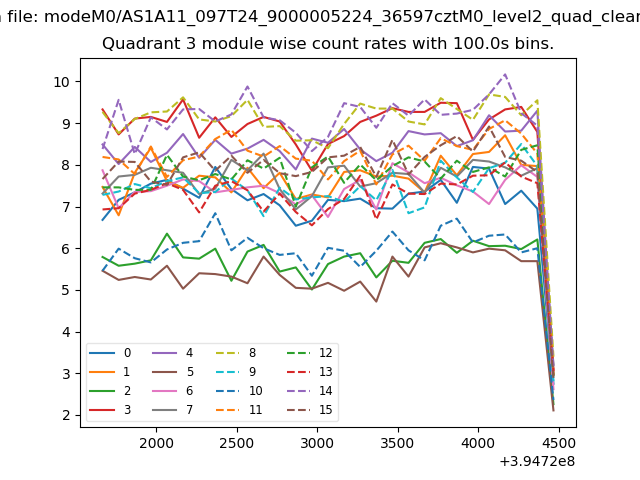
| Module-wise count rates for Quadrant A Data is divided into 100 sec bins |
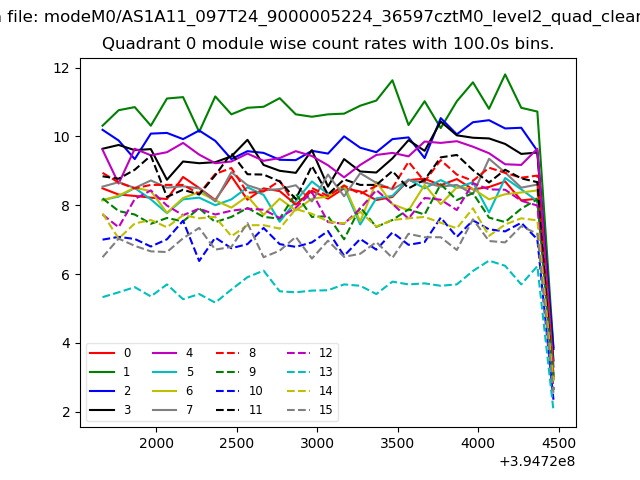 |
 |
| Module-wise count rates for Quadrant B Data is divided into 100 sec bins |
 |
 |
| Module-wise count rates for Quadrant C Data is divided into 100 sec bins |
 |
 |
| Module-wise count rates for Quadrant D Data is divided into 100 sec bins |
 |
 |
| Parameter | Plot |
|---|---|
| CZT HV Monitor |  |
| D_VDD | 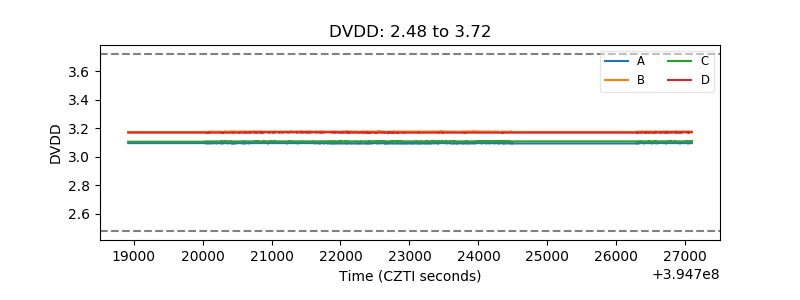 |
| Temperature 1 | 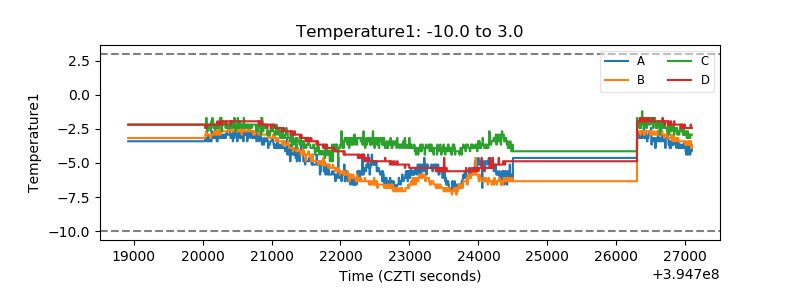 |
| Veto HV Monitor | 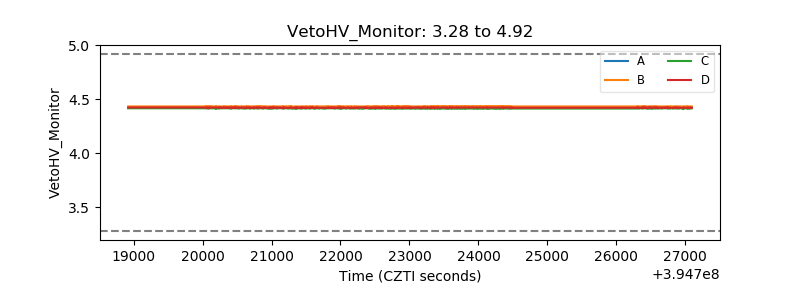 |
| Veto LLD | 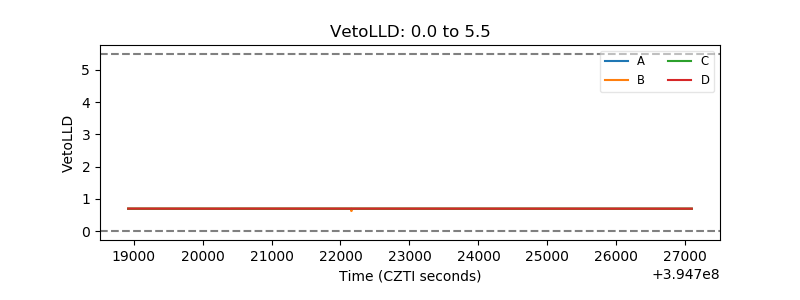 |
| Alpha Counter | 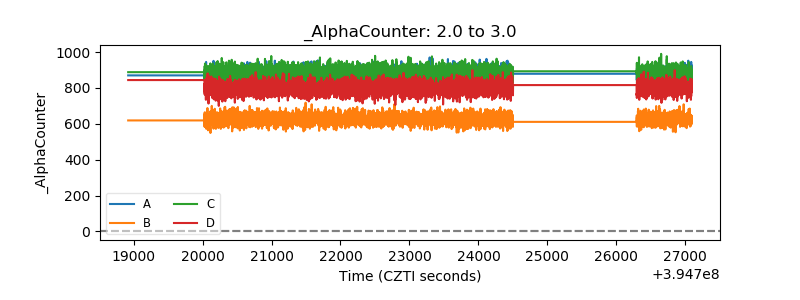 |
| _CPM_Rate | 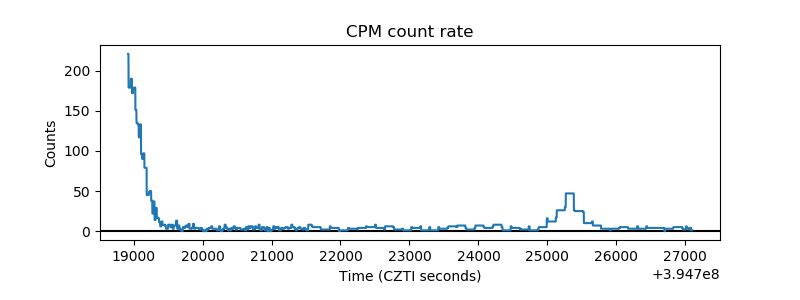 |
| CZT Counter | 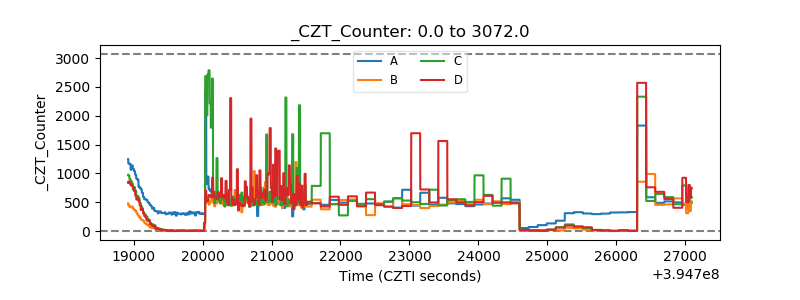 |
| +2.5 Volts monitor |  |
| +5 Volts monitor |  |
| _ROLL_ROT | 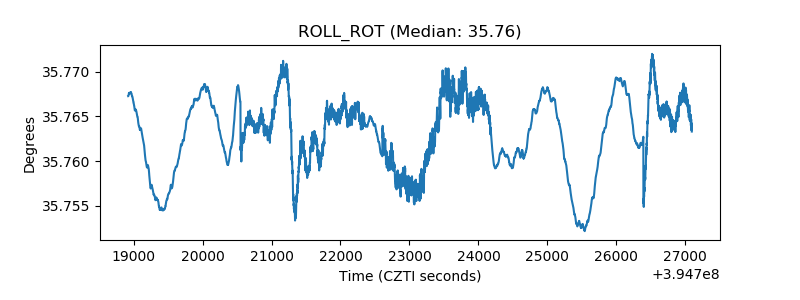 |
| _Roll_DEC | 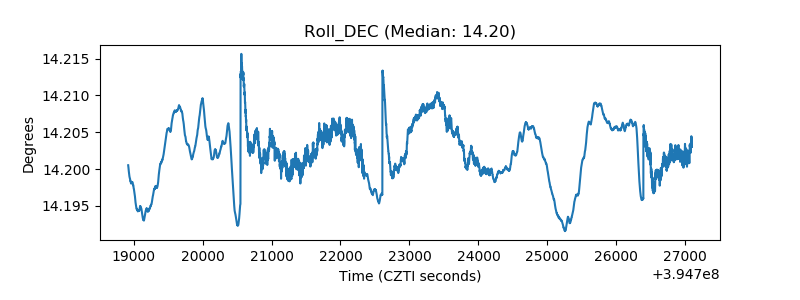 |
| _Roll_RA | 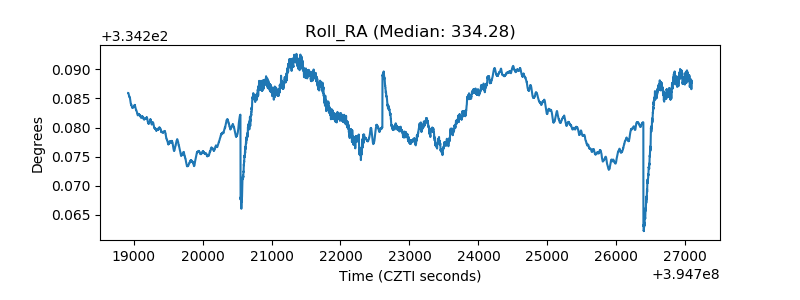 |
| Veto Counter | 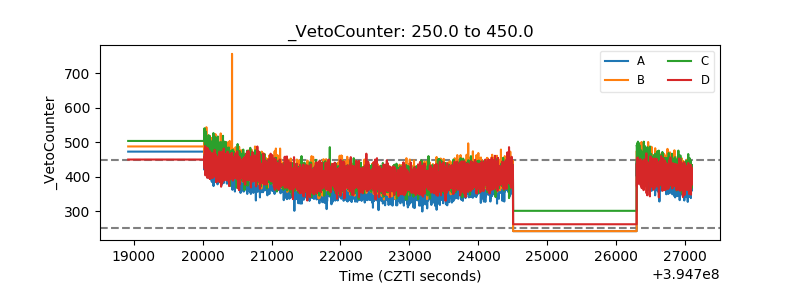 |