| Param | Original file | Final file |
|---|---|---|
| Filename | modeM0/AS1A11_097T24_9000005224_36599cztM0_level2.evt | modeM0/AS1A11_097T24_9000005224_36599cztM0_level2_quad_clean.evt |
| Size (bytes) | 491,379,840 | 85,271,040 |
| Size | 468.6 MB | 81.3 MB |
| Events in quadrant A | 3,129,735 | 557,588 |
| Events in quadrant B | 3,038,318 | 560,222 |
| Events in quadrant C | 3,746,835 | 533,750 |
| Events in quadrant D | 4,551,633 | 503,693 |
| Mode M0 | |||
|---|---|---|---|
| Quadrant | BADHDUFLAG | Total packets | Discarded packets |
| A | 0 | 13112 | 3 |
| B | 0 | 12821 | 2 |
| C | 0 | 14832 | 2 |
| D | 0 | 17642 | 2 |
| Mode M9 | |||
|---|---|---|---|
| Quadrant | BADHDUFLAG | Total packets | Discarded packets |
| A | 0 | 28 | 0 |
| B | 0 | 28 | 0 |
| C | 0 | 28 | 0 |
| D | 0 | 28 | 0 |
| Mode SS | |||
|---|---|---|---|
| Quadrant | BADHDUFLAG | Total packets | Discarded packets |
| A | 0 | 126 | 0 |
| B | 0 | 126 | 0 |
| C | 0 | 126 | 0 |
| D | 0 | 126 | 0 |
| Quadrant | Total seconds | Saturated seconds | Saturation percentage |
|---|---|---|---|
| A | 6113 | 26 | 0.425323% |
| B | 6113 | 16 | 0.261737% |
| C | 6113 | 206 | 3.369867% |
| D | 6113 | 471 | 7.704891% |
Noise dominated data is calculated using 1-second bins in cleaned event files. If a bin has >2000 counts, and if more than 50% of those come from <1% of pixels, then it is considered to be noise-dominated and hence unusable.
| Quadrant | # 1 sec bins | Bins with >0 counts | Bins with >2000 counts | High rate bins dominated by noise | Noise dominated (total time) | Noise dominated (detector-on time) | Marked lightcurve |
|---|---|---|---|---|---|---|---|
| A | 8888 | 6115 | 7 | 7 | 0.08% | 0.11% | 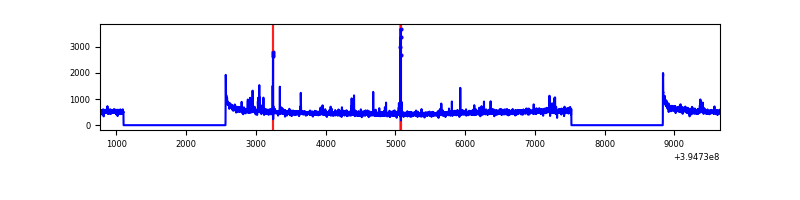 |
| B | 8888 | 6115 | 2 | 2 | 0.02% | 0.03% | 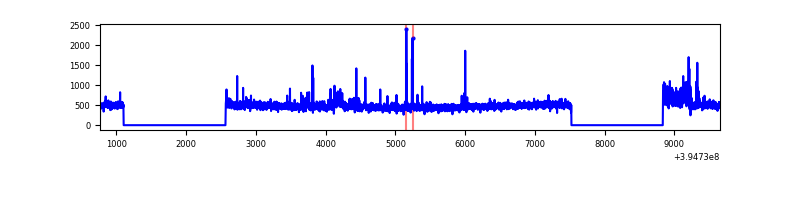 |
| C | 8888 | 6115 | 154 | 154 | 1.73% | 2.52% | 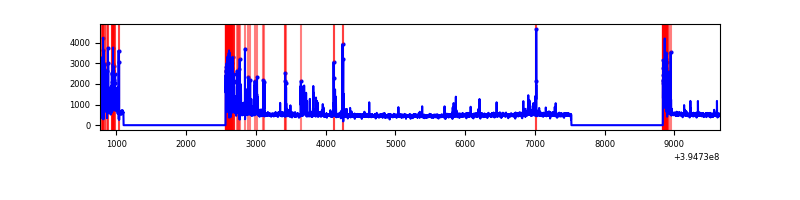 |
| D | 8888 | 6114 | 387 | 387 | 4.35% | 6.33% | 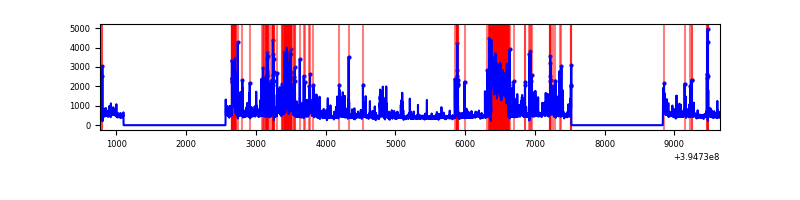 |
Top three noisy pixels from each quadrant. If the there are fewer than three noisy pixels in the level2.evt file, extra rows are filled as -1
| Pixel properties | Quadrant properties | ||||||
|---|---|---|---|---|---|---|---|
| Quadrant | DetID | PixID | Counts | Sigma | Mean | Median | Sigma |
| A | 10 | 83 | 218410 | 1500.68 | 720 | 707 | 145.1 |
| A | 15 | 223 | 68557 | 467.71 | 720 | 707 | 145.1 |
| A | 9 | 143 | 41952 | 284.31 | 720 | 707 | 145.1 |
| B | 0 | 213 | 69592 | 495.35 | 713 | 694 | 139.1 |
| B | 0 | 190 | 53325 | 378.4 | 713 | 694 | 139.1 |
| B | 4 | 171 | 41242 | 291.53 | 713 | 694 | 139.1 |
| C | 0 | 207 | 414358 | 2594.01 | 679 | 684 | 159.5 |
| C | 0 | 10 | 376170 | 2354.55 | 679 | 684 | 159.5 |
| C | 15 | 214 | 257372 | 1609.6 | 679 | 684 | 159.5 |
| D | 13 | 171 | 1081709 | 6552.3 | 675 | 656 | 165.0 |
| D | 2 | 153 | 322560 | 1951.07 | 675 | 656 | 165.0 |
| D | 12 | 235 | 181281 | 1094.77 | 675 | 656 | 165.0 |
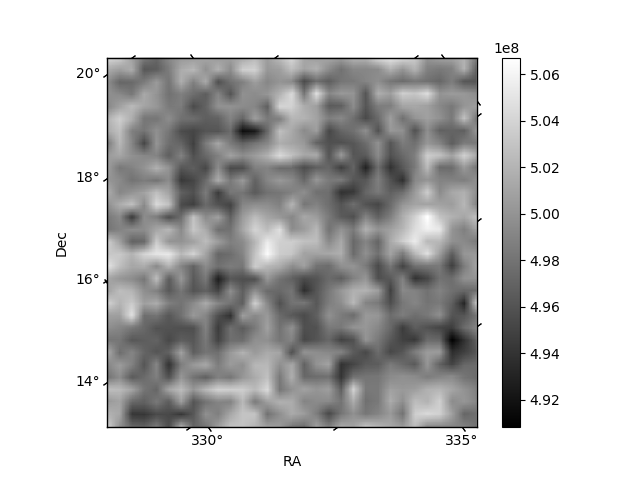
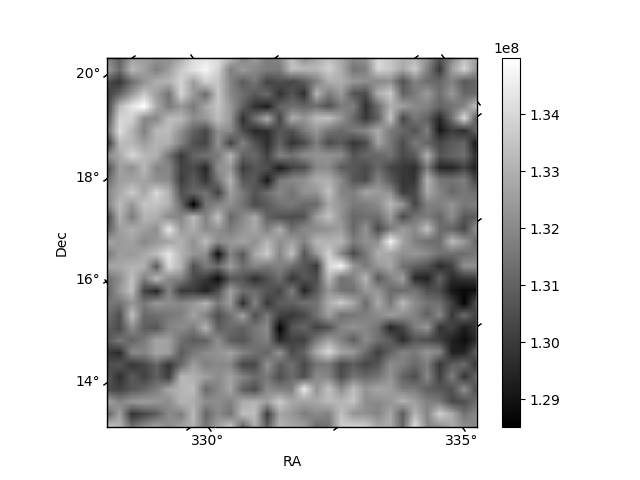
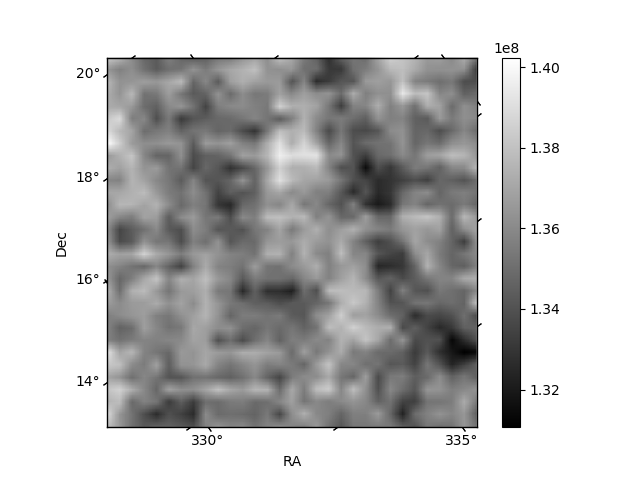
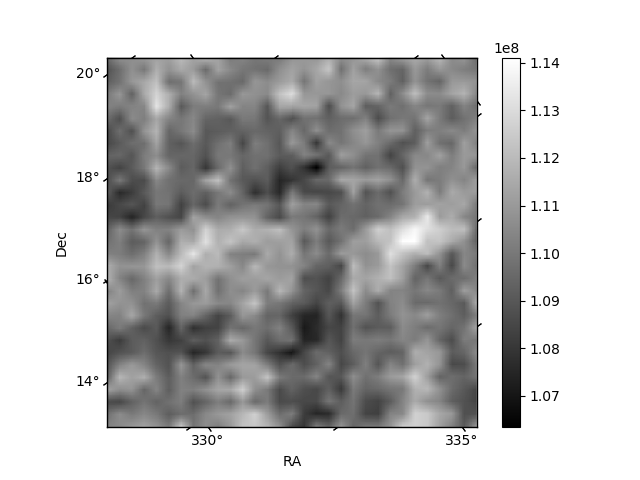
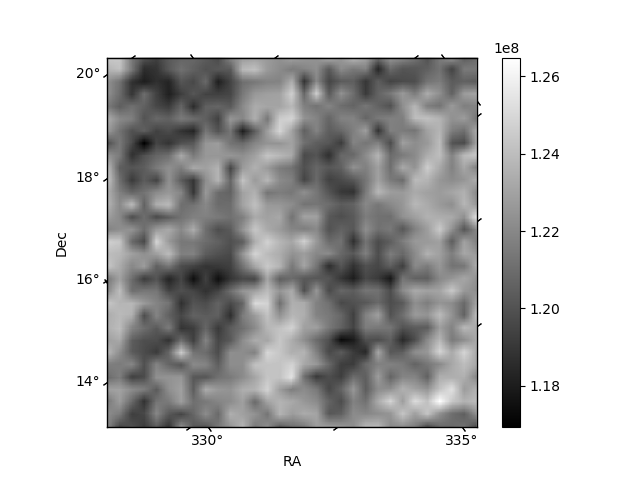
Histogram calculated using DETX and DETY for each event in the final _common_clean file
| Quadrant A | 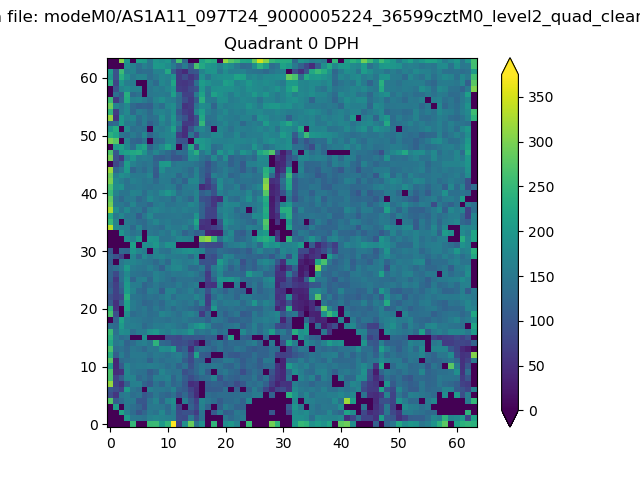 |
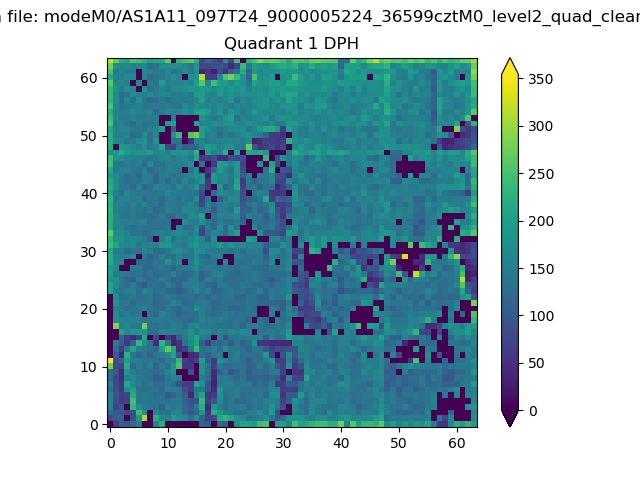 |
Quadrant B |
|---|---|---|---|
| Quadrant D | 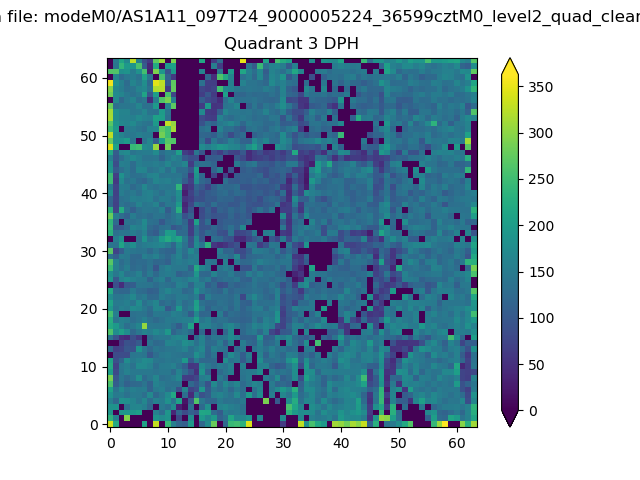 |
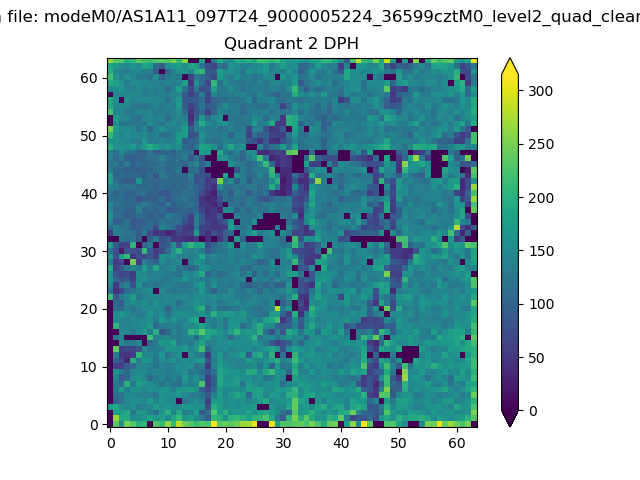 |
Quadrant C |
| Plot type | Count rate plots | Images |
|---|---|---|
| Comparison with Poisson distribution Blue bars denote a histogram of data divided into 1 sec bins. Red curve is a Poisson curve with rate = median count rate of data. |
 |
 |
| Quadrant-wise count rates Data is divided into 100 sec bins |
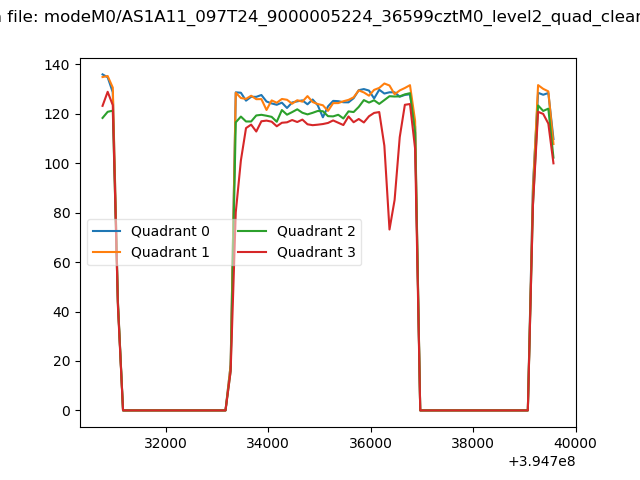 |
|
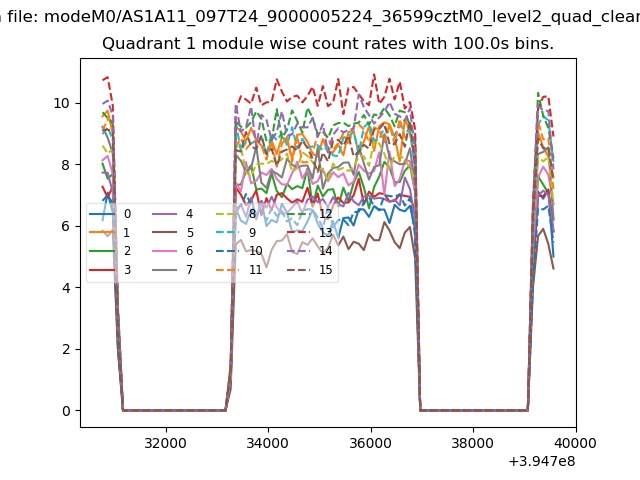
| Module-wise count rates for Quadrant A Data is divided into 100 sec bins |
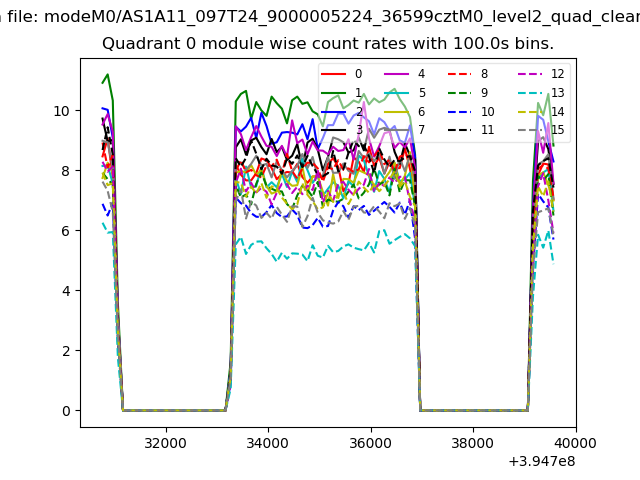 |
 |
| Module-wise count rates for Quadrant B Data is divided into 100 sec bins |
 |
 |
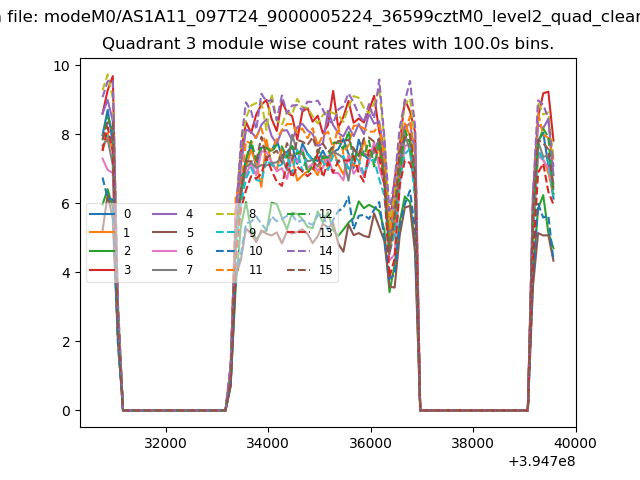
| Module-wise count rates for Quadrant C Data is divided into 100 sec bins |
 |
 |
| Module-wise count rates for Quadrant D Data is divided into 100 sec bins |
 |
 |
| Parameter | Plot |
|---|---|
| CZT HV Monitor |  |
| D_VDD | 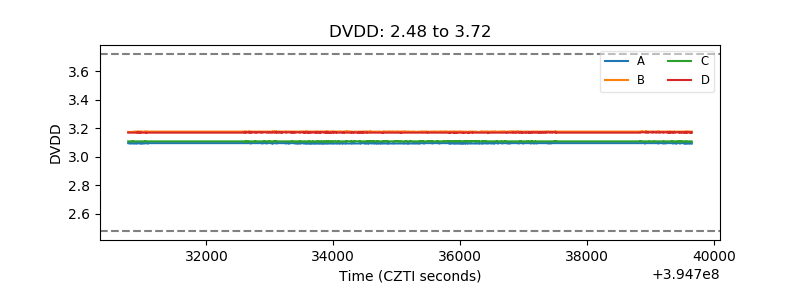 |
| Temperature 1 | 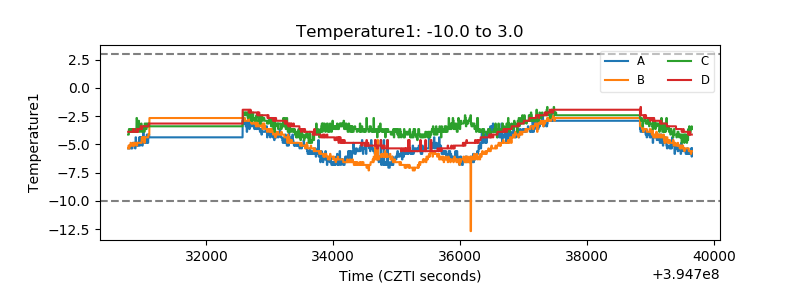 |
| Veto HV Monitor | 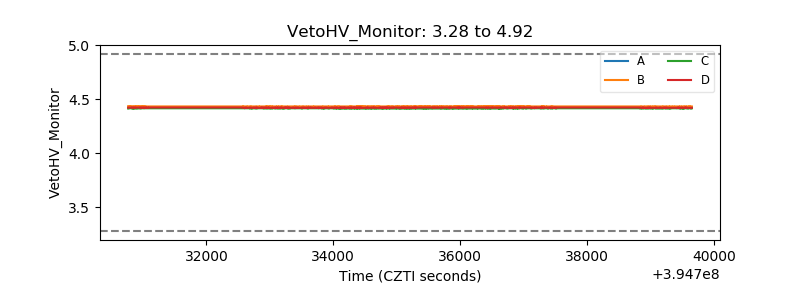 |
| Veto LLD | 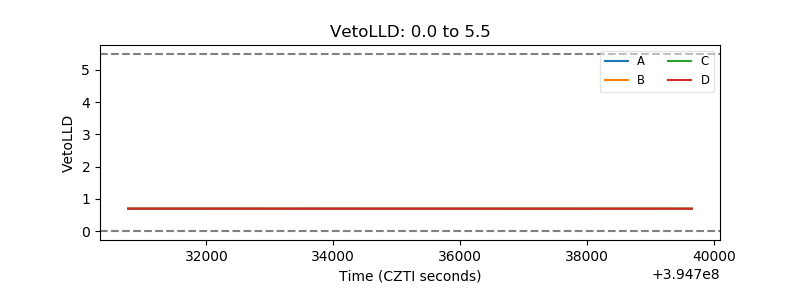 |
| Alpha Counter | 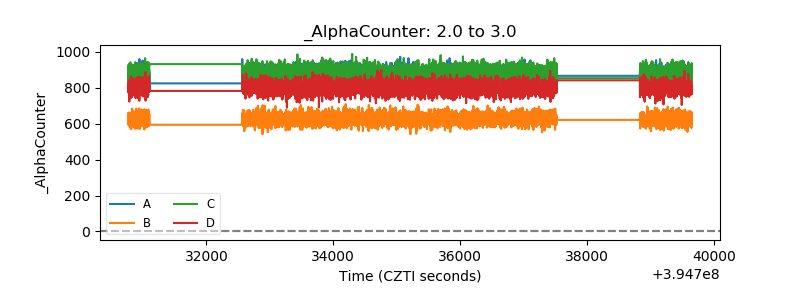 |
| _CPM_Rate | 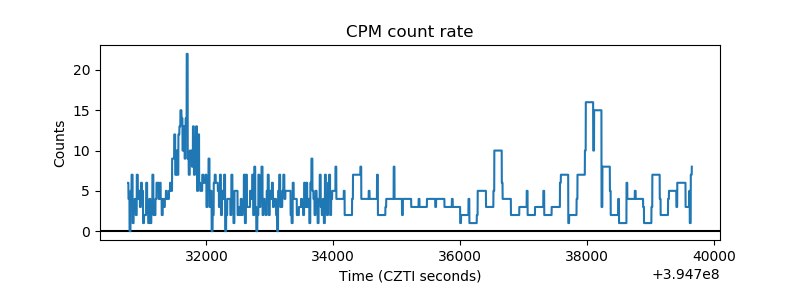 |
| CZT Counter | 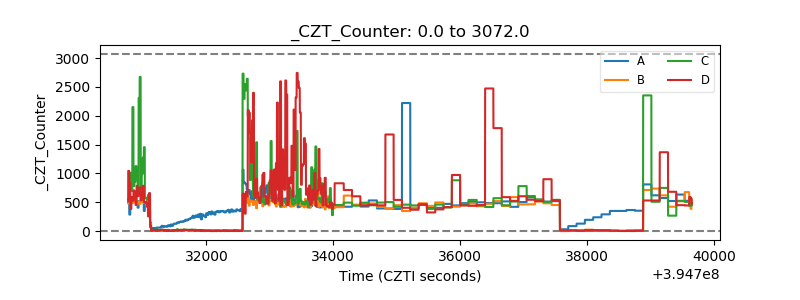 |
| +2.5 Volts monitor | 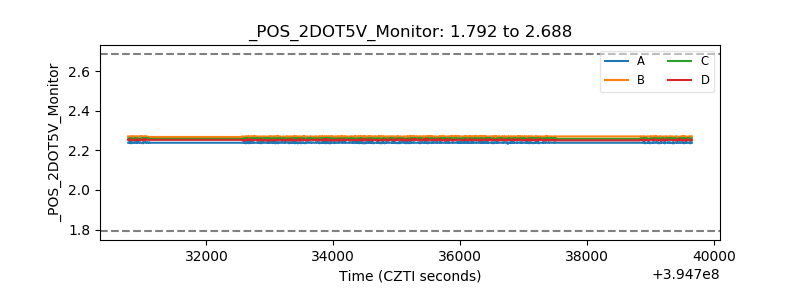 |
| +5 Volts monitor |  |
| _ROLL_ROT | 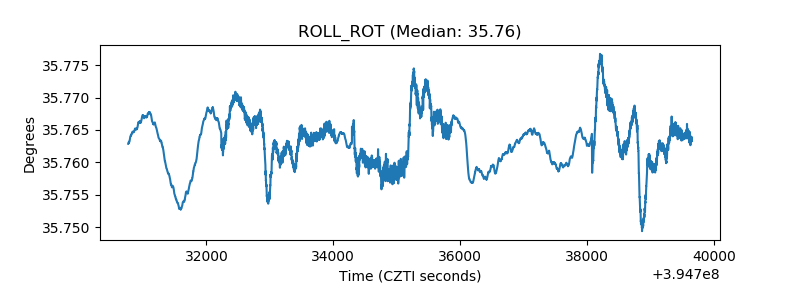 |
| _Roll_DEC | 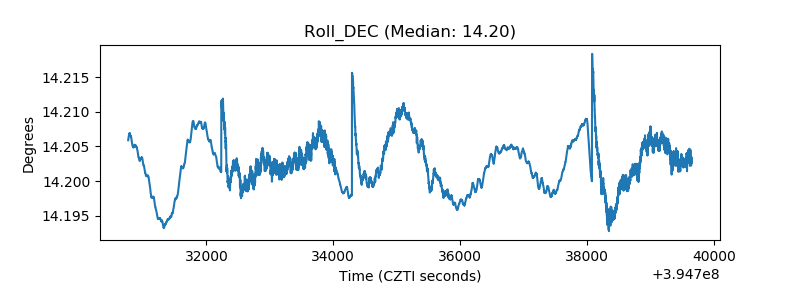 |
| _Roll_RA | 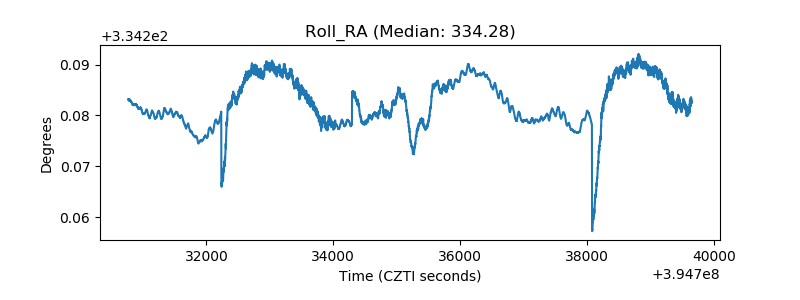 |
| Veto Counter | 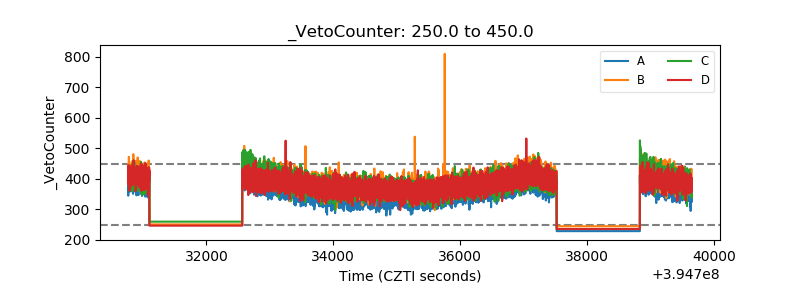 |