| Param | Original file | Final file |
|---|---|---|
| Filename | modeM0/AS1A11_097T24_9000005224_36600cztM0_level2.evt | modeM0/AS1A11_097T24_9000005224_36600cztM0_level2_quad_clean.evt |
| Size (bytes) | 466,297,920 | 88,122,240 |
| Size | 444.7 MB | 84.0 MB |
| Events in quadrant A | 3,140,790 | 573,613 |
| Events in quadrant B | 3,212,500 | 574,928 |
| Events in quadrant C | 3,474,228 | 546,839 |
| Events in quadrant D | 3,867,942 | 535,210 |
| Mode M0 | |||
|---|---|---|---|
| Quadrant | BADHDUFLAG | Total packets | Discarded packets |
| A | 0 | 13282 | 3 |
| B | 0 | 13423 | 2 |
| C | 0 | 14009 | 2 |
| D | 0 | 15886 | 2 |
| Mode M9 | |||
|---|---|---|---|
| Quadrant | BADHDUFLAG | Total packets | Discarded packets |
| A | 0 | 26 | 0 |
| B | 0 | 26 | 0 |
| C | 0 | 26 | 0 |
| D | 0 | 26 | 0 |
| Mode SS | |||
|---|---|---|---|
| Quadrant | BADHDUFLAG | Total packets | Discarded packets |
| A | 0 | 130 | 0 |
| B | 0 | 130 | 0 |
| C | 0 | 130 | 0 |
| D | 0 | 130 | 0 |
| Quadrant | Total seconds | Saturated seconds | Saturation percentage |
|---|---|---|---|
| A | 6275 | 13 | 0.207171% |
| B | 6275 | 15 | 0.239044% |
| C | 6275 | 165 | 2.629482% |
| D | 6275 | 144 | 2.294821% |
Noise dominated data is calculated using 1-second bins in cleaned event files. If a bin has >2000 counts, and if more than 50% of those come from <1% of pixels, then it is considered to be noise-dominated and hence unusable.
| Quadrant | # 1 sec bins | Bins with >0 counts | Bins with >2000 counts | High rate bins dominated by noise | Noise dominated (total time) | Noise dominated (detector-on time) | Marked lightcurve |
|---|---|---|---|---|---|---|---|
| A | 8900 | 6277 | 2 | 2 | 0.02% | 0.03% | 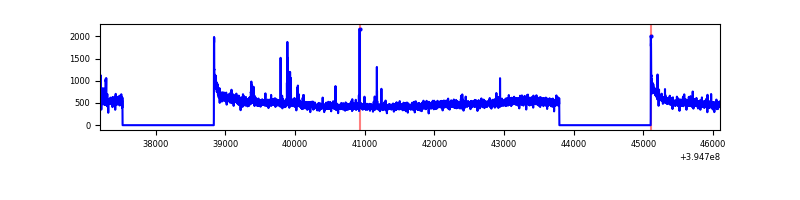 |
| B | 8900 | 6277 | 2 | 2 | 0.02% | 0.03% | 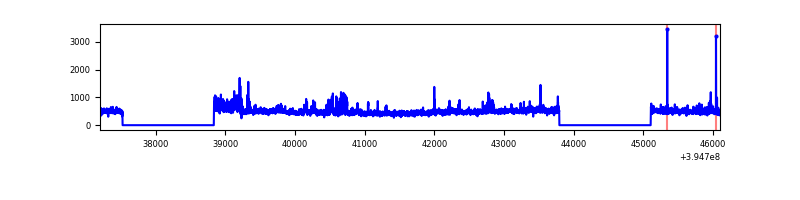 |
| C | 8900 | 6277 | 121 | 121 | 1.36% | 1.93% | 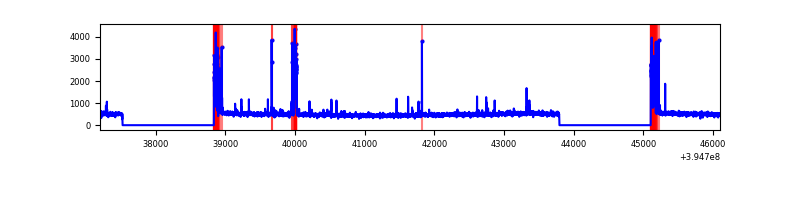 |
| D | 8900 | 6276 | 91 | 91 | 1.02% | 1.45% | 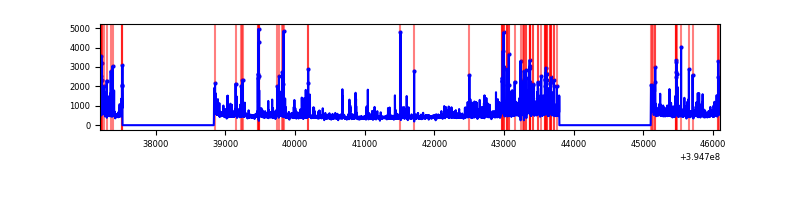 |
Top three noisy pixels from each quadrant. If the there are fewer than three noisy pixels in the level2.evt file, extra rows are filled as -1
| Pixel properties | Quadrant properties | ||||||
|---|---|---|---|---|---|---|---|
| Quadrant | DetID | PixID | Counts | Sigma | Mean | Median | Sigma |
| A | 10 | 83 | 219453 | 1472.31 | 733 | 719 | 148.6 |
| A | 15 | 223 | 49059 | 325.38 | 733 | 719 | 148.6 |
| A | 9 | 143 | 18503 | 119.71 | 733 | 719 | 148.6 |
| B | 0 | 213 | 154990 | 1093.93 | 726 | 707 | 141.0 |
| B | 0 | 190 | 62276 | 436.55 | 726 | 707 | 141.0 |
| B | 4 | 171 | 41563 | 289.69 | 726 | 707 | 141.0 |
| C | 0 | 10 | 345473 | 2107.84 | 698 | 702 | 163.6 |
| C | 15 | 214 | 264862 | 1615.01 | 698 | 702 | 163.6 |
| C | 0 | 207 | 75572 | 457.74 | 698 | 702 | 163.6 |
| D | 12 | 235 | 394155 | 2283.62 | 704 | 685 | 172.3 |
| D | 13 | 171 | 171871 | 993.53 | 704 | 685 | 172.3 |
| D | 10 | 199 | 110063 | 634.81 | 704 | 685 | 172.3 |
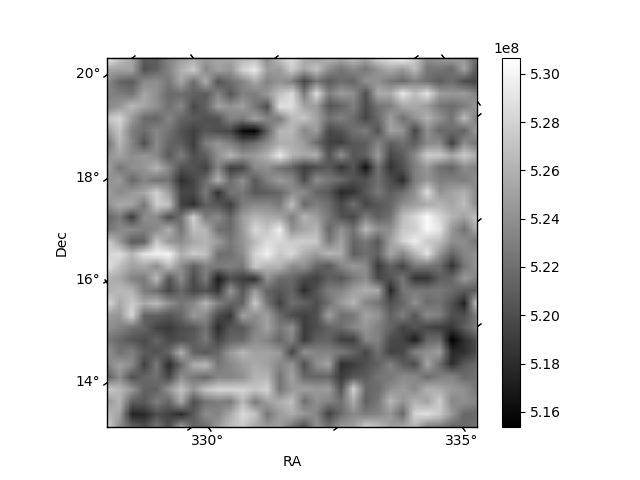
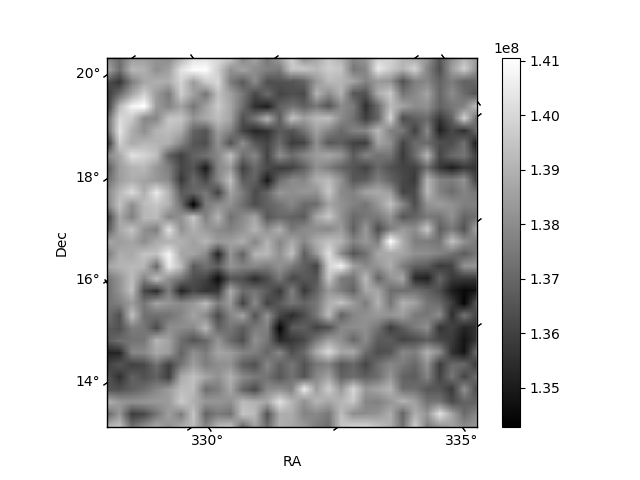
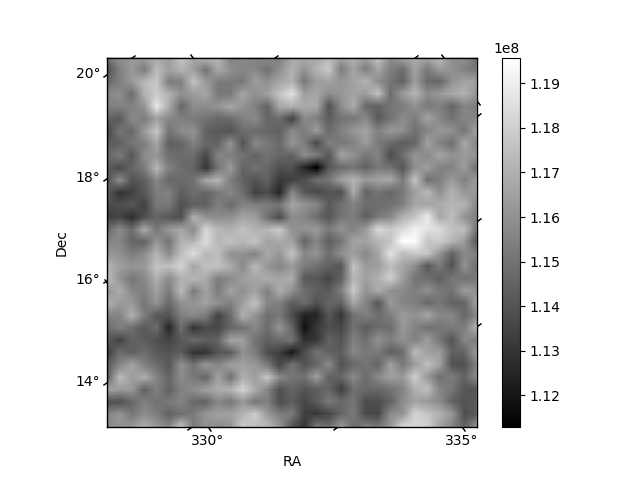
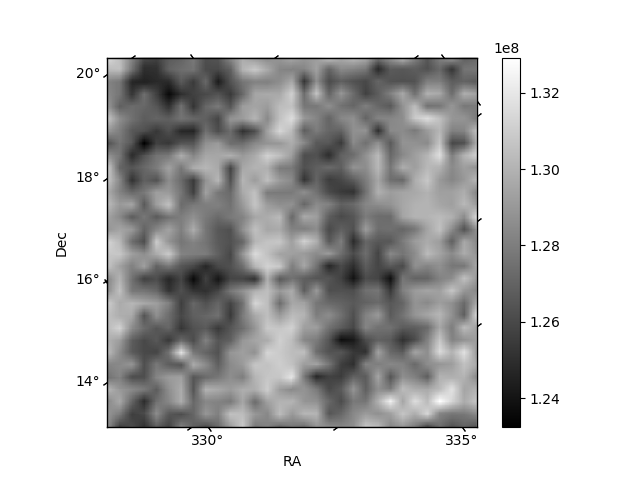
Histogram calculated using DETX and DETY for each event in the final _common_clean file
| Quadrant A | 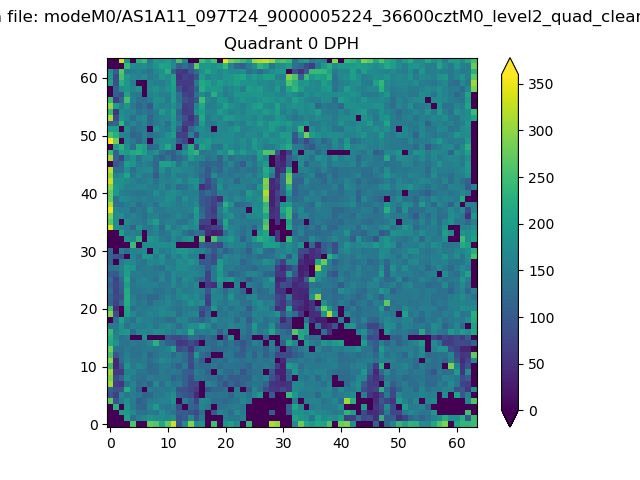 |
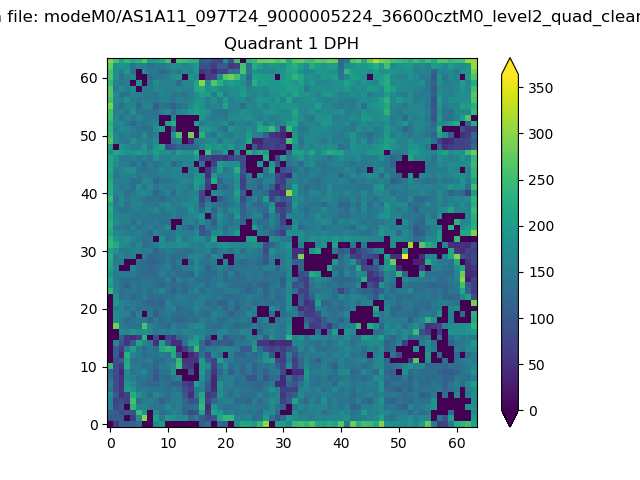 |
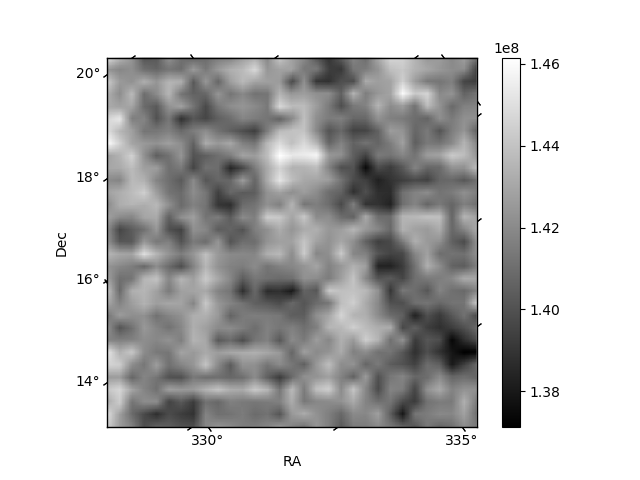
Quadrant B |
|---|---|---|---|
| Quadrant D | 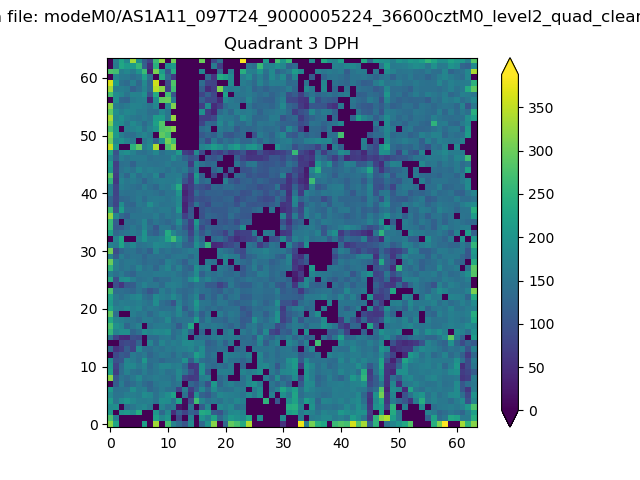 |
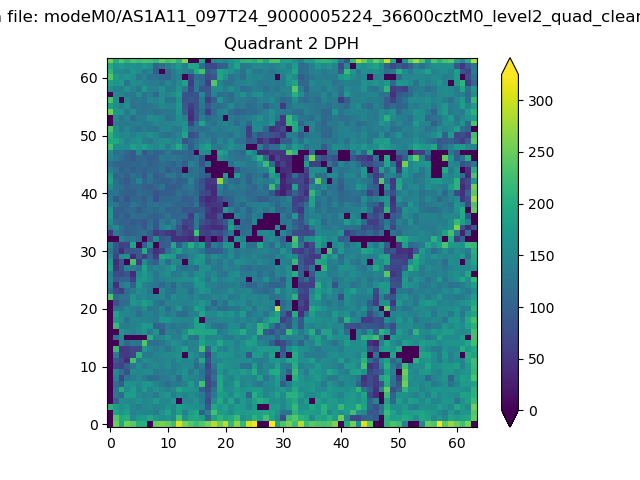 |
Quadrant C |
| Plot type | Count rate plots | Images |
|---|---|---|
| Comparison with Poisson distribution Blue bars denote a histogram of data divided into 1 sec bins. Red curve is a Poisson curve with rate = median count rate of data. |
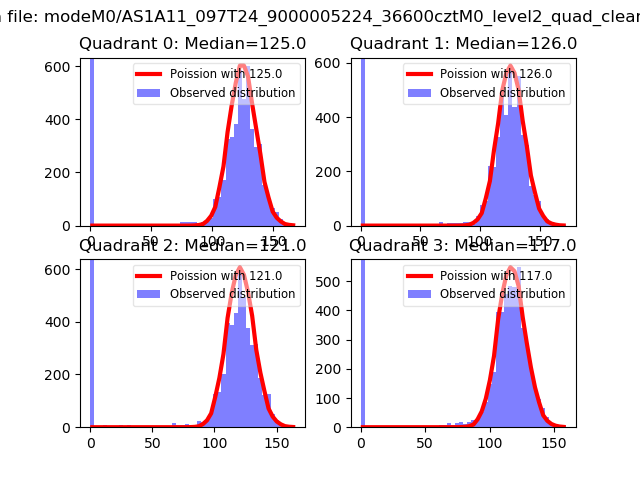 |
 |
| Quadrant-wise count rates Data is divided into 100 sec bins |
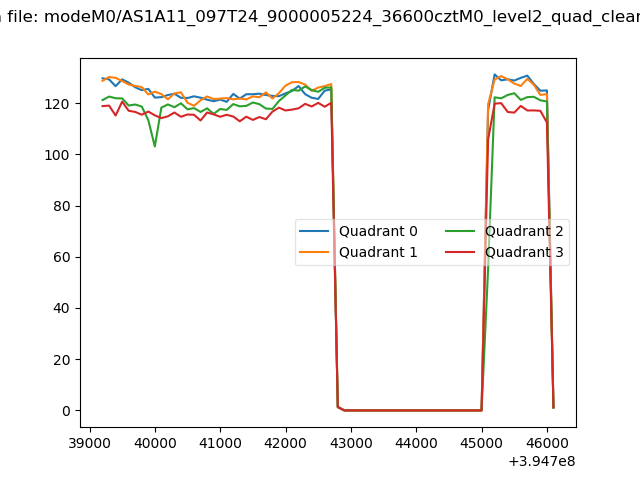 |
|
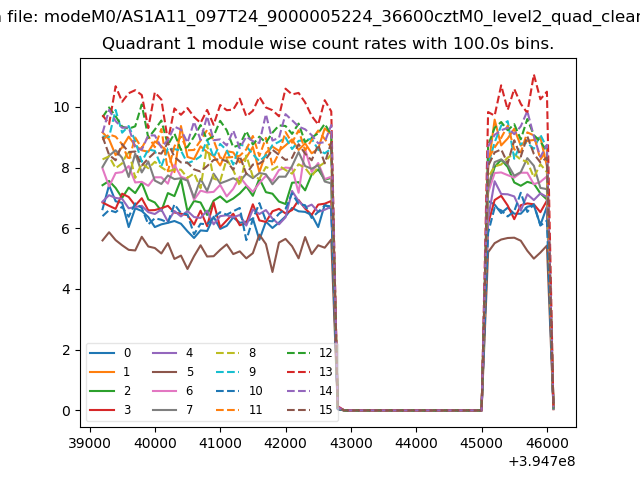
| Module-wise count rates for Quadrant A Data is divided into 100 sec bins |
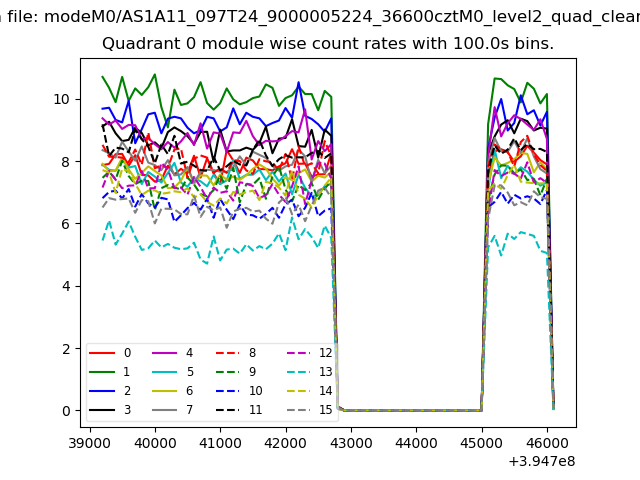 |
 |
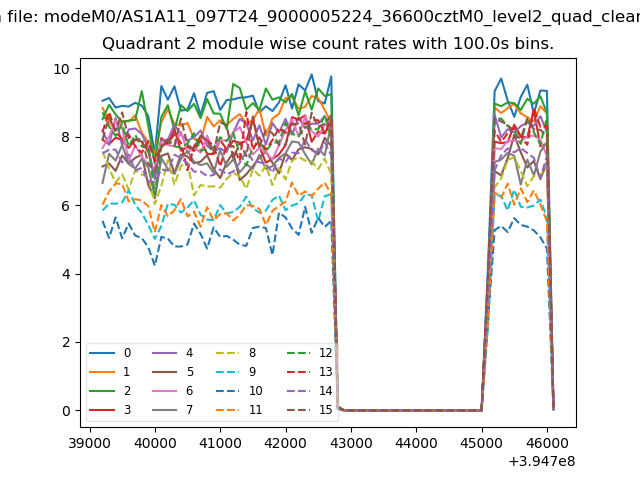
| Module-wise count rates for Quadrant B Data is divided into 100 sec bins |
 |
 |
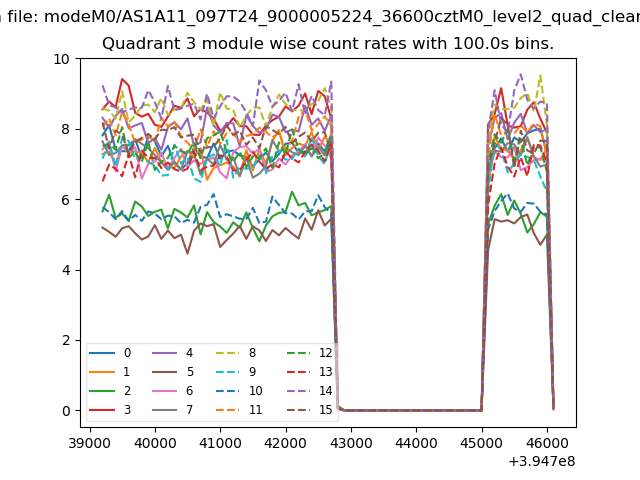
| Module-wise count rates for Quadrant C Data is divided into 100 sec bins |
 |
 |
| Module-wise count rates for Quadrant D Data is divided into 100 sec bins |
 |
 |
| Parameter | Plot |
|---|---|
| CZT HV Monitor | 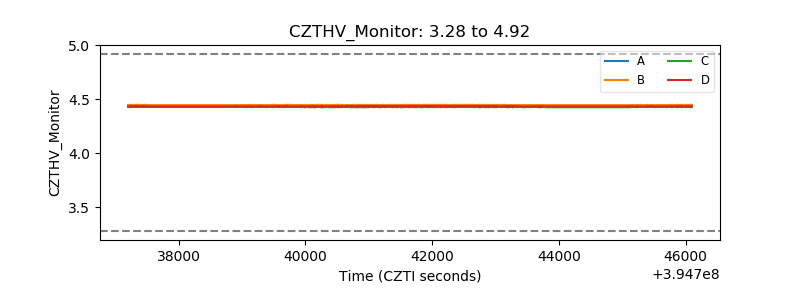 |
| D_VDD | 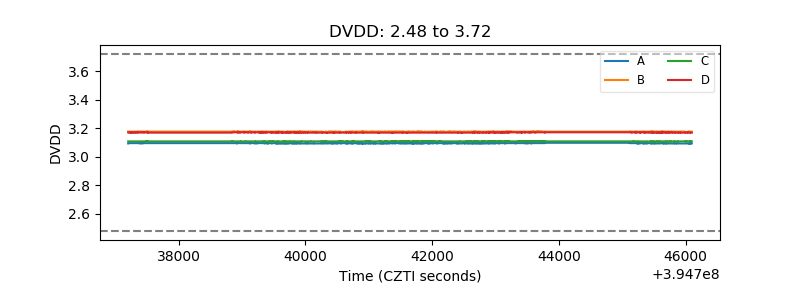 |
| Temperature 1 |  |
| Veto HV Monitor | 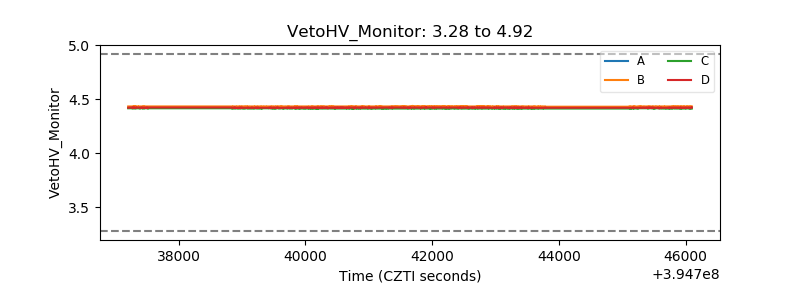 |
| Veto LLD | 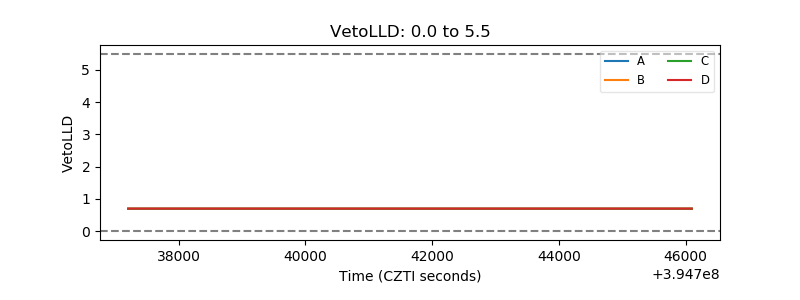 |
| Alpha Counter | 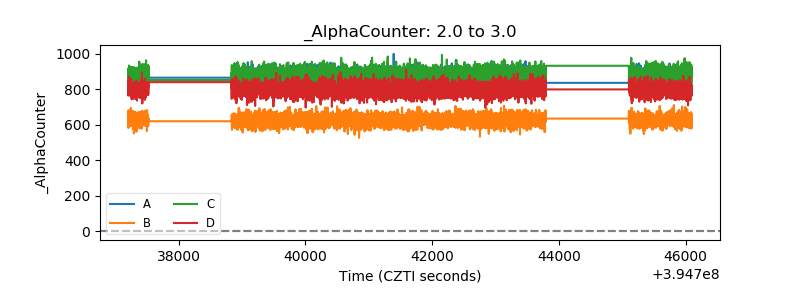 |
| _CPM_Rate | 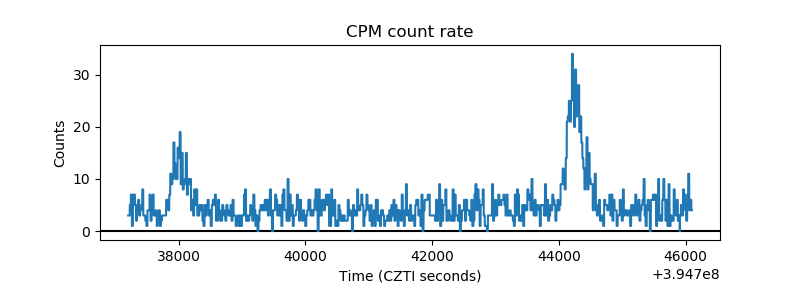 |
| CZT Counter |  |
| +2.5 Volts monitor |  |
| +5 Volts monitor |  |
| _ROLL_ROT | 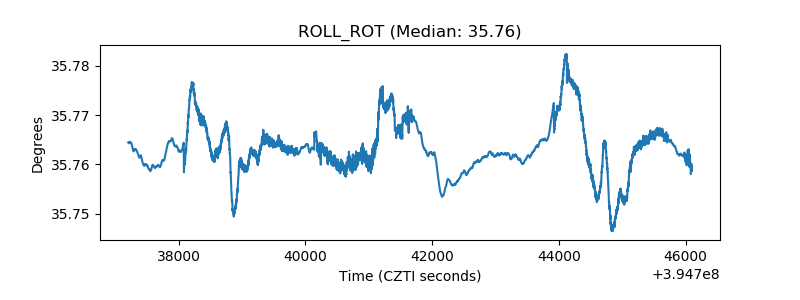 |
| _Roll_DEC | 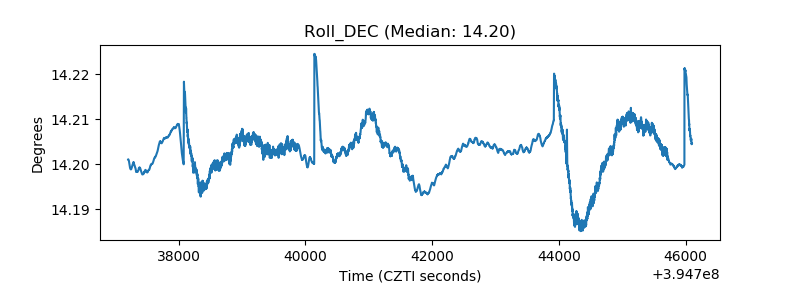 |
| _Roll_RA | 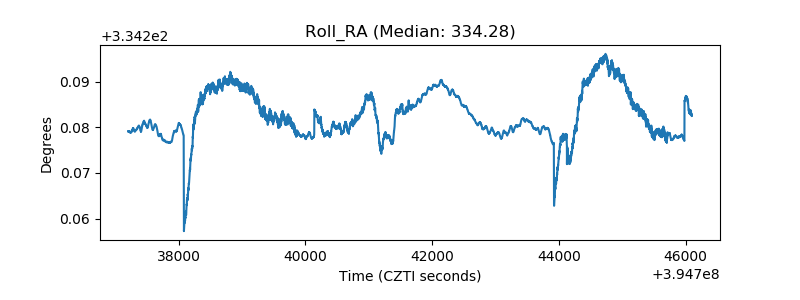 |
| Veto Counter | 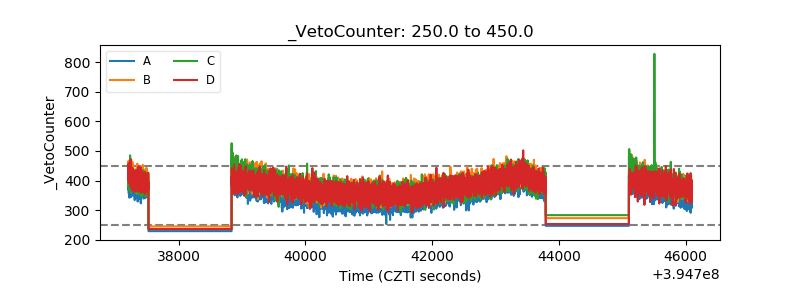 |