| Param | Original file | Final file |
|---|---|---|
| Filename | modeM0/AS1A11_097T24_9000005224_36602cztM0_level2.evt | modeM0/AS1A11_097T24_9000005224_36602cztM0_level2_quad_clean.evt |
| Size (bytes) | 905,094,720 | 145,909,440 |
| Size | 863.2 MB | 139.2 MB |
| Events in quadrant A | 5,241,440 | 948,636 |
| Events in quadrant B | 5,595,515 | 952,788 |
| Events in quadrant C | 5,859,890 | 907,122 |
| Events in quadrant D | 9,985,521 | 863,626 |
| Mode M0 | |||
|---|---|---|---|
| Quadrant | BADHDUFLAG | Total packets | Discarded packets |
| A | 0 | 22575 | 4 |
| B | 0 | 23637 | 3 |
| C | 0 | 23976 | 3 |
| D | 0 | 37248 | 3 |
| Mode M9 | |||
|---|---|---|---|
| Quadrant | BADHDUFLAG | Total packets | Discarded packets |
| A | 0 | 33 | 0 |
| B | 0 | 33 | 0 |
| C | 0 | 33 | 0 |
| D | 0 | 34 | 0 |
| Mode SS | |||
|---|---|---|---|
| Quadrant | BADHDUFLAG | Total packets | Discarded packets |
| A | 0 | 220 | 0 |
| B | 0 | 220 | 0 |
| C | 0 | 220 | 0 |
| D | 0 | 220 | 0 |
| Quadrant | Total seconds | Saturated seconds | Saturation percentage |
|---|---|---|---|
| A | 10785 | 20 | 0.185443% |
| B | 10785 | 223 | 2.067687% |
| C | 10785 | 211 | 1.956421% |
| D | 10785 | 706 | 6.546129% |
Noise dominated data is calculated using 1-second bins in cleaned event files. If a bin has >2000 counts, and if more than 50% of those come from <1% of pixels, then it is considered to be noise-dominated and hence unusable.
| Quadrant | # 1 sec bins | Bins with >0 counts | Bins with >2000 counts | High rate bins dominated by noise | Noise dominated (total time) | Noise dominated (detector-on time) | Marked lightcurve |
|---|---|---|---|---|---|---|---|
| A | 13620 | 10787 | 4 | 4 | 0.03% | 0.04% | 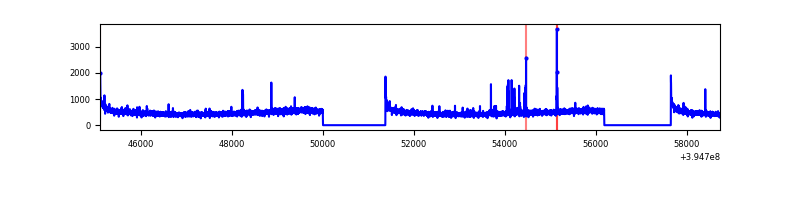 |
| B | 13620 | 10787 | 114 | 114 | 0.84% | 1.06% | 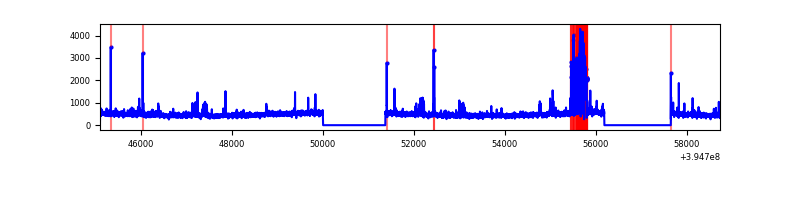 |
| C | 13620 | 10787 | 140 | 140 | 1.03% | 1.30% | 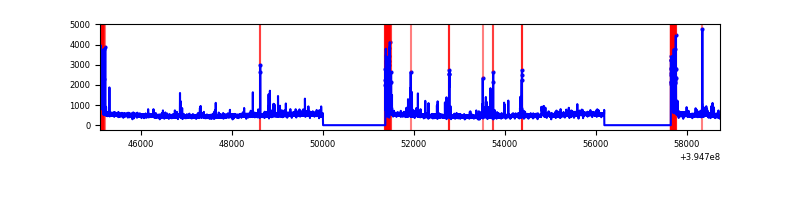 |
| D | 13620 | 10787 | 625 | 625 | 4.59% | 5.79% | 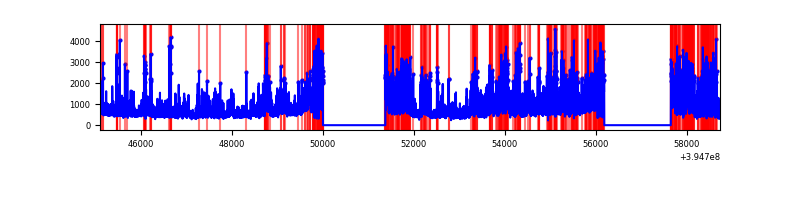 |
Top three noisy pixels from each quadrant. If the there are fewer than three noisy pixels in the level2.evt file, extra rows are filled as -1
| Pixel properties | Quadrant properties | ||||||
|---|---|---|---|---|---|---|---|
| Quadrant | DetID | PixID | Counts | Sigma | Mean | Median | Sigma |
| A | 10 | 83 | 348353 | 1405.46 | 1239 | 1213 | 247.0 |
| A | 15 | 223 | 61648 | 244.68 | 1239 | 1213 | 247.0 |
| A | 9 | 143 | 32268 | 125.73 | 1239 | 1213 | 247.0 |
| B | 4 | 171 | 439485 | 1893.68 | 1211 | 1180 | 231.5 |
| B | 0 | 213 | 136928 | 586.49 | 1211 | 1180 | 231.5 |
| B | 0 | 219 | 96446 | 411.59 | 1211 | 1180 | 231.5 |
| C | 0 | 10 | 559524 | 2025.58 | 1186 | 1195 | 275.6 |
| C | 15 | 214 | 457029 | 1653.73 | 1186 | 1195 | 275.6 |
| C | 0 | 207 | 126888 | 456.0 | 1186 | 1195 | 275.6 |
| D | 12 | 235 | 3737355 | 13128.46 | 1171 | 1138 | 284.6 |
| D | 2 | 137 | 776500 | 2724.49 | 1171 | 1138 | 284.6 |
| D | 2 | 250 | 298975 | 1046.55 | 1171 | 1138 | 284.6 |
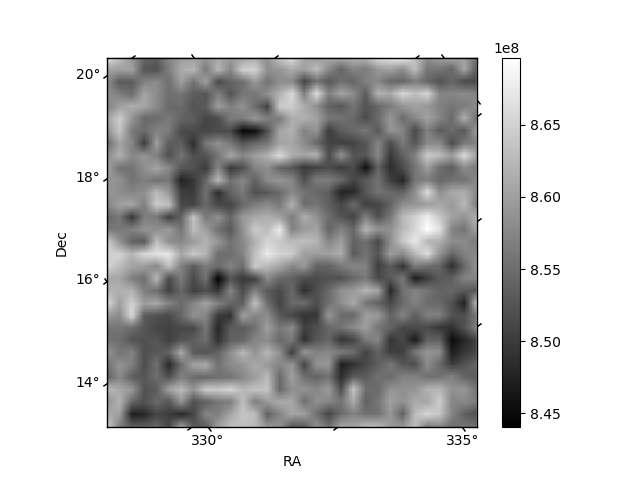
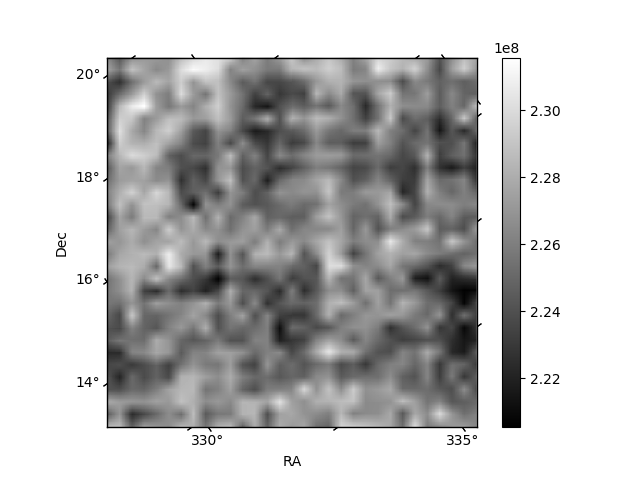
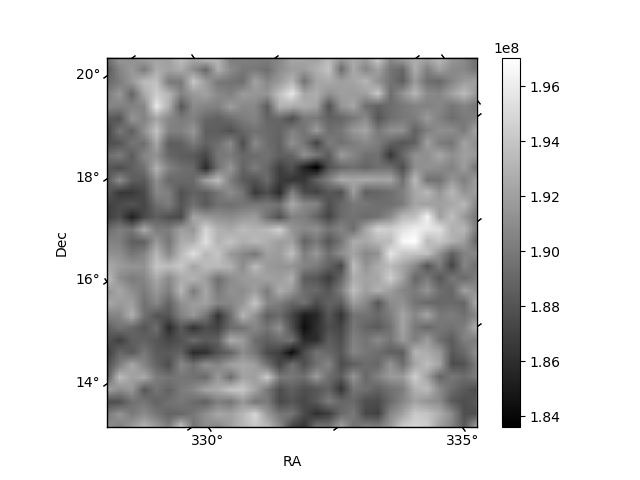
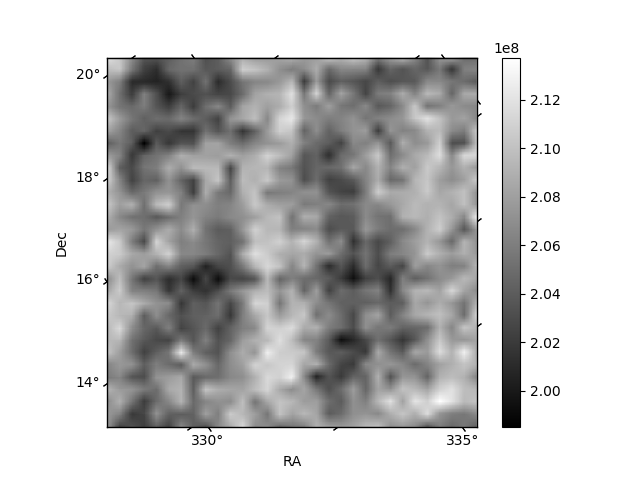
Histogram calculated using DETX and DETY for each event in the final _common_clean file
| Quadrant A | 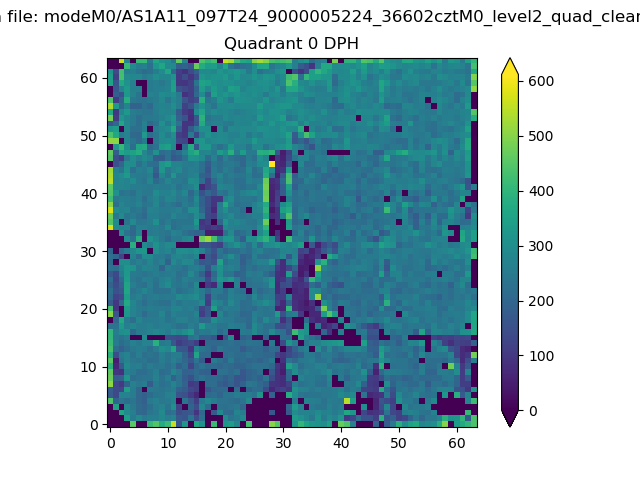 |
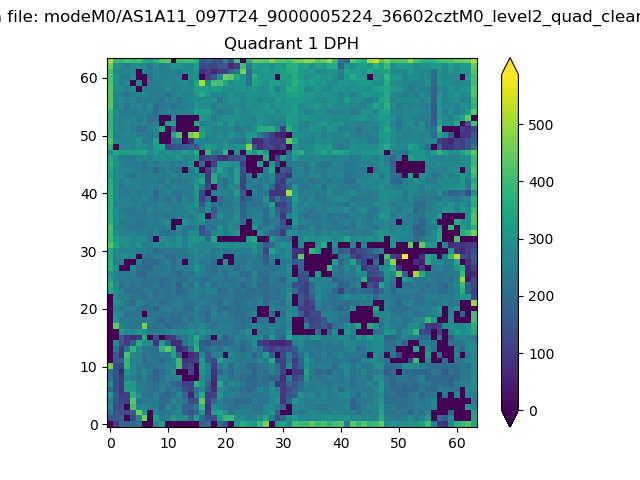 |
Quadrant B |
|---|---|---|---|
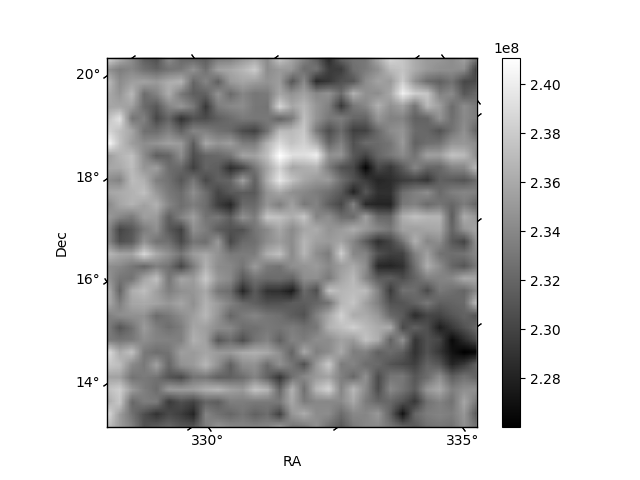
| Quadrant D | 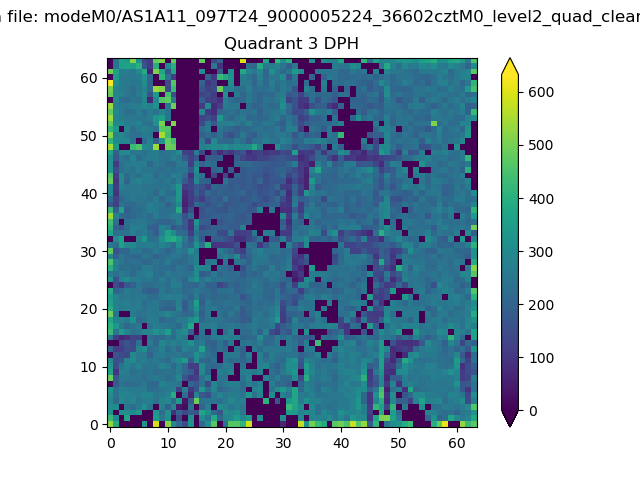 |
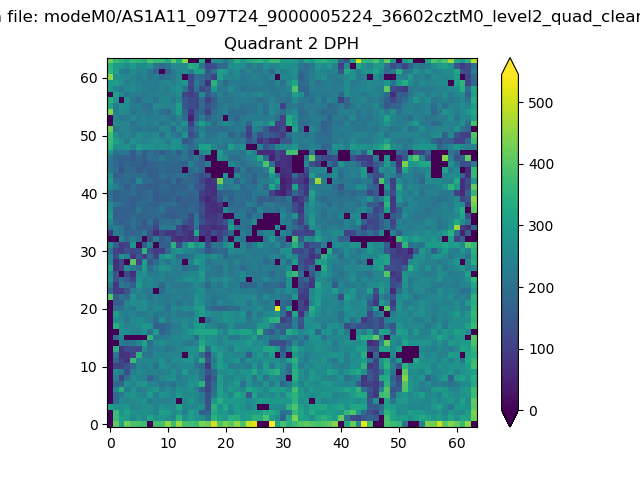 |
Quadrant C |
| Plot type | Count rate plots | Images |
|---|---|---|
| Comparison with Poisson distribution Blue bars denote a histogram of data divided into 1 sec bins. Red curve is a Poisson curve with rate = median count rate of data. |
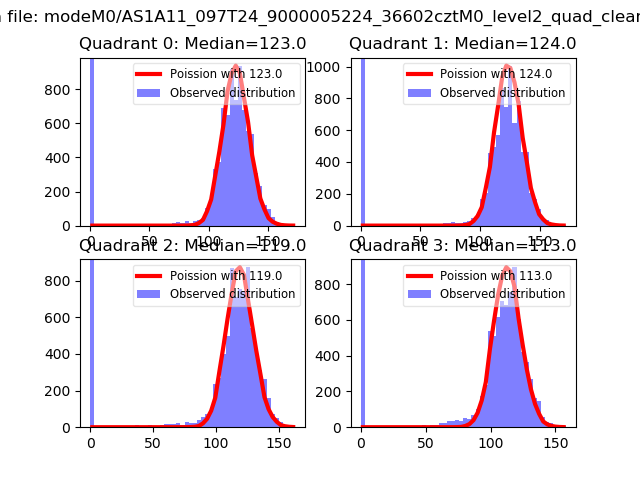 |
 |
| Quadrant-wise count rates Data is divided into 100 sec bins |
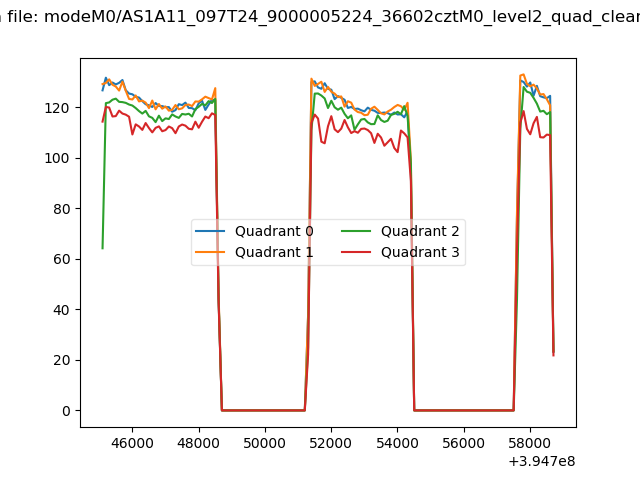 |
|
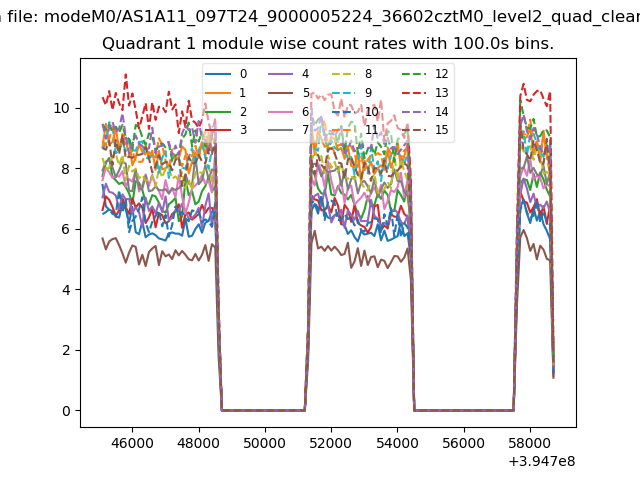
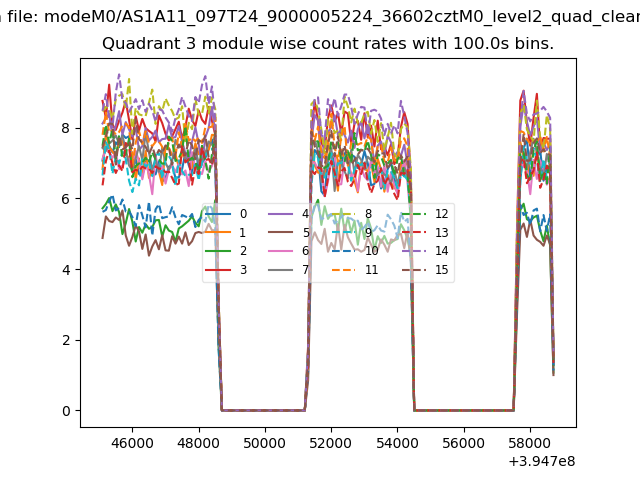
| Module-wise count rates for Quadrant A Data is divided into 100 sec bins |
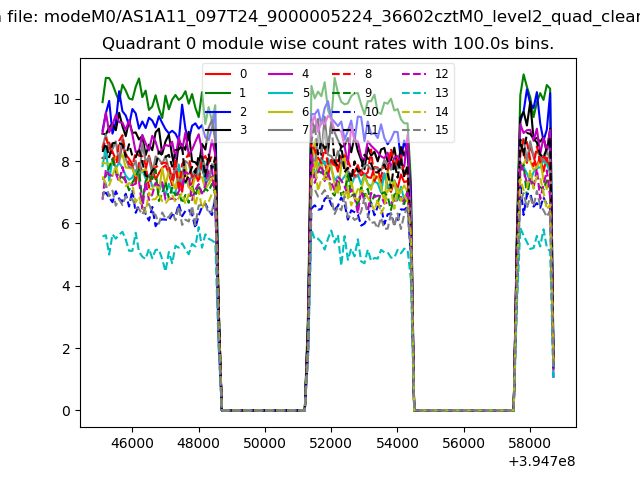 |
 |
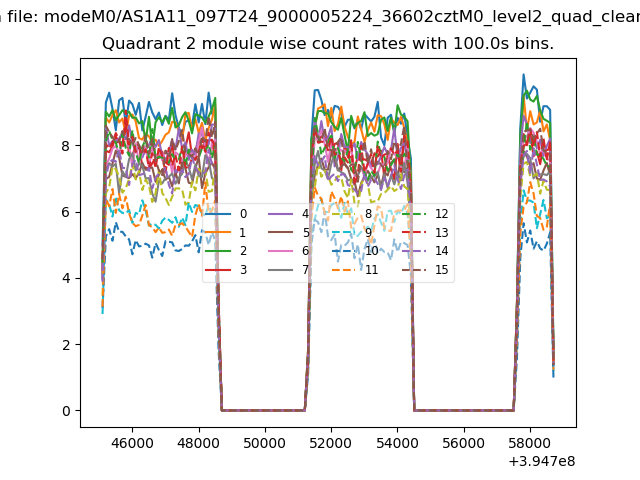
| Module-wise count rates for Quadrant B Data is divided into 100 sec bins |
 |
 |
| Module-wise count rates for Quadrant C Data is divided into 100 sec bins |
 |
 |
| Module-wise count rates for Quadrant D Data is divided into 100 sec bins |
 |
 |
| Parameter | Plot |
|---|---|
| CZT HV Monitor | 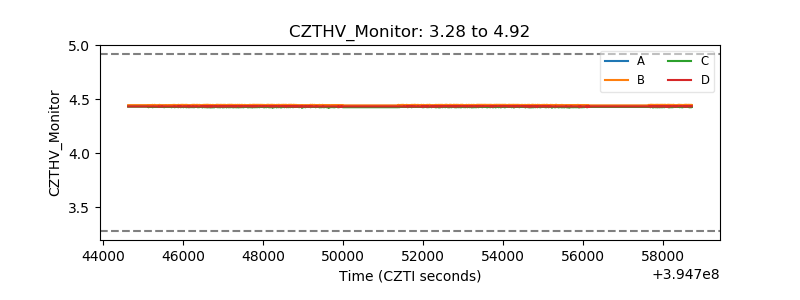 |
| D_VDD |  |
| Temperature 1 | 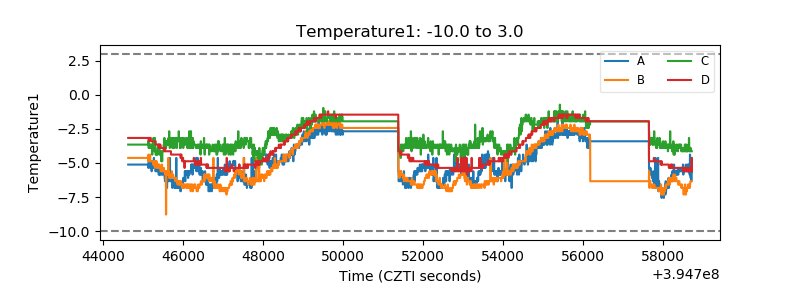 |
| Veto HV Monitor | 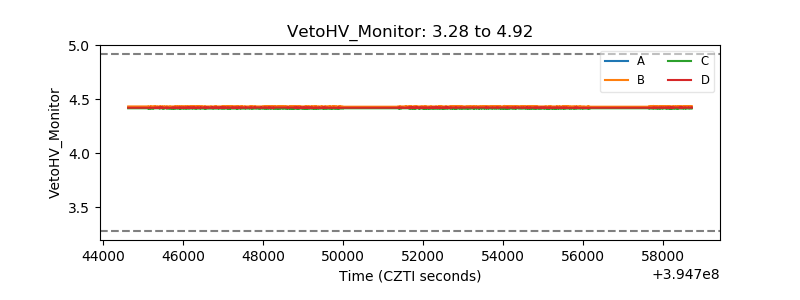 |
| Veto LLD | 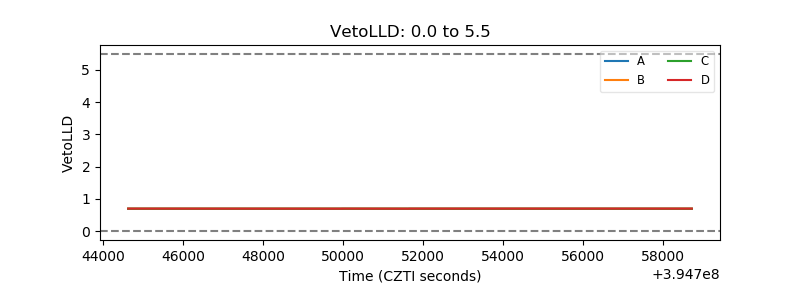 |
| Alpha Counter |  |
| _CPM_Rate | 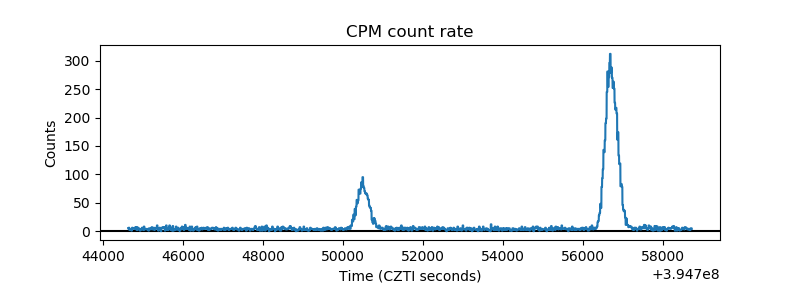 |
| CZT Counter | 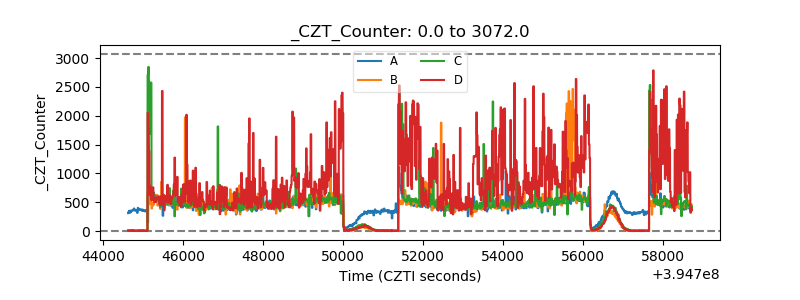 |
| +2.5 Volts monitor |  |
| +5 Volts monitor |  |
| _ROLL_ROT | 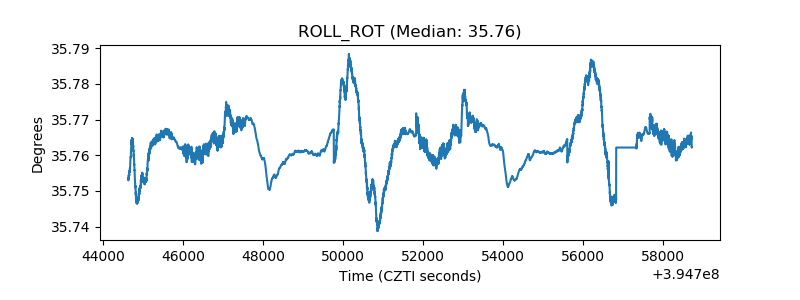 |
| _Roll_DEC | 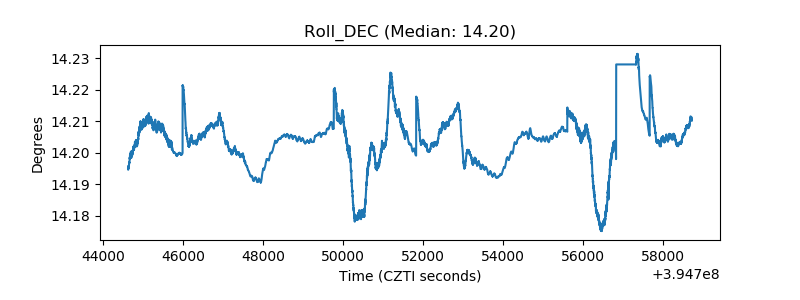 |
| _Roll_RA |  |
| Veto Counter | 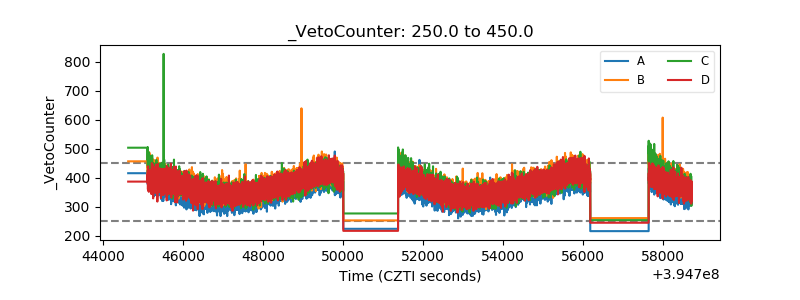 |