| Param | Original file | Final file |
|---|---|---|
| Filename | modeM0/AS1A11_097T24_9000005224_36603cztM0_level2.evt | modeM0/AS1A11_097T24_9000005224_36603cztM0_level2_quad_clean.evt |
| Size (bytes) | 491,048,640 | 69,287,040 |
| Size | 468.3 MB | 66.1 MB |
| Events in quadrant A | 2,810,916 | 437,185 |
| Events in quadrant B | 2,773,385 | 442,005 |
| Events in quadrant C | 3,589,816 | 416,453 |
| Events in quadrant D | 5,308,487 | 401,435 |
| Mode M0 | |||
|---|---|---|---|
| Quadrant | BADHDUFLAG | Total packets | Discarded packets |
| A | 0 | 12048 | 3 |
| B | 0 | 11963 | 2 |
| C | 0 | 14157 | 2 |
| D | 0 | 19756 | 2 |
| Mode M9 | |||
|---|---|---|---|
| Quadrant | BADHDUFLAG | Total packets | Discarded packets |
| A | 0 | 30 | 0 |
| B | 0 | 30 | 0 |
| C | 0 | 30 | 0 |
| D | 0 | 30 | 0 |
| Mode SS | |||
|---|---|---|---|
| Quadrant | BADHDUFLAG | Total packets | Discarded packets |
| A | 0 | 120 | 0 |
| B | 0 | 120 | 0 |
| C | 0 | 120 | 0 |
| D | 0 | 120 | 0 |
| Quadrant | Total seconds | Saturated seconds | Saturation percentage |
|---|---|---|---|
| A | 5728 | 13 | 0.226955% |
| B | 5728 | 14 | 0.244413% |
| C | 5728 | 146 | 2.548883% |
| D | 5728 | 421 | 7.349860% |
Noise dominated data is calculated using 1-second bins in cleaned event files. If a bin has >2000 counts, and if more than 50% of those come from <1% of pixels, then it is considered to be noise-dominated and hence unusable.
| Quadrant | # 1 sec bins | Bins with >0 counts | Bins with >2000 counts | High rate bins dominated by noise | Noise dominated (total time) | Noise dominated (detector-on time) | Marked lightcurve |
|---|---|---|---|---|---|---|---|
| A | 8774 | 5730 | 5 | 5 | 0.06% | 0.09% | 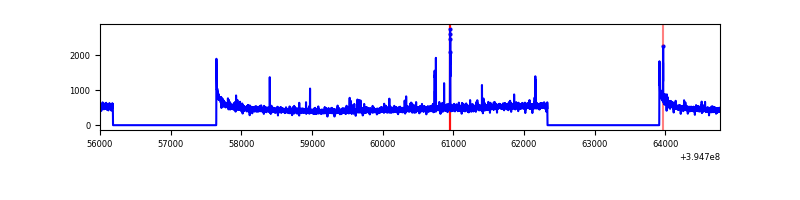 |
| B | 8774 | 5730 | 1 | 1 | 0.01% | 0.02% | 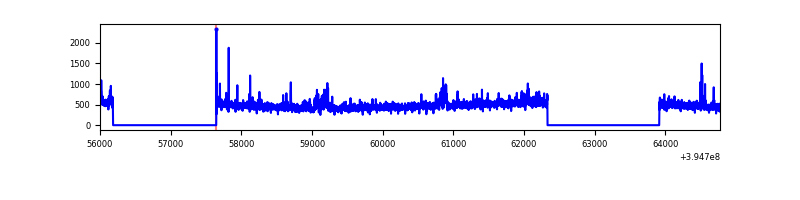 |
| C | 8774 | 5730 | 113 | 113 | 1.29% | 1.97% | 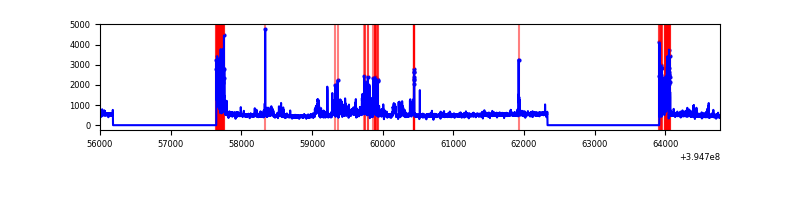 |
| D | 8774 | 5730 | 421 | 421 | 4.80% | 7.35% | 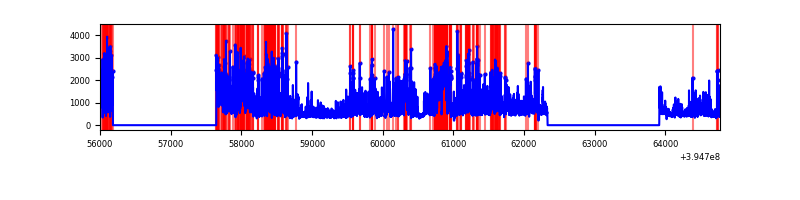 |
Top three noisy pixels from each quadrant. If the there are fewer than three noisy pixels in the level2.evt file, extra rows are filled as -1
| Pixel properties | Quadrant properties | ||||||
|---|---|---|---|---|---|---|---|
| Quadrant | DetID | PixID | Counts | Sigma | Mean | Median | Sigma |
| A | 10 | 83 | 207487 | 1570.92 | 656 | 643 | 131.7 |
| A | 15 | 223 | 45262 | 338.87 | 656 | 643 | 131.7 |
| A | 9 | 143 | 21379 | 157.48 | 656 | 643 | 131.7 |
| B | 0 | 190 | 66872 | 524.29 | 653 | 636 | 126.3 |
| B | 0 | 213 | 55680 | 435.7 | 653 | 636 | 126.3 |
| B | 4 | 171 | 30510 | 236.47 | 653 | 636 | 126.3 |
| C | 0 | 207 | 479987 | 3258.42 | 630 | 631 | 147.1 |
| C | 0 | 10 | 368621 | 2501.41 | 630 | 631 | 147.1 |
| C | 15 | 214 | 243907 | 1653.67 | 630 | 631 | 147.1 |
| D | 12 | 235 | 2313279 | 15286.21 | 621 | 603 | 151.3 |
| D | 2 | 250 | 191463 | 1261.54 | 621 | 603 | 151.3 |
| D | 13 | 249 | 88034 | 577.9 | 621 | 603 | 151.3 |
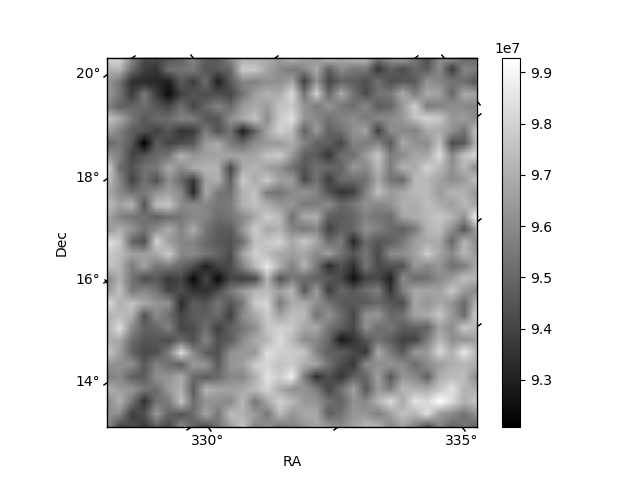
Histogram calculated using DETX and DETY for each event in the final _common_clean file
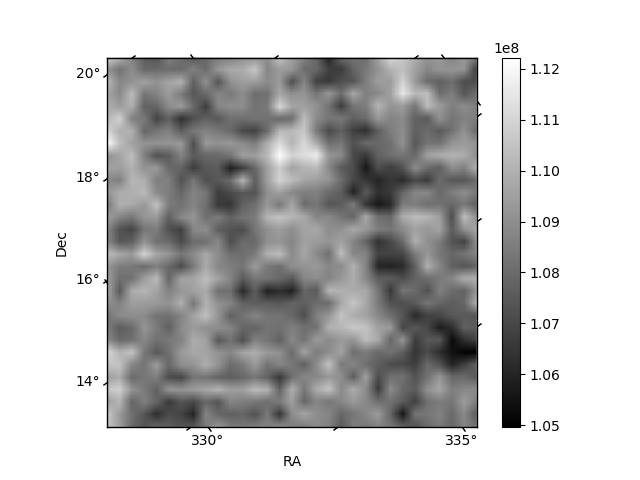
| Quadrant A |  |
 |
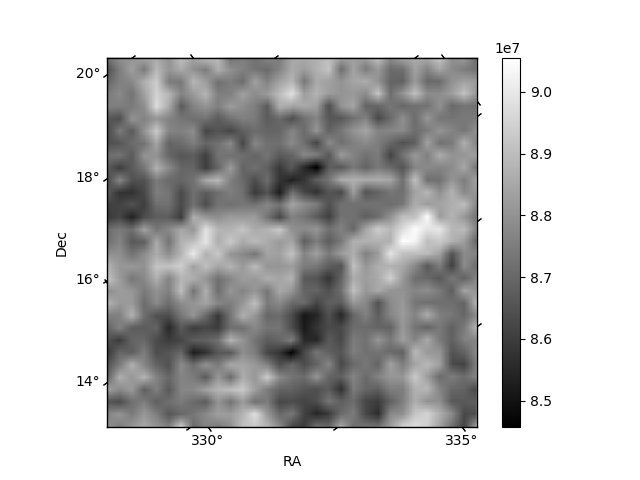
Quadrant B |
|---|---|---|---|
| Quadrant D |  |
 |
Quadrant C |
| Plot type | Count rate plots | Images |
|---|---|---|
| Comparison with Poisson distribution Blue bars denote a histogram of data divided into 1 sec bins. Red curve is a Poisson curve with rate = median count rate of data. |
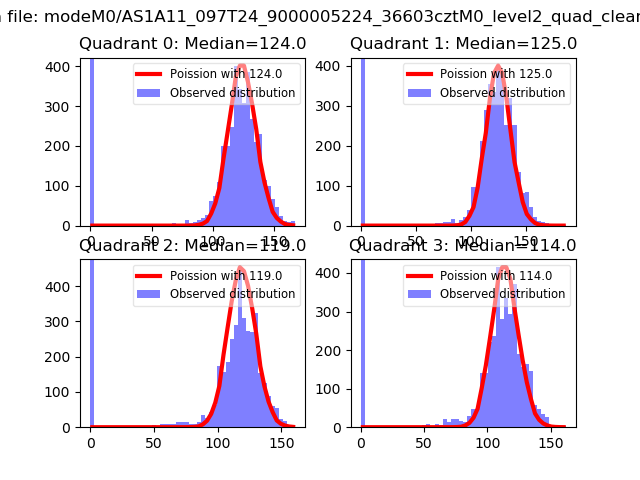 |
 |
| Quadrant-wise count rates Data is divided into 100 sec bins |
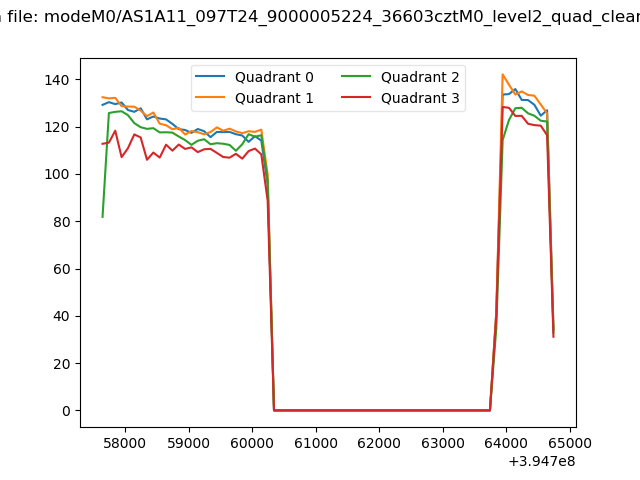 |
|
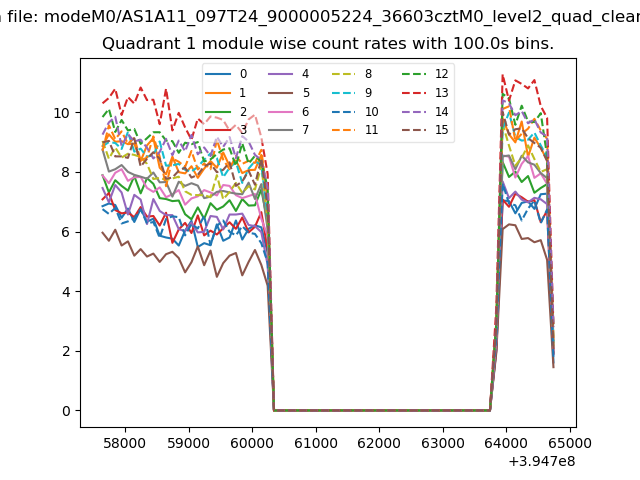
| Module-wise count rates for Quadrant A Data is divided into 100 sec bins |
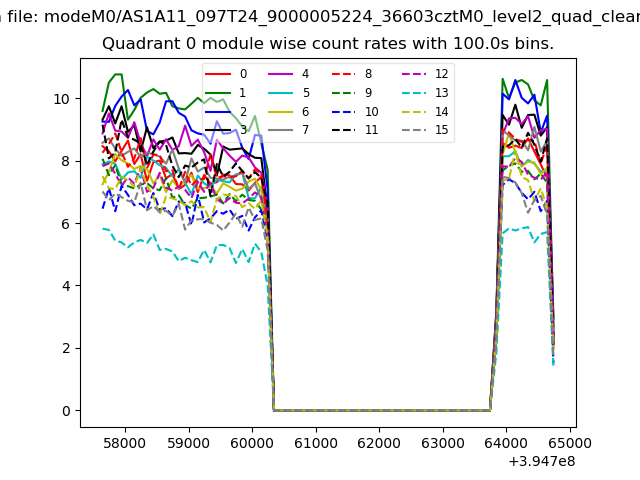 |
 |
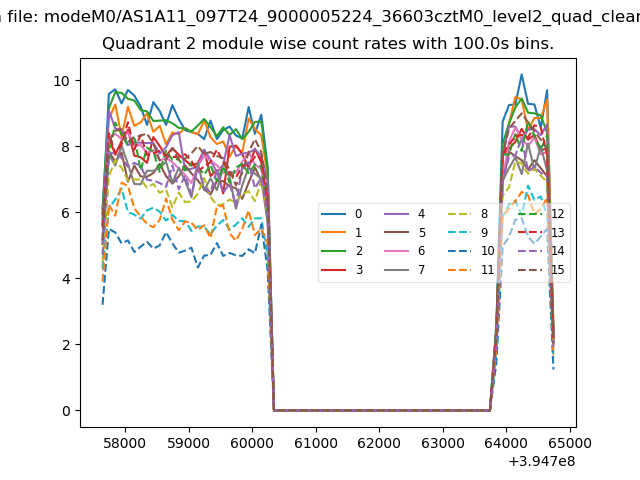
| Module-wise count rates for Quadrant B Data is divided into 100 sec bins |
 |
 |
| Module-wise count rates for Quadrant C Data is divided into 100 sec bins |
 |
 |
| Module-wise count rates for Quadrant D Data is divided into 100 sec bins |
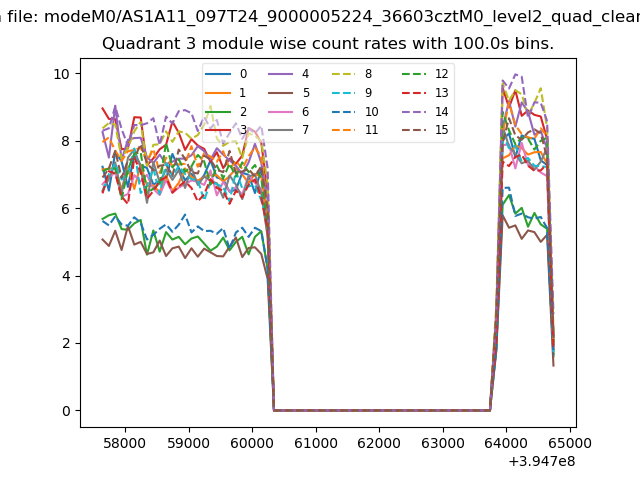 |
 |
| Parameter | Plot |
|---|---|
| CZT HV Monitor |  |
| D_VDD | 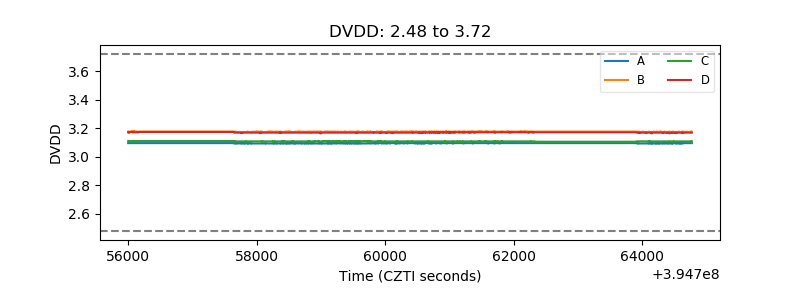 |
| Temperature 1 |  |
| Veto HV Monitor | 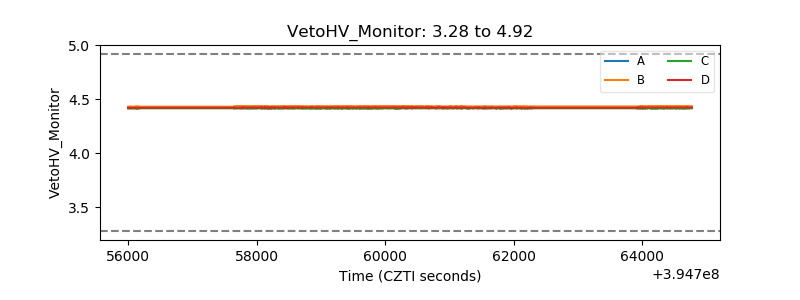 |
| Veto LLD | 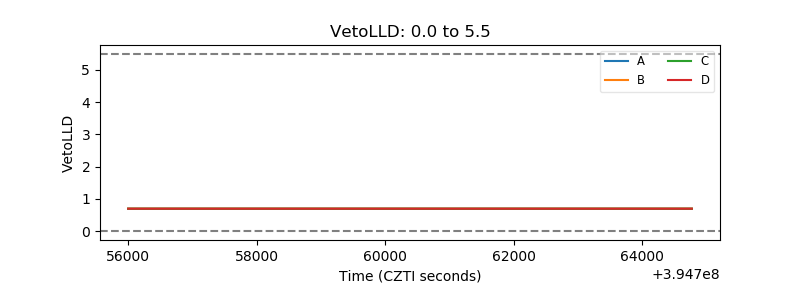 |
| Alpha Counter | 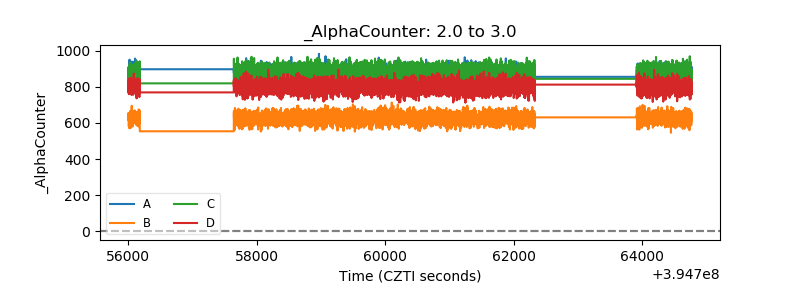 |
| _CPM_Rate | 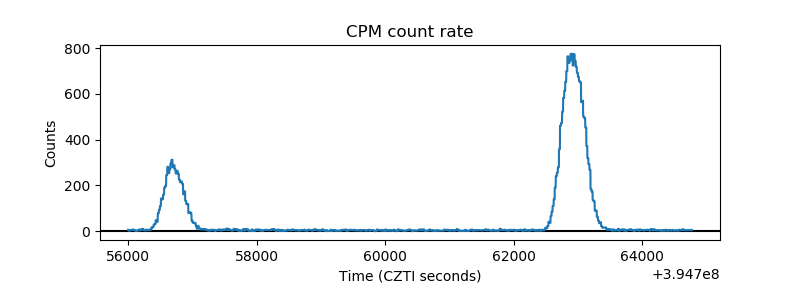 |
| CZT Counter |  |
| +2.5 Volts monitor |  |
| +5 Volts monitor |  |
| _ROLL_ROT | 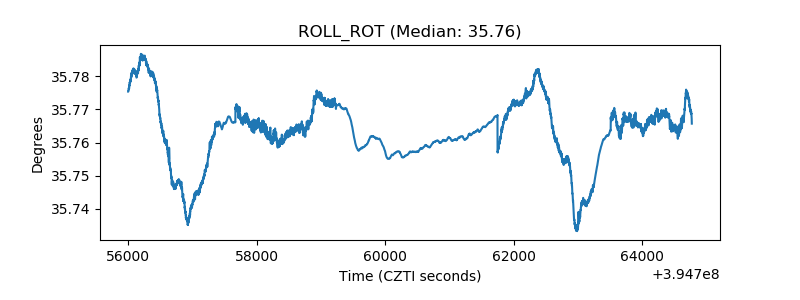 |
| _Roll_DEC | 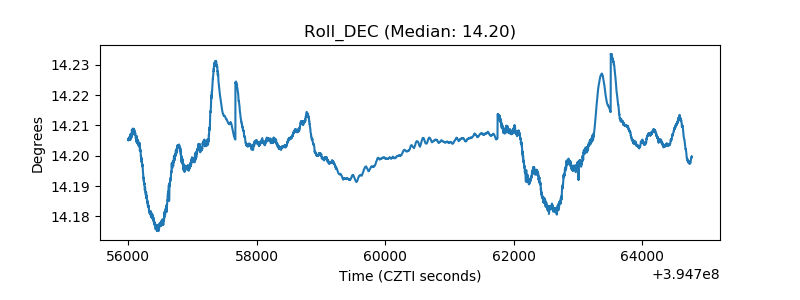 |
| _Roll_RA |  |
| Veto Counter | 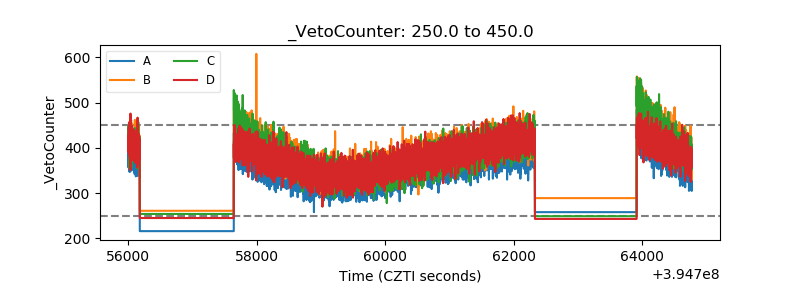 |