| Param | Original file | Final file |
|---|---|---|
| Filename | modeM0/AS1A11_097T24_9000005224_36604cztM0_level2.evt | modeM0/AS1A11_097T24_9000005224_36604cztM0_level2_quad_clean.evt |
| Size (bytes) | 417,778,560 | 64,422,720 |
| Size | 398.4 MB | 61.4 MB |
| Events in quadrant A | 2,669,097 | 403,317 |
| Events in quadrant B | 2,621,390 | 411,065 |
| Events in quadrant C | 3,212,151 | 379,041 |
| Events in quadrant D | 3,780,969 | 377,006 |
| Mode M0 | |||
|---|---|---|---|
| Quadrant | BADHDUFLAG | Total packets | Discarded packets |
| A | 0 | 11300 | 3 |
| B | 0 | 11279 | 2 |
| C | 0 | 12809 | 2 |
| D | 0 | 14908 | 2 |
| Mode M9 | |||
|---|---|---|---|
| Quadrant | BADHDUFLAG | Total packets | Discarded packets |
| A | 0 | 32 | 0 |
| B | 0 | 32 | 0 |
| C | 0 | 32 | 0 |
| D | 0 | 32 | 0 |
| Mode SS | |||
|---|---|---|---|
| Quadrant | BADHDUFLAG | Total packets | Discarded packets |
| A | 0 | 116 | 0 |
| B | 0 | 116 | 0 |
| C | 0 | 116 | 0 |
| D | 0 | 116 | 0 |
| Quadrant | Total seconds | Saturated seconds | Saturation percentage |
|---|---|---|---|
| A | 5417 | 10 | 0.184604% |
| B | 5417 | 12 | 0.221525% |
| C | 5417 | 156 | 2.879823% |
| D | 5417 | 89 | 1.642976% |
Noise dominated data is calculated using 1-second bins in cleaned event files. If a bin has >2000 counts, and if more than 50% of those come from <1% of pixels, then it is considered to be noise-dominated and hence unusable.
| Quadrant | # 1 sec bins | Bins with >0 counts | Bins with >2000 counts | High rate bins dominated by noise | Noise dominated (total time) | Noise dominated (detector-on time) | Marked lightcurve |
|---|---|---|---|---|---|---|---|
| A | 8733 | 5419 | 1 | 1 | 0.01% | 0.02% | 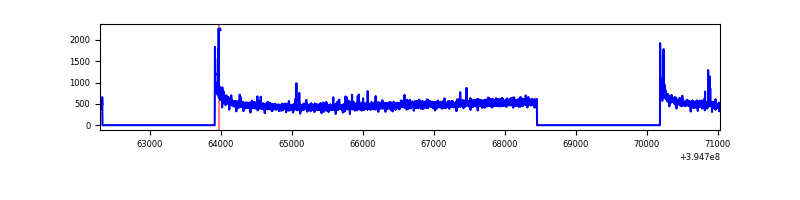 |
| B | 8733 | 5419 | 0 | 0 | 0.00% | 0.00% | 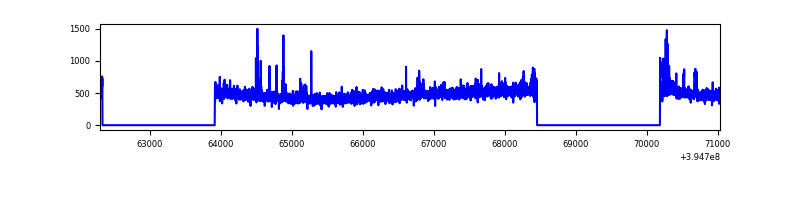 |
| C | 8733 | 5419 | 112 | 112 | 1.28% | 2.07% | 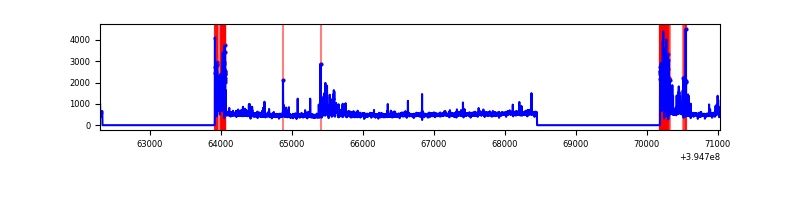 |
| D | 8733 | 5419 | 72 | 72 | 0.82% | 1.33% | 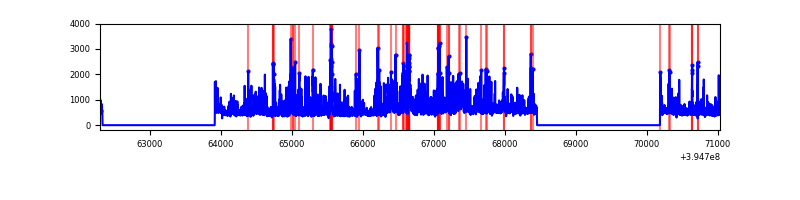 |
Top three noisy pixels from each quadrant. If the there are fewer than three noisy pixels in the level2.evt file, extra rows are filled as -1
| Pixel properties | Quadrant properties | ||||||
|---|---|---|---|---|---|---|---|
| Quadrant | DetID | PixID | Counts | Sigma | Mean | Median | Sigma |
| A | 10 | 83 | 201939 | 1592.85 | 629 | 616 | 126.4 |
| A | 9 | 143 | 21957 | 168.84 | 629 | 616 | 126.4 |
| A | 15 | 223 | 11196 | 83.7 | 629 | 616 | 126.4 |
| B | 0 | 213 | 56969 | 469.1 | 625 | 608 | 120.1 |
| B | 0 | 219 | 37414 | 306.34 | 625 | 608 | 120.1 |
| B | 0 | 190 | 35010 | 286.34 | 625 | 608 | 120.1 |
| C | 0 | 10 | 441490 | 3179.32 | 596 | 599 | 138.7 |
| C | 15 | 214 | 230041 | 1654.54 | 596 | 599 | 138.7 |
| C | 0 | 207 | 180042 | 1293.99 | 596 | 599 | 138.7 |
| D | 12 | 235 | 750105 | 5098.66 | 602 | 585 | 147.0 |
| D | 2 | 137 | 269083 | 1826.48 | 602 | 585 | 147.0 |
| D | 2 | 250 | 104438 | 706.47 | 602 | 585 | 147.0 |
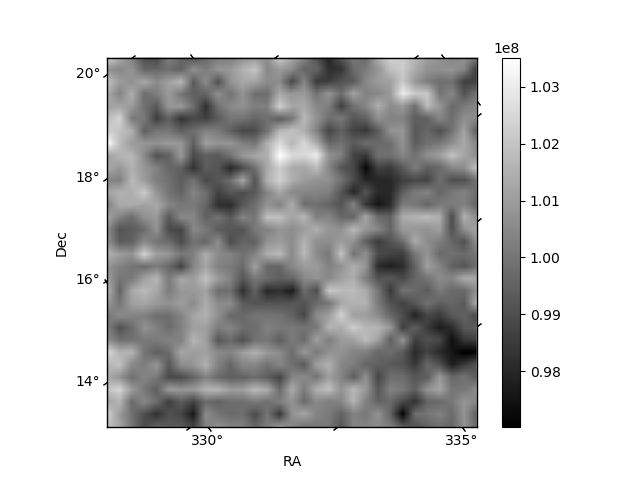
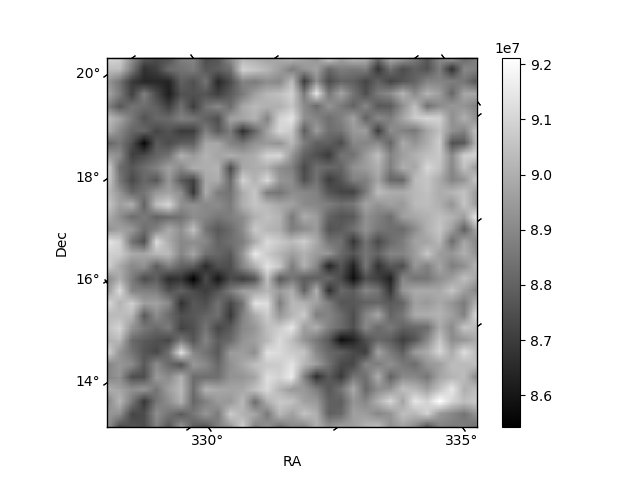
Histogram calculated using DETX and DETY for each event in the final _common_clean file
| Quadrant A | 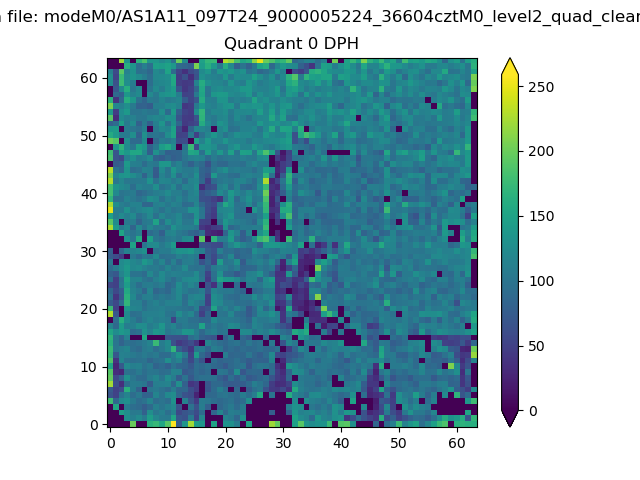 |
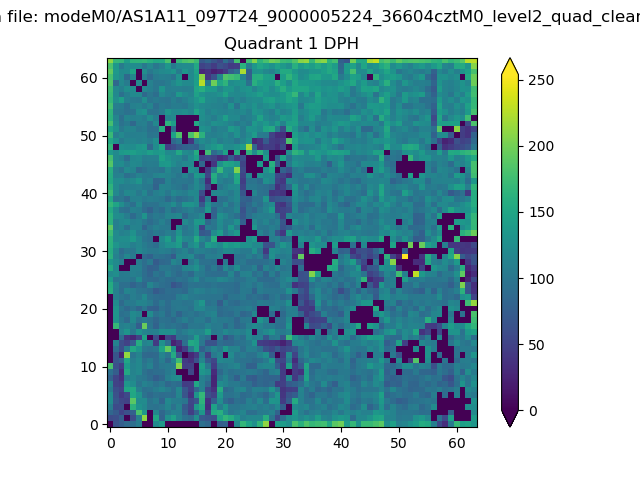 |
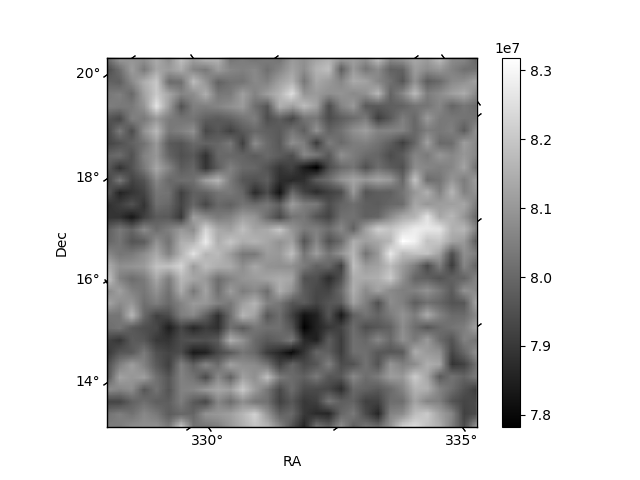
Quadrant B |
|---|---|---|---|
| Quadrant D | 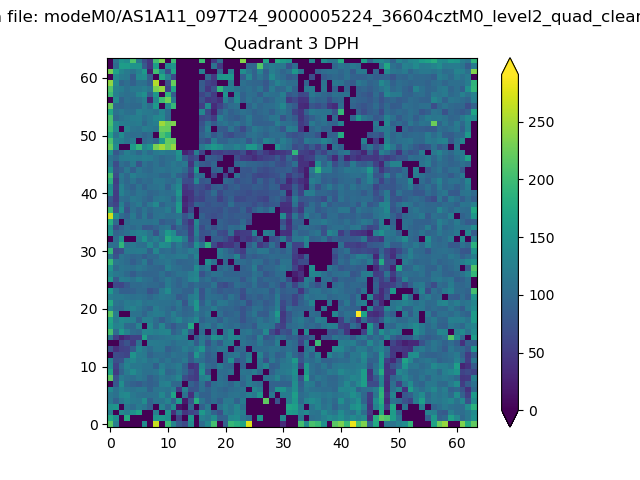 |
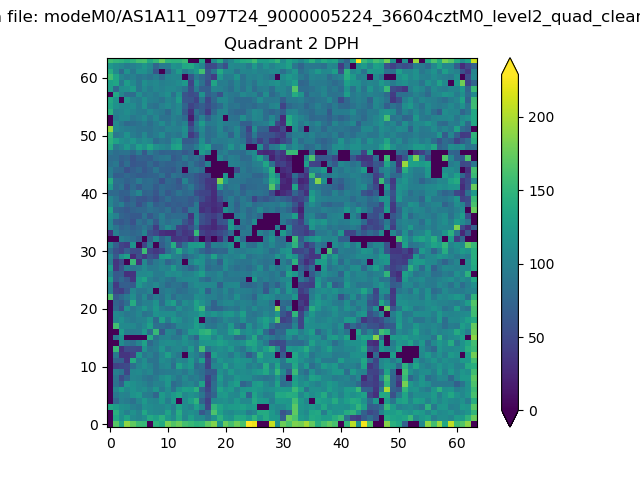 |
Quadrant C |
| Plot type | Count rate plots | Images |
|---|---|---|
| Comparison with Poisson distribution Blue bars denote a histogram of data divided into 1 sec bins. Red curve is a Poisson curve with rate = median count rate of data. |
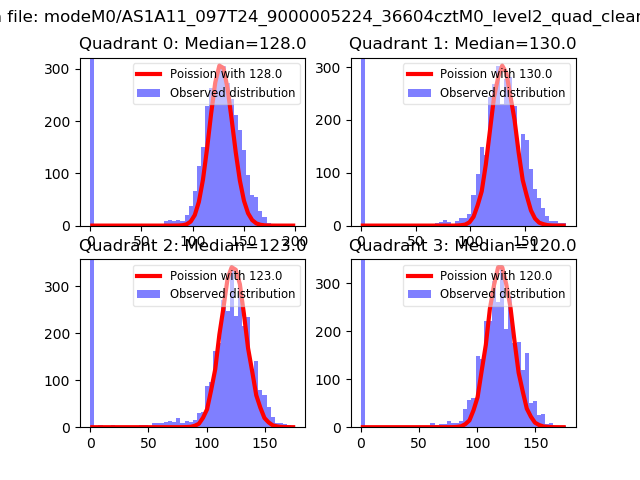 |
 |
| Quadrant-wise count rates Data is divided into 100 sec bins |
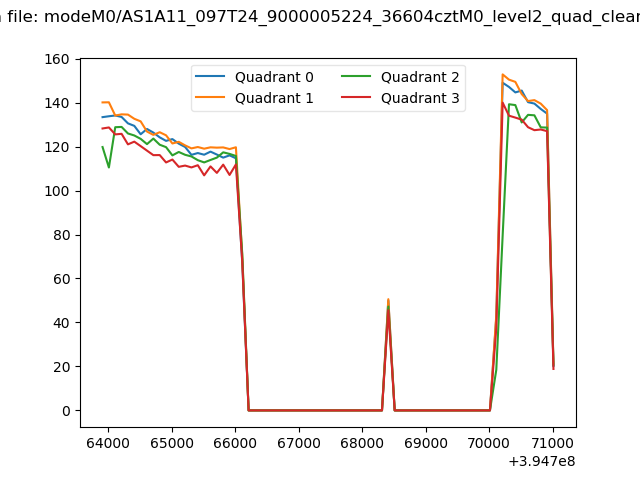 |
|
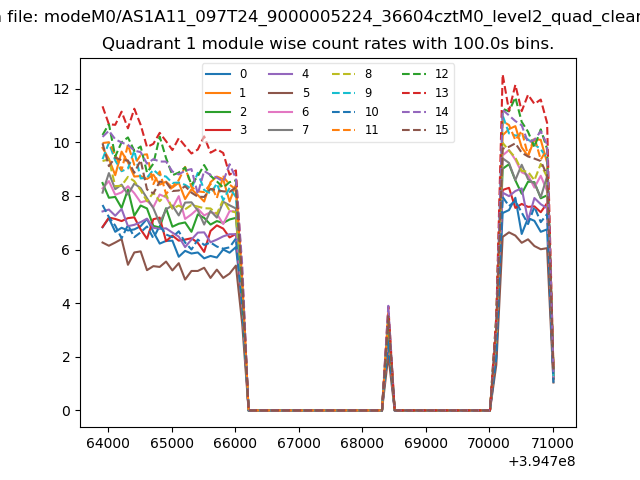
| Module-wise count rates for Quadrant A Data is divided into 100 sec bins |
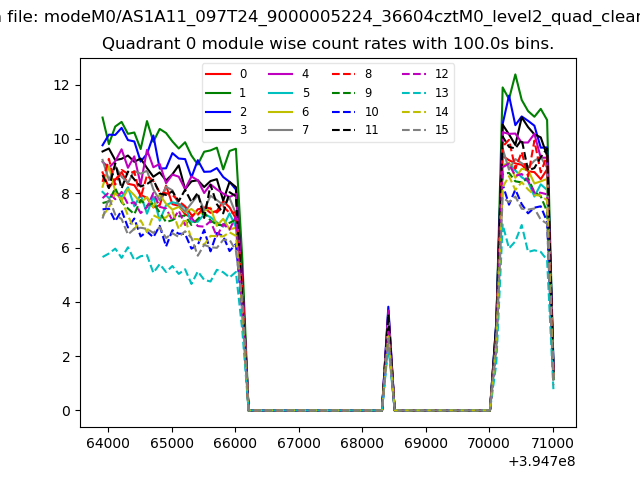 |
 |
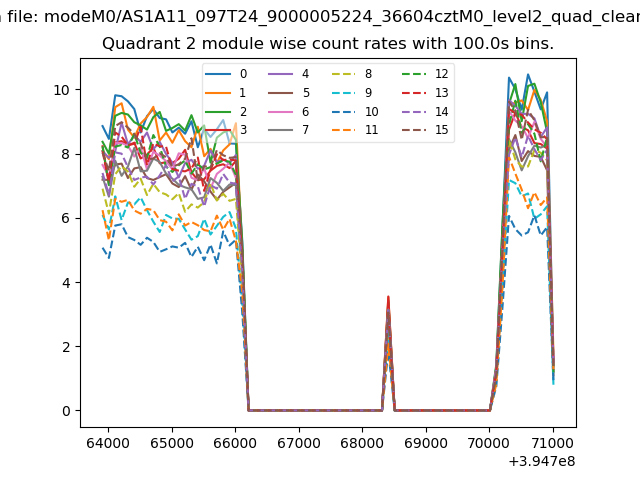
| Module-wise count rates for Quadrant B Data is divided into 100 sec bins |
 |
 |
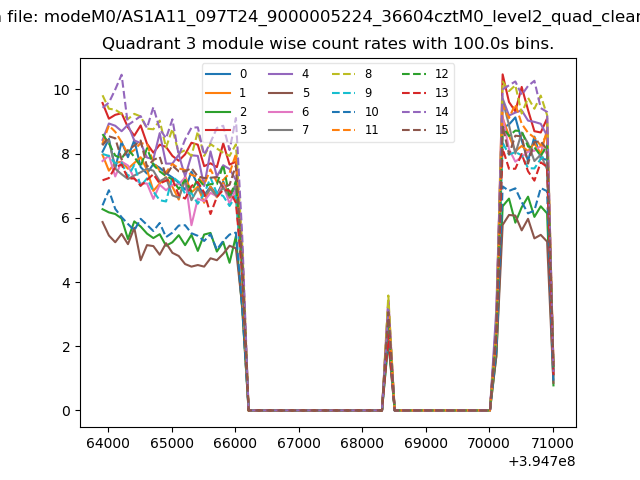
| Module-wise count rates for Quadrant C Data is divided into 100 sec bins |
 |
 |
| Module-wise count rates for Quadrant D Data is divided into 100 sec bins |
 |
 |
| Parameter | Plot |
|---|---|
| CZT HV Monitor | 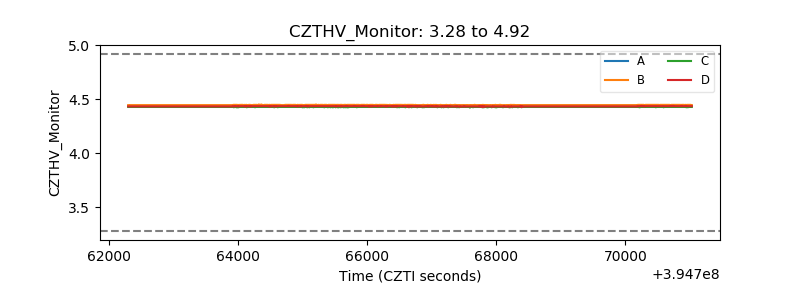 |
| D_VDD | 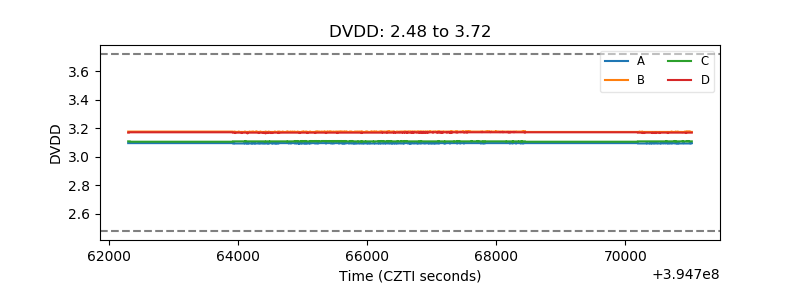 |
| Temperature 1 | 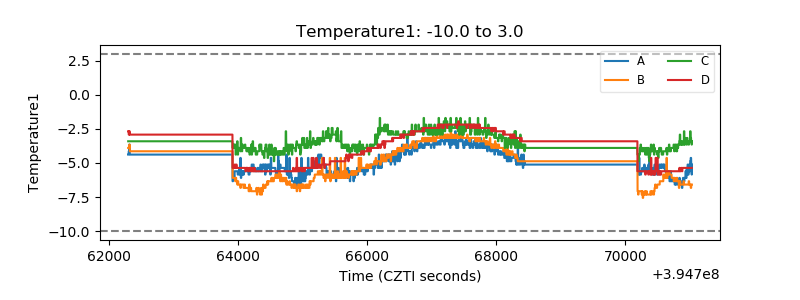 |
| Veto HV Monitor | 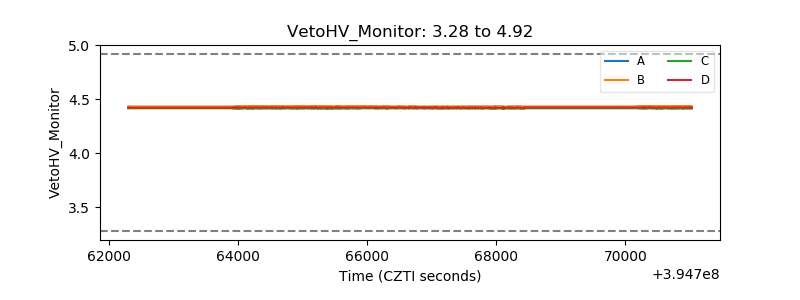 |
| Veto LLD | 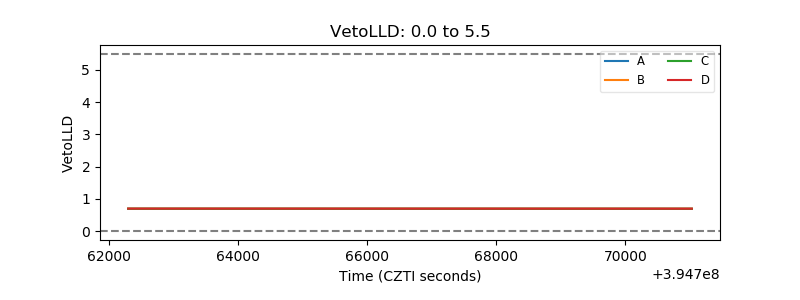 |
| Alpha Counter | 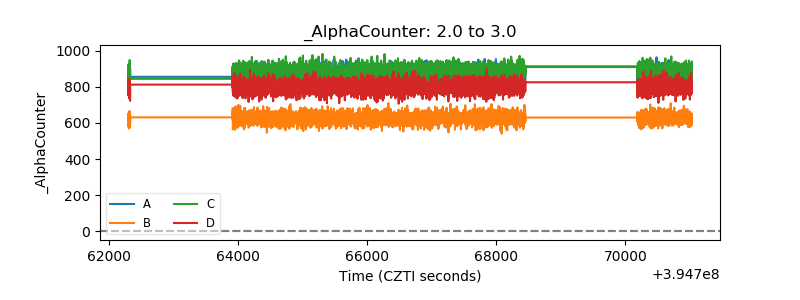 |
| _CPM_Rate | 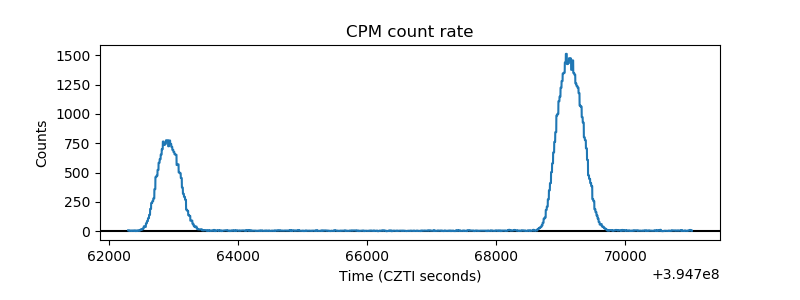 |
| CZT Counter | 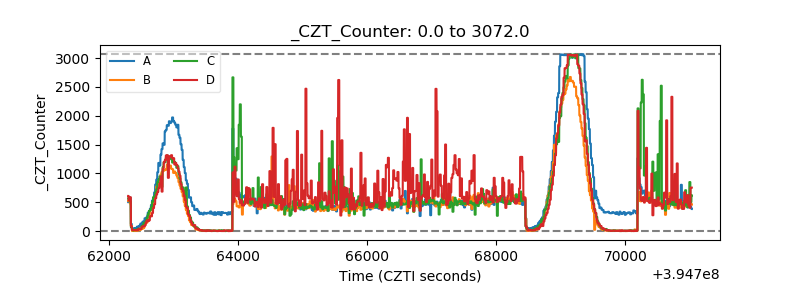 |
| +2.5 Volts monitor |  |
| +5 Volts monitor |  |
| _ROLL_ROT | 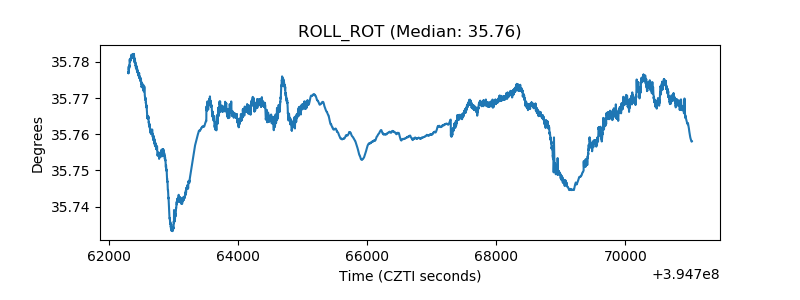 |
| _Roll_DEC | 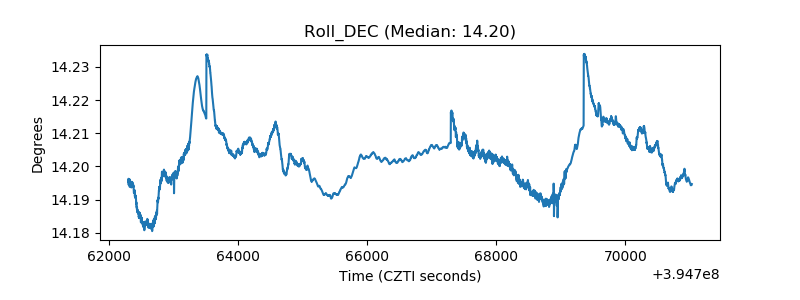 |
| _Roll_RA |  |
| Veto Counter | 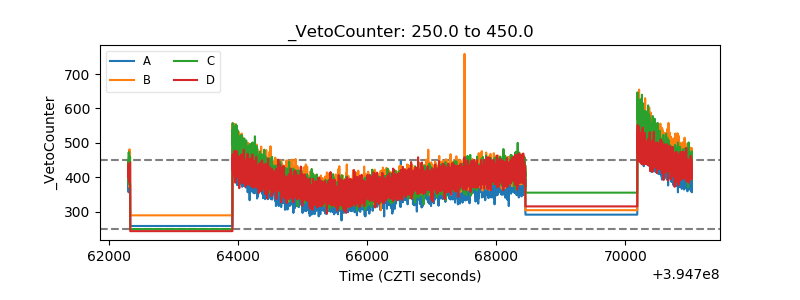 |