| Param | Original file | Final file |
|---|---|---|
| Filename | modeM0/AS1A11_097T24_9000005224_36606cztM0_level2.evt | modeM0/AS1A11_097T24_9000005224_36606cztM0_level2_quad_clean.evt |
| Size (bytes) | 462,435,840 | 70,211,520 |
| Size | 441.0 MB | 67.0 MB |
| Events in quadrant A | 2,812,115 | 451,614 |
| Events in quadrant B | 3,032,171 | 456,648 |
| Events in quadrant C | 3,507,133 | 418,388 |
| Events in quadrant D | 4,282,233 | 416,364 |
| Mode M0 | |||
|---|---|---|---|
| Quadrant | BADHDUFLAG | Total packets | Discarded packets |
| A | 0 | 11570 | 3 |
| B | 0 | 12446 | 2 |
| C | 0 | 13812 | 2 |
| D | 0 | 16448 | 2 |
| Mode M9 | |||
|---|---|---|---|
| Quadrant | BADHDUFLAG | Total packets | Discarded packets |
| A | 0 | 31 | 0 |
| B | 0 | 31 | 0 |
| C | 0 | 31 | 0 |
| D | 0 | 32 | 0 |
| Mode SS | |||
|---|---|---|---|
| Quadrant | BADHDUFLAG | Total packets | Discarded packets |
| A | 0 | 110 | 0 |
| B | 0 | 110 | 0 |
| C | 0 | 110 | 0 |
| D | 0 | 110 | 0 |
| Quadrant | Total seconds | Saturated seconds | Saturation percentage |
|---|---|---|---|
| A | 5475 | 8 | 0.146119% |
| B | 5475 | 55 | 1.004566% |
| C | 5475 | 199 | 3.634703% |
| D | 5475 | 290 | 5.296804% |
Noise dominated data is calculated using 1-second bins in cleaned event files. If a bin has >2000 counts, and if more than 50% of those come from <1% of pixels, then it is considered to be noise-dominated and hence unusable.
| Quadrant | # 1 sec bins | Bins with >0 counts | Bins with >2000 counts | High rate bins dominated by noise | Noise dominated (total time) | Noise dominated (detector-on time) | Marked lightcurve |
|---|---|---|---|---|---|---|---|
| A | 7328 | 5476 | 1 | 1 | 0.01% | 0.02% | 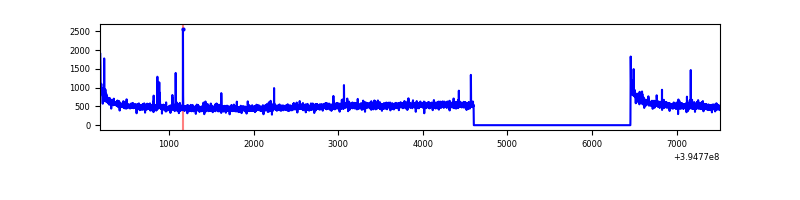 |
| B | 7328 | 5476 | 34 | 34 | 0.46% | 0.62% |  |
| C | 7328 | 5476 | 151 | 151 | 2.06% | 2.76% | 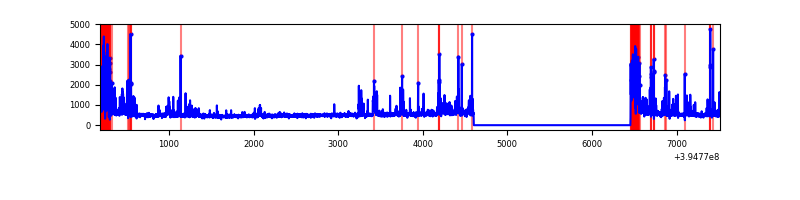 |
| D | 7328 | 5476 | 236 | 236 | 3.22% | 4.31% | 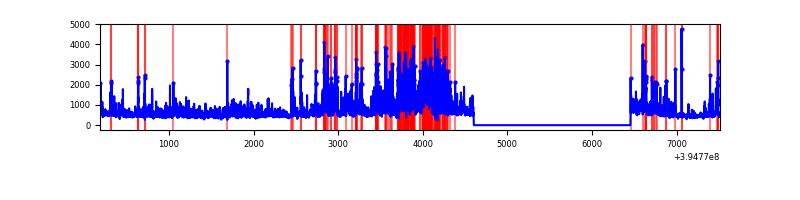 |
Top three noisy pixels from each quadrant. If the there are fewer than three noisy pixels in the level2.evt file, extra rows are filled as -1
| Pixel properties | Quadrant properties | ||||||
|---|---|---|---|---|---|---|---|
| Quadrant | DetID | PixID | Counts | Sigma | Mean | Median | Sigma |
| A | 10 | 83 | 200658 | 1518.48 | 660 | 651 | 131.7 |
| A | 9 | 143 | 27974 | 207.44 | 660 | 651 | 131.7 |
| A | 15 | 223 | 18388 | 134.66 | 660 | 651 | 131.7 |
| B | 0 | 213 | 283922 | 2274.05 | 651 | 636 | 124.6 |
| B | 5 | 255 | 105155 | 839.02 | 651 | 636 | 124.6 |
| B | 4 | 171 | 20664 | 160.77 | 651 | 636 | 124.6 |
| C | 0 | 10 | 425140 | 2980.25 | 616 | 620 | 142.4 |
| C | 0 | 207 | 346798 | 2430.27 | 616 | 620 | 142.4 |
| C | 15 | 214 | 232720 | 1629.41 | 616 | 620 | 142.4 |
| D | 12 | 235 | 1075582 | 7104.03 | 621 | 602 | 151.3 |
| D | 2 | 250 | 329561 | 2173.93 | 621 | 602 | 151.3 |
| D | 13 | 249 | 137470 | 904.5 | 621 | 602 | 151.3 |
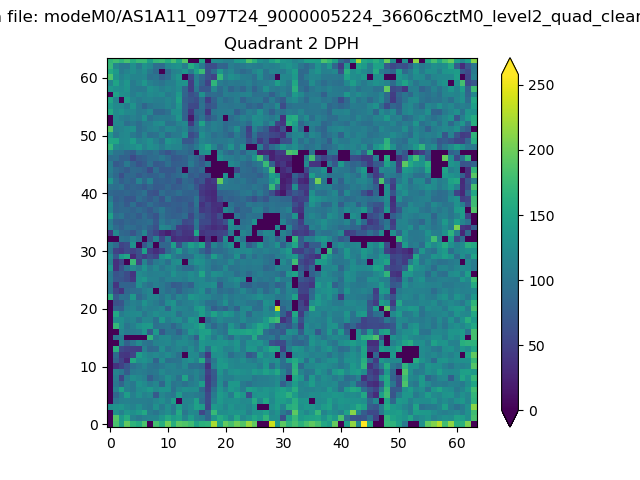
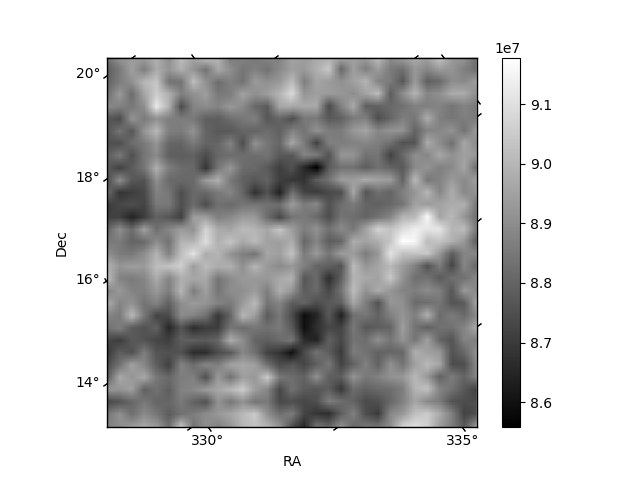
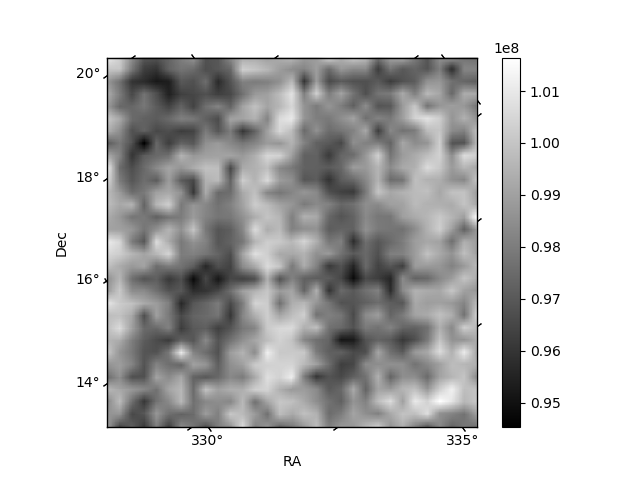
Histogram calculated using DETX and DETY for each event in the final _common_clean file
| Quadrant A | 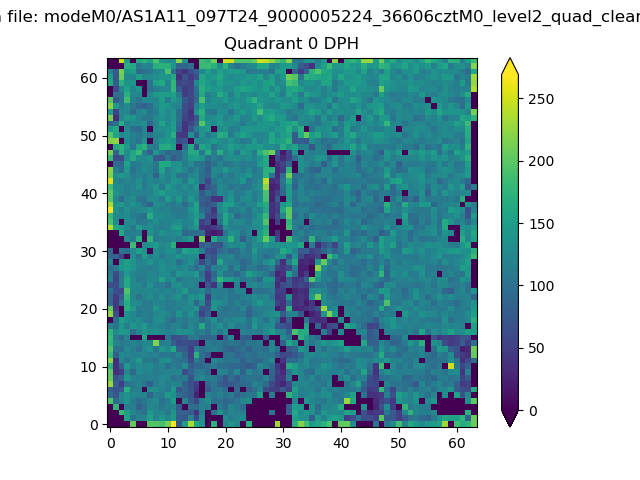 |
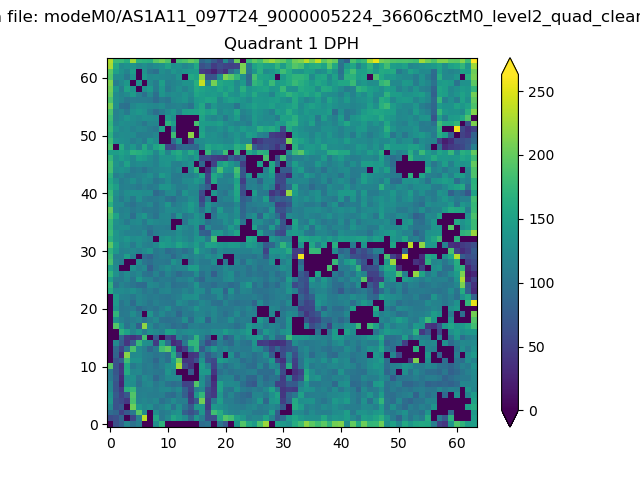 |
Quadrant B |
|---|---|---|---|
| Quadrant D | 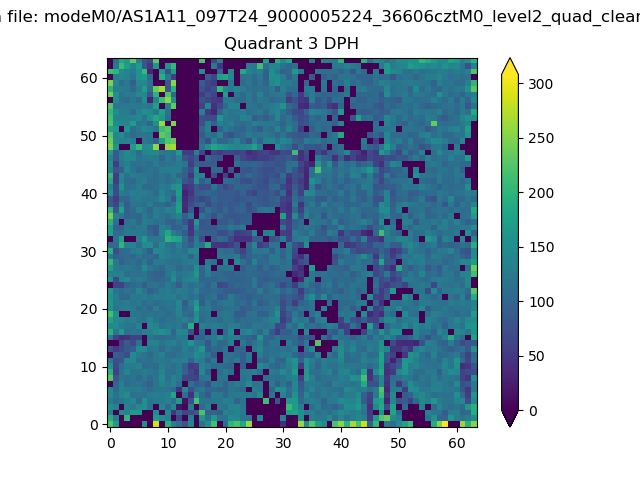 |
 |
Quadrant C |
| Plot type | Count rate plots | Images |
|---|---|---|
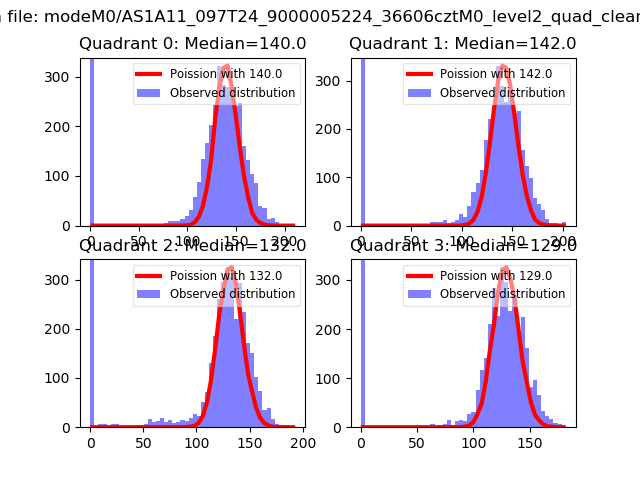
| Comparison with Poisson distribution Blue bars denote a histogram of data divided into 1 sec bins. Red curve is a Poisson curve with rate = median count rate of data. |
 |
 |
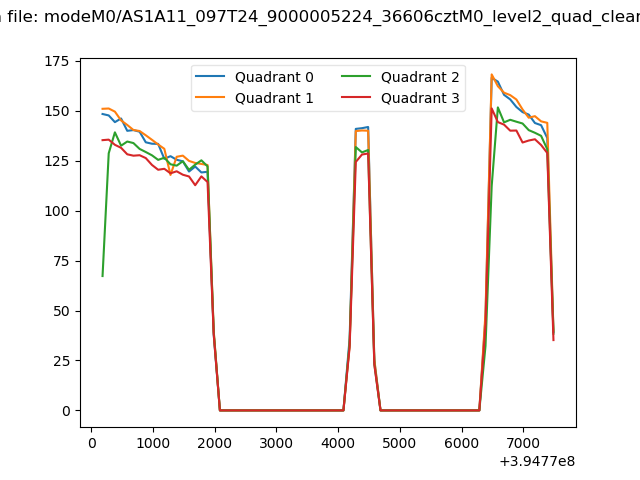
| Quadrant-wise count rates Data is divided into 100 sec bins |
 |
|
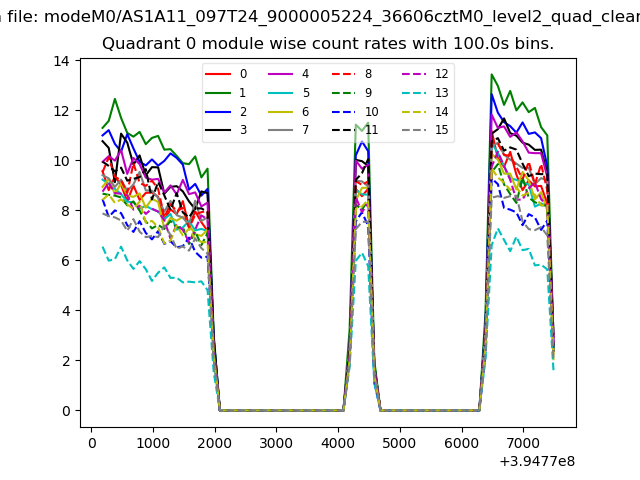
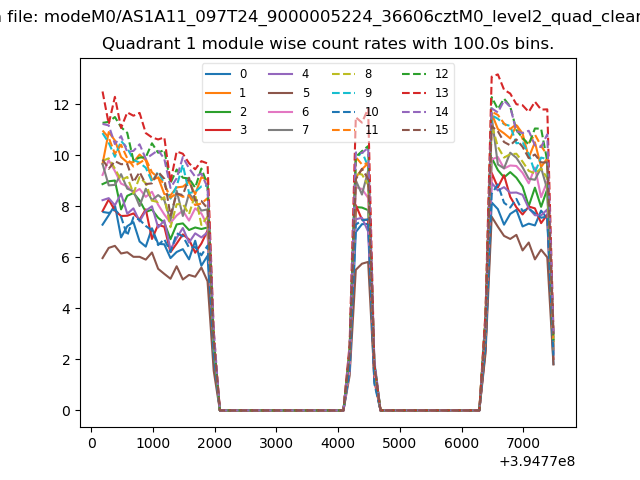
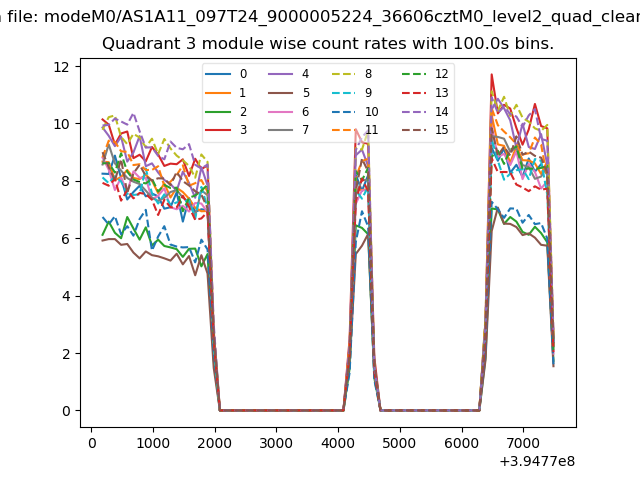
| Module-wise count rates for Quadrant A Data is divided into 100 sec bins |
 |
 |
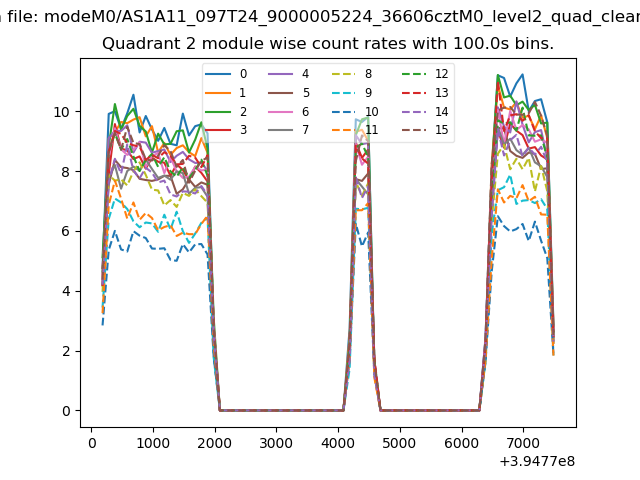
| Module-wise count rates for Quadrant B Data is divided into 100 sec bins |
 |
 |
| Module-wise count rates for Quadrant C Data is divided into 100 sec bins |
 |
 |
| Module-wise count rates for Quadrant D Data is divided into 100 sec bins |
 |
 |
| Parameter | Plot |
|---|---|
| CZT HV Monitor | 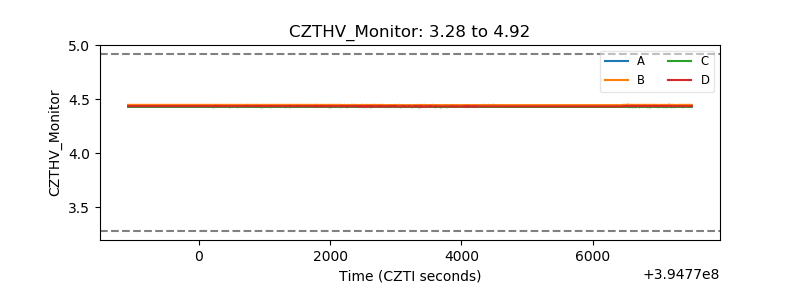 |
| D_VDD | 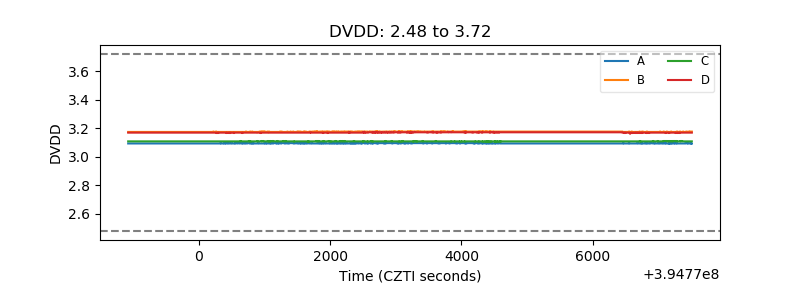 |
| Temperature 1 | 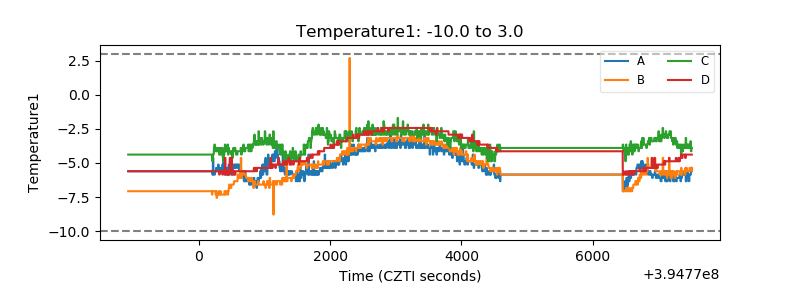 |
| Veto HV Monitor | 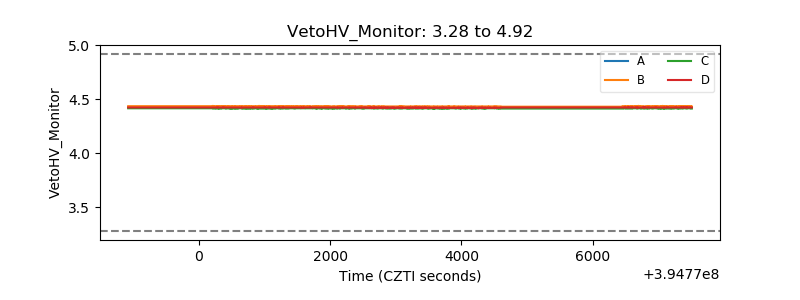 |
| Veto LLD | 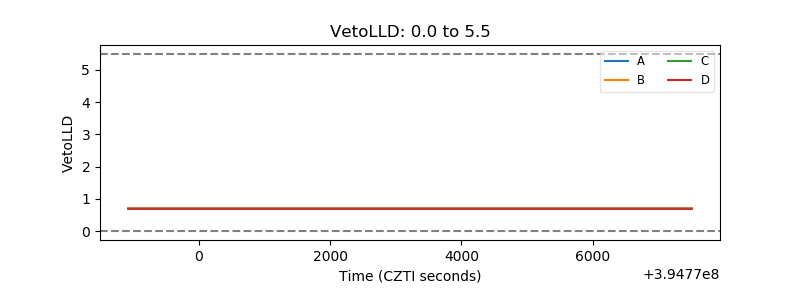 |
| Alpha Counter | 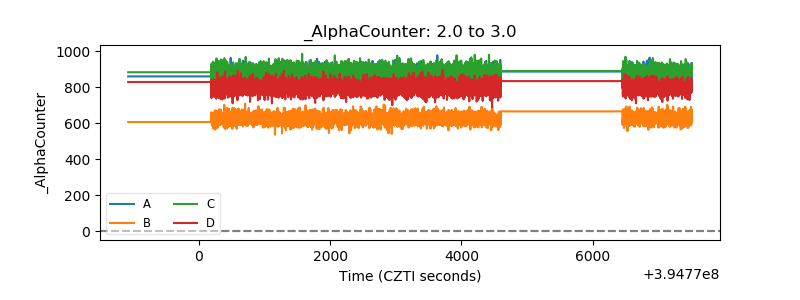 |
| _CPM_Rate | 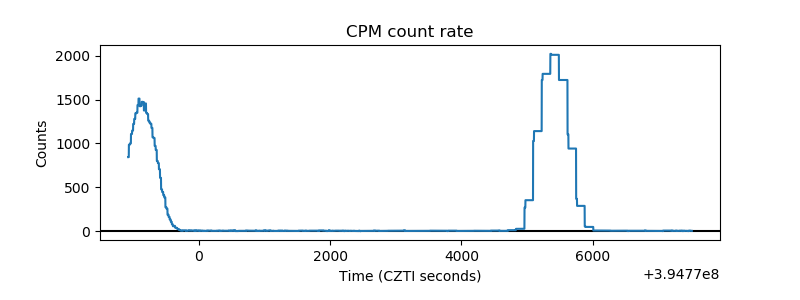 |
| CZT Counter | 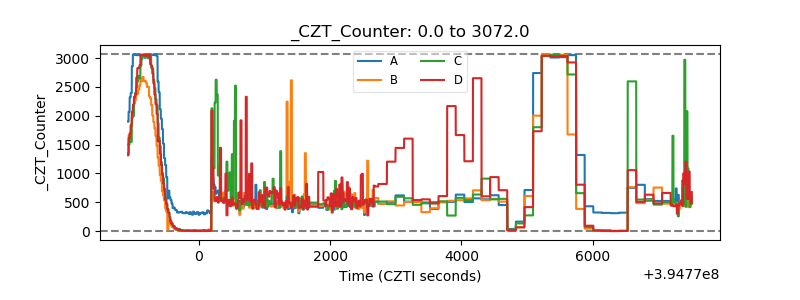 |
| +2.5 Volts monitor | 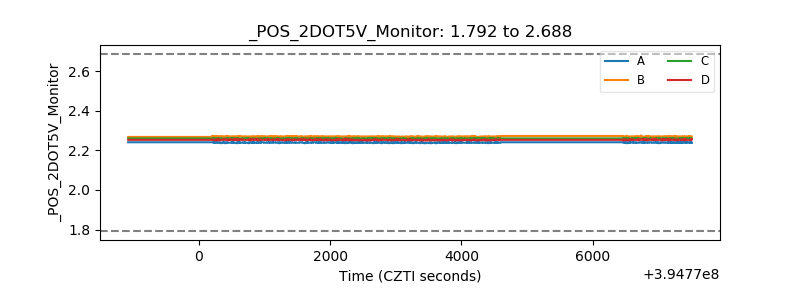 |
| +5 Volts monitor |  |
| _ROLL_ROT | 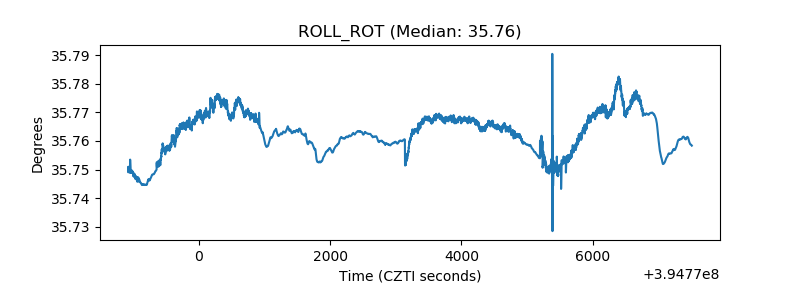 |
| _Roll_DEC | 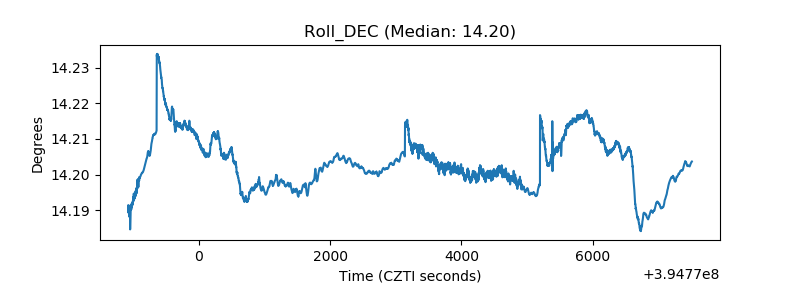 |
| _Roll_RA | 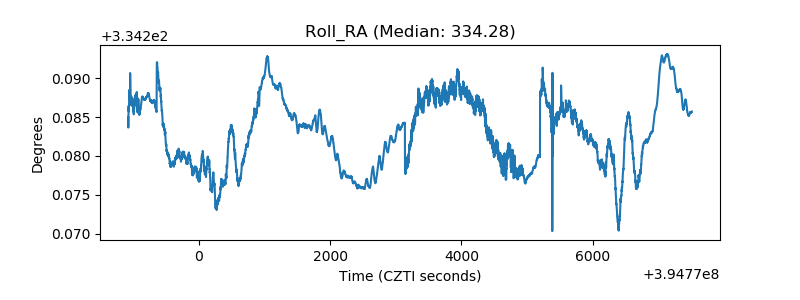 |
| Veto Counter | 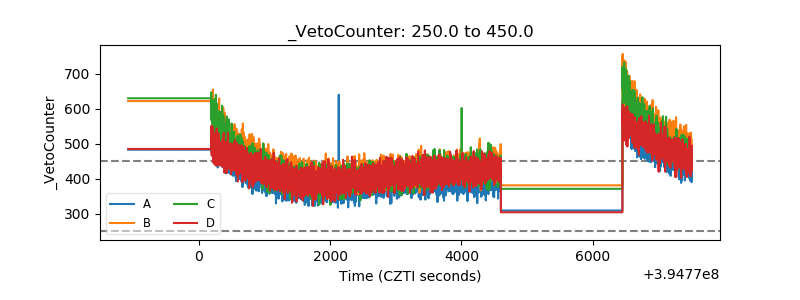 |