| Param | Original file | Final file |
|---|---|---|
| Filename | modeM0/AS1A11_097T24_9000005224_36607cztM0_level2.evt | modeM0/AS1A11_097T24_9000005224_36607cztM0_level2_quad_clean.evt |
| Size (bytes) | 350,173,440 | 44,357,760 |
| Size | 334.0 MB | 42.3 MB |
| Events in quadrant A | 2,138,565 | 272,035 |
| Events in quadrant B | 2,224,052 | 275,577 |
| Events in quadrant C | 2,289,419 | 260,202 |
| Events in quadrant D | 3,672,350 | 244,254 |
| Mode M0 | |||
|---|---|---|---|
| Quadrant | BADHDUFLAG | Total packets | Discarded packets |
| A | 0 | 8586 | 0 |
| B | 0 | 9091 | 0 |
| C | 0 | 9133 | 0 |
| D | 0 | 13735 | 0 |
| Mode SS | |||
|---|---|---|---|
| Quadrant | BADHDUFLAG | Total packets | Discarded packets |
| A | 0 | 82 | 0 |
| B | 0 | 82 | 0 |
| C | 0 | 82 | 0 |
| D | 0 | 82 | 0 |
| Quadrant | Total seconds | Saturated seconds | Saturation percentage |
|---|---|---|---|
| A | 4125 | 7 | 0.169697% |
| B | 4125 | 18 | 0.436364% |
| C | 4125 | 25 | 0.606061% |
| D | 4125 | 286 | 6.933333% |
Noise dominated data is calculated using 1-second bins in cleaned event files. If a bin has >2000 counts, and if more than 50% of those come from <1% of pixels, then it is considered to be noise-dominated and hence unusable.
| Quadrant | # 1 sec bins | Bins with >0 counts | Bins with >2000 counts | High rate bins dominated by noise | Noise dominated (total time) | Noise dominated (detector-on time) | Marked lightcurve |
|---|---|---|---|---|---|---|---|
| A | 4125 | 4125 | 5 | 5 | 0.12% | 0.12% | 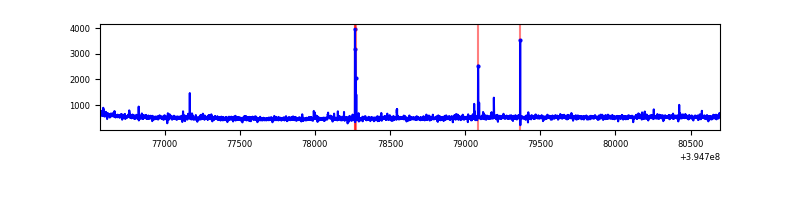 |
| B | 4125 | 4125 | 12 | 12 | 0.29% | 0.29% | 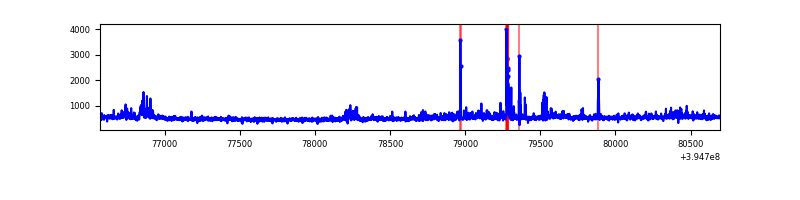 |
| C | 4125 | 4125 | 19 | 19 | 0.46% | 0.46% | 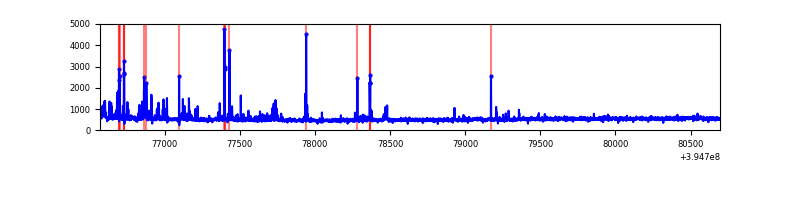 |
| D | 4125 | 4125 | 257 | 257 | 6.23% | 6.23% | 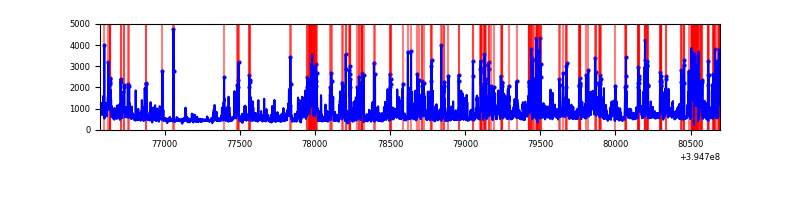 |
Top three noisy pixels from each quadrant. If the there are fewer than three noisy pixels in the level2.evt file, extra rows are filled as -1
| Pixel properties | Quadrant properties | ||||||
|---|---|---|---|---|---|---|---|
| Quadrant | DetID | PixID | Counts | Sigma | Mean | Median | Sigma |
| A | 10 | 83 | 90035 | 863.75 | 516 | 508 | 103.6 |
| A | 15 | 223 | 27954 | 264.8 | 516 | 508 | 103.6 |
| A | 9 | 143 | 23658 | 223.35 | 516 | 508 | 103.6 |
| B | 0 | 213 | 155812 | 1598.34 | 506 | 494 | 97.2 |
| B | 5 | 172 | 32395 | 328.29 | 506 | 494 | 97.2 |
| B | 0 | 190 | 15669 | 156.16 | 506 | 494 | 97.2 |
| C | 15 | 214 | 172976 | 1523.72 | 487 | 491 | 113.2 |
| C | 0 | 207 | 118937 | 1046.34 | 487 | 491 | 113.2 |
| C | 14 | 254 | 59261 | 519.17 | 487 | 491 | 113.2 |
| D | 12 | 235 | 1532555 | 12932.05 | 483 | 471 | 118.5 |
| D | 2 | 249 | 77430 | 649.6 | 483 | 471 | 118.5 |
| D | 2 | 137 | 36620 | 305.13 | 483 | 471 | 118.5 |
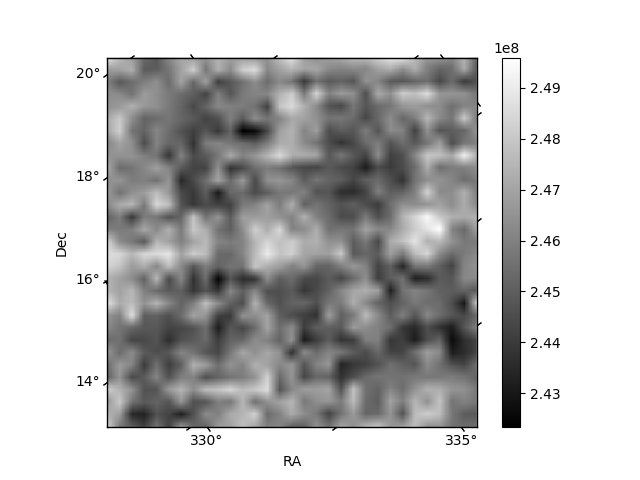
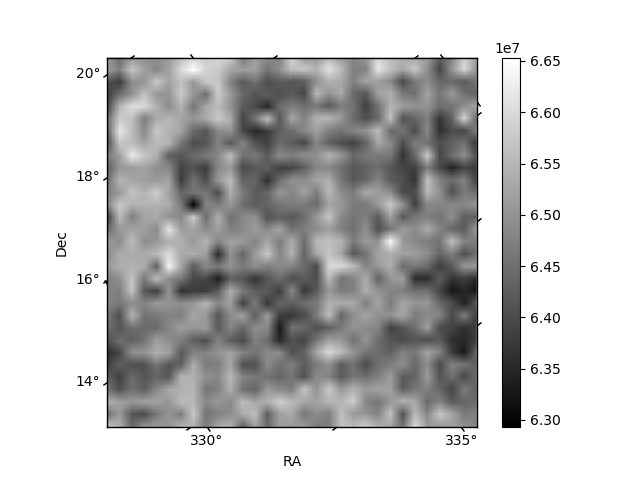
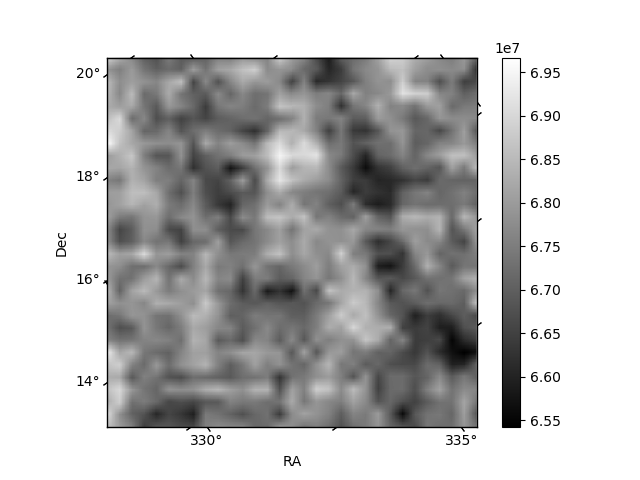
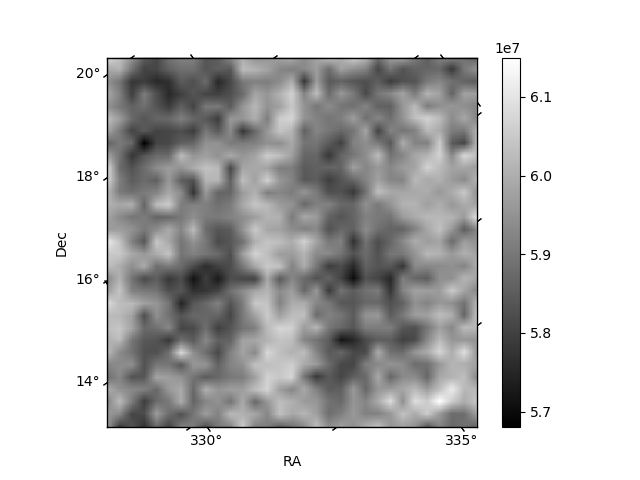
Histogram calculated using DETX and DETY for each event in the final _common_clean file
| Quadrant A | 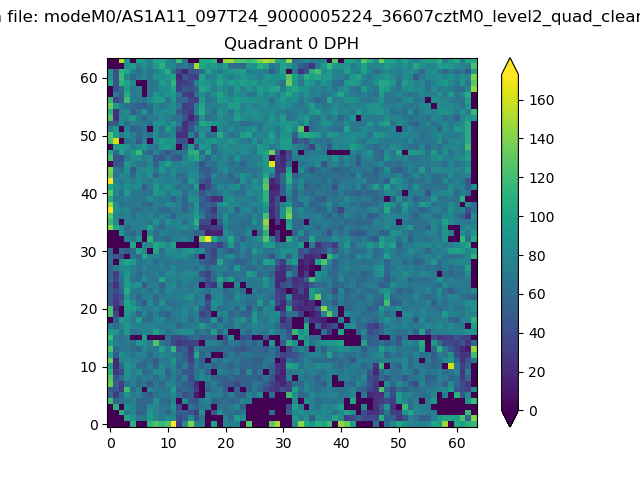 |
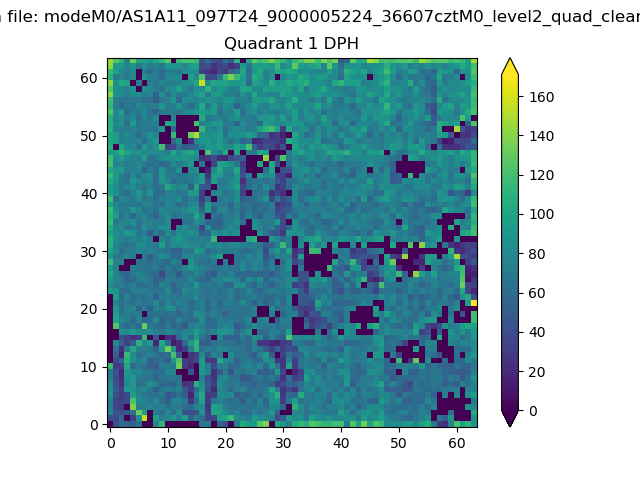 |
Quadrant B |
|---|---|---|---|
| Quadrant D | 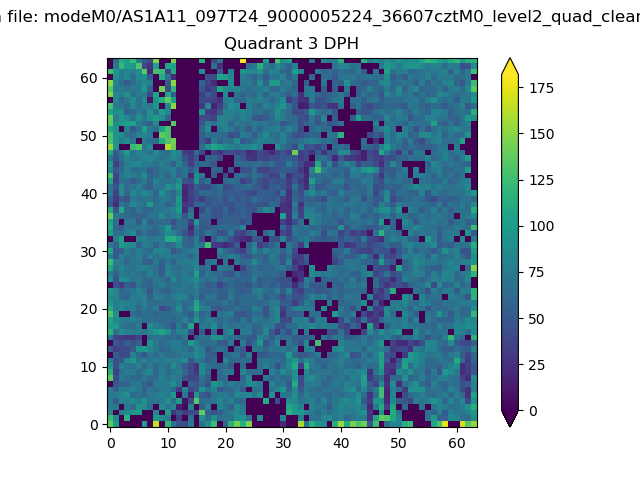 |
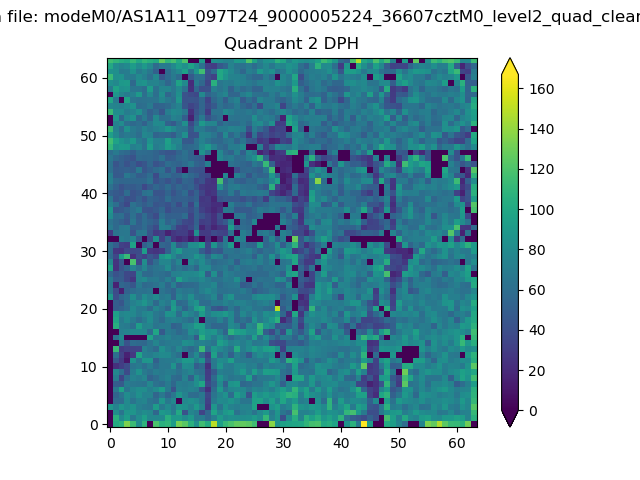 |
Quadrant C |
| Plot type | Count rate plots | Images |
|---|---|---|
| Comparison with Poisson distribution Blue bars denote a histogram of data divided into 1 sec bins. Red curve is a Poisson curve with rate = median count rate of data. |
 |
 |
| Quadrant-wise count rates Data is divided into 100 sec bins |
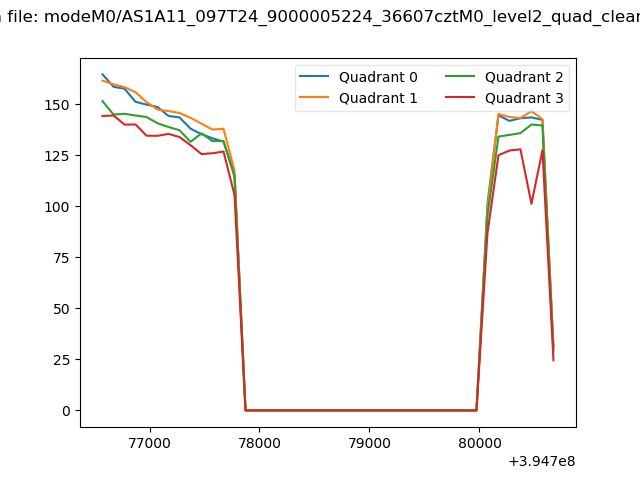 |
|
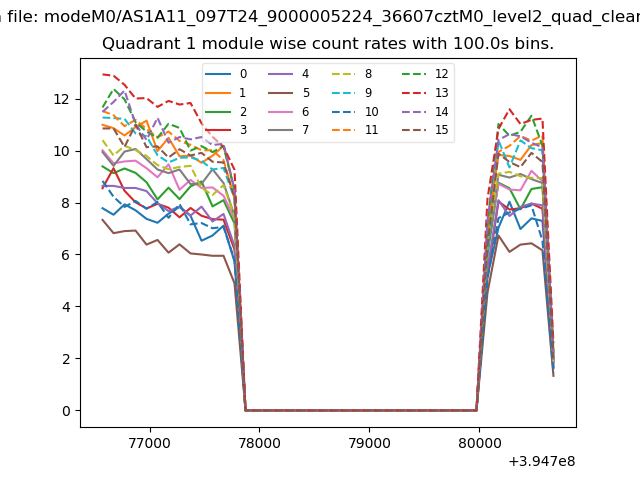
| Module-wise count rates for Quadrant A Data is divided into 100 sec bins |
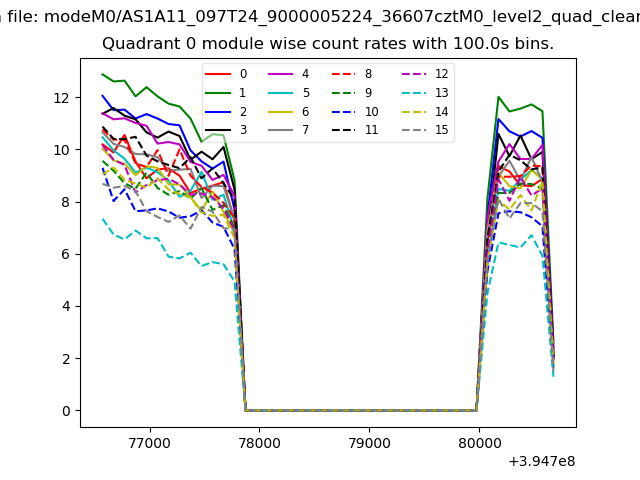 |
 |
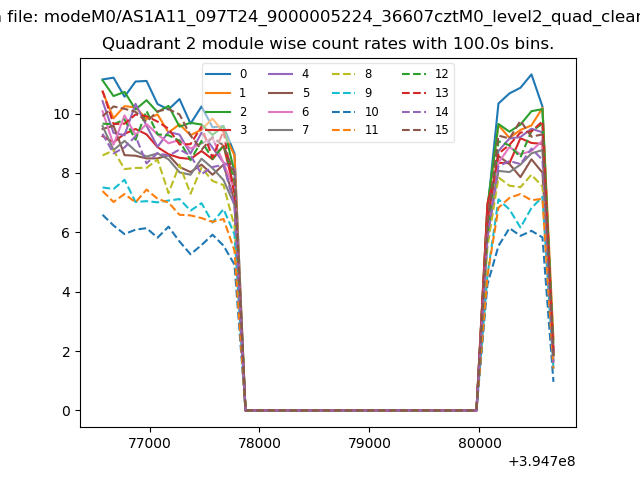
| Module-wise count rates for Quadrant B Data is divided into 100 sec bins |
 |
 |
| Module-wise count rates for Quadrant C Data is divided into 100 sec bins |
 |
 |
| Module-wise count rates for Quadrant D Data is divided into 100 sec bins |
 |
 |
| Parameter | Plot |
|---|---|
| CZT HV Monitor | 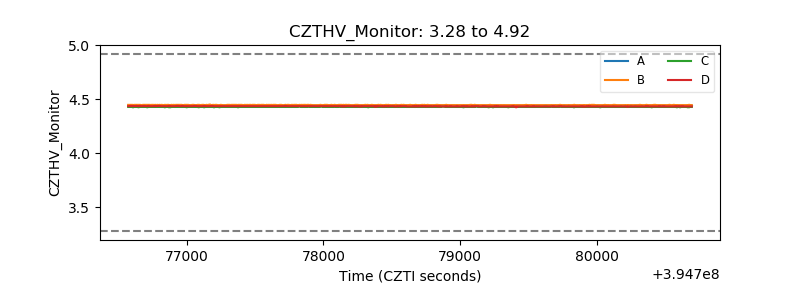 |
| D_VDD | 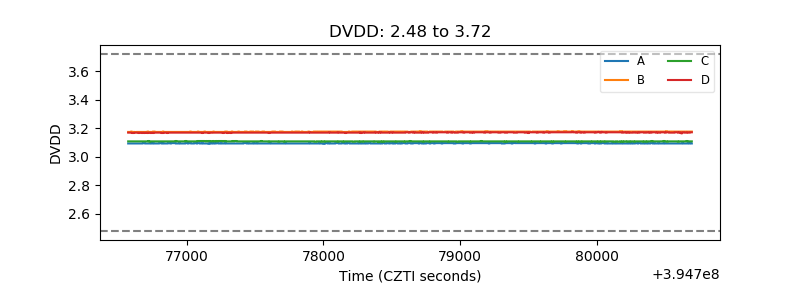 |
| Temperature 1 | 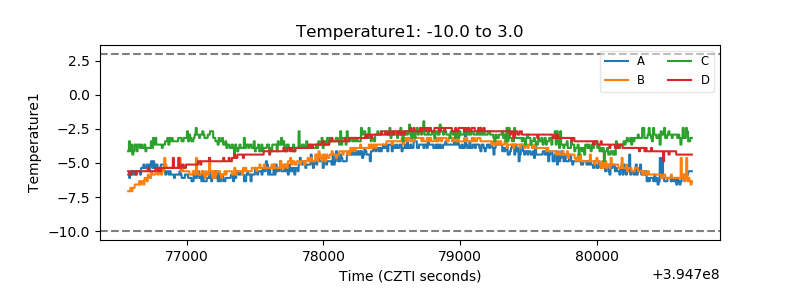 |
| Veto HV Monitor | 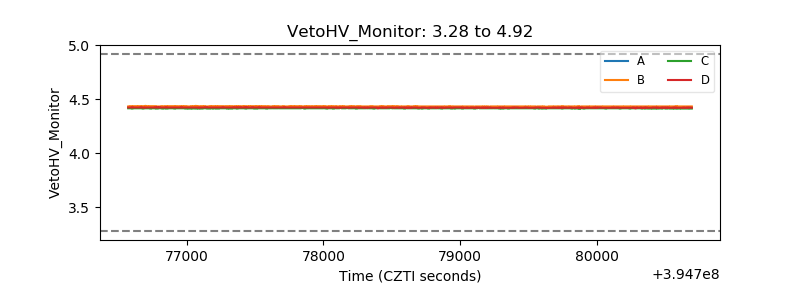 |
| Veto LLD | 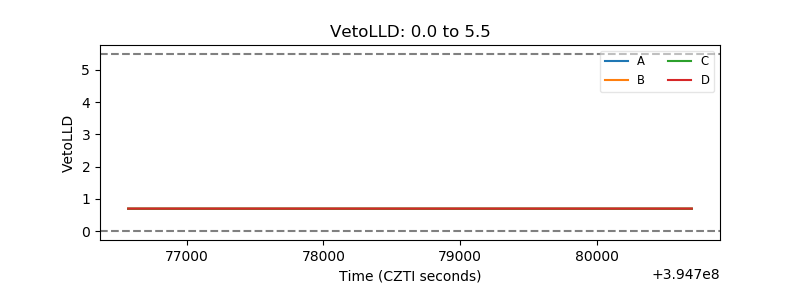 |
| Alpha Counter |  |
| _CPM_Rate | 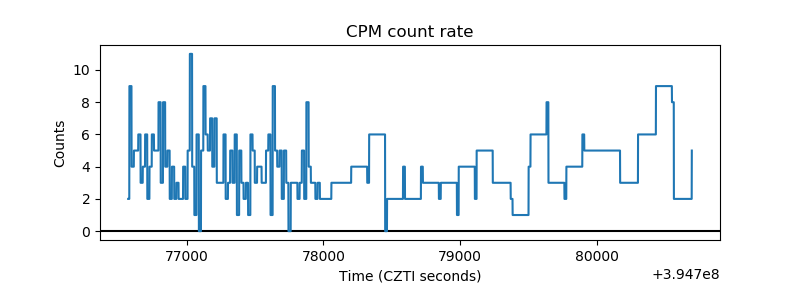 |
| CZT Counter | 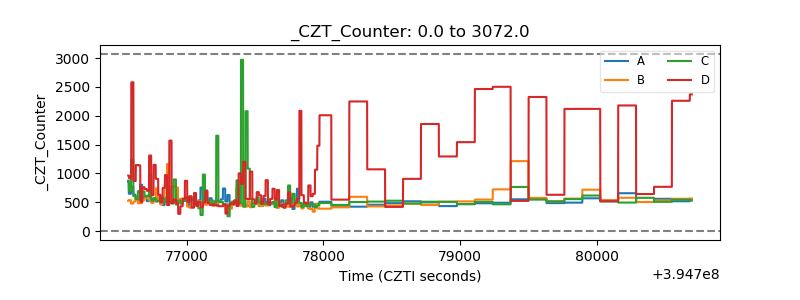 |
| +2.5 Volts monitor |  |
| +5 Volts monitor |  |
| _ROLL_ROT | 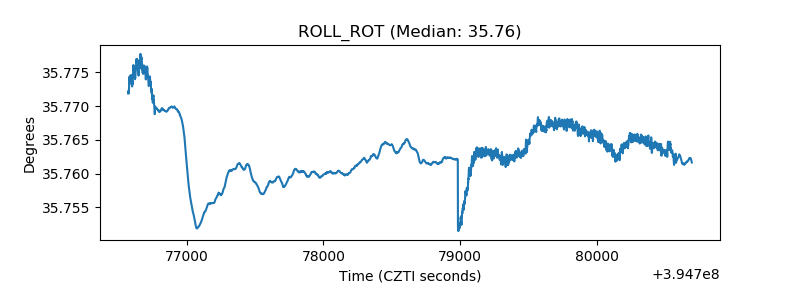 |
| _Roll_DEC | 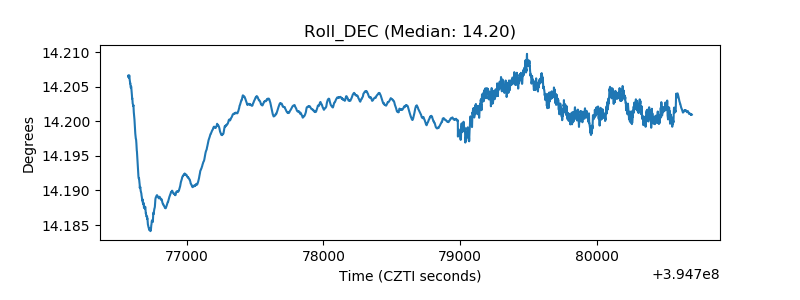 |
| _Roll_RA | 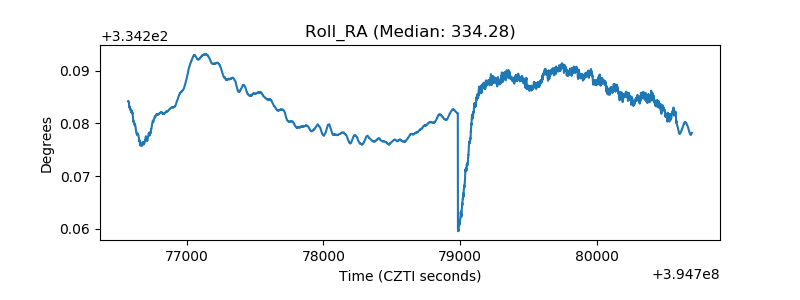 |
| Veto Counter | 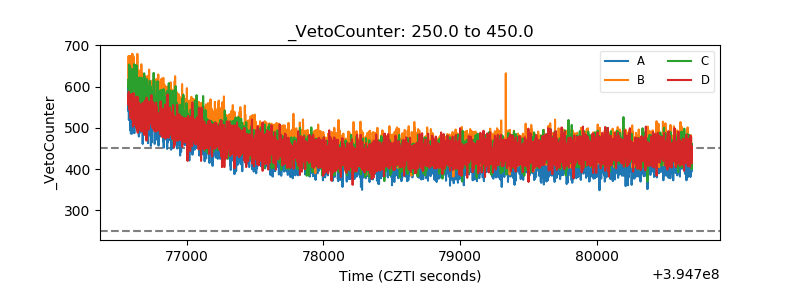 |