| Param | Original file | Final file |
|---|---|---|
| Filename | modeM0/AS1A10_073T02_9000005226cztM0_level2.fits | modeM0/AS1A10_073T02_9000005226cztM0_level2_quad_clean.evt |
| Size (bytes) | 794,816,640 | 755,726,400 |
| Size | 758.0 MB | 720.7 MB |
| Events in quadrant A | 5,061,226 | 4,864,061 |
| Events in quadrant B | 4,461,890 | 4,197,124 |
| Events in quadrant C | 4,846,070 | 4,589,873 |
| Events in quadrant D | 3,975,466 | 3,516,522 |
| Mode SS | |||
|---|---|---|---|
| Quadrant | BADHDUFLAG | Total packets | Discarded packets |
| A | 0 | 1708 | 0 |
| B | 0 | 1708 | 0 |
| C | 0 | 1708 | 0 |
| D | 0 | 1708 | 0 |
| Mode M0 | |||
|---|---|---|---|
| Quadrant | BADHDUFLAG | Total packets | Discarded packets |
| A | 0 | 180837 | 0 |
| B | 0 | 241824 | 0 |
| C | 0 | 202424 | 0 |
| D | 0 | 341317 | 0 |
| Mode M9 | |||
|---|---|---|---|
| Quadrant | BADHDUFLAG | Total packets | Discarded packets |
| A | 0 | 326 | 0 |
| B | 0 | 326 | 0 |
| C | 0 | 326 | 0 |
| D | 0 | 326 | 0 |
| Quadrant | Total seconds | Saturated seconds | Saturation percentage |
|---|---|---|---|
| A | 83374 | 538 | 0.645285% |
| B | 83374 | 9737 | 11.678701% |
| C | 83374 | 2262 | 2.713076% |
| D | 83374 | 11685 | 14.015161% |
Noise dominated data is calculated using 1-second bins in cleaned event files. If a bin has >2000 counts, and if more than 50% of those come from <1% of pixels, then it is considered to be noise-dominated and hence unusable.
| Quadrant | # 1 sec bins | Bins with >0 counts | Bins with >2000 counts | High rate bins dominated by noise | Noise dominated (total time) | Noise dominated (detector-on time) | Marked lightcurve |
|---|---|---|---|---|---|---|---|
| A | 115710 | 83373 | 0 | 0 | 0.00% | 0.00% | 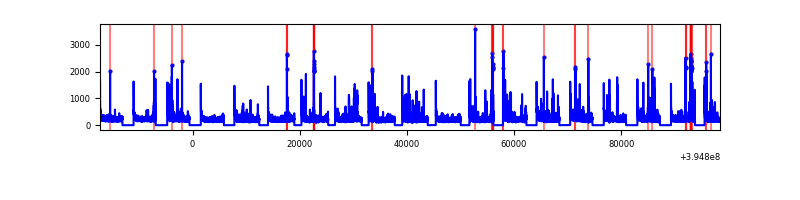 |
| B | 115710 | 82058 | 0 | 0 | 0.00% | 0.00% |  |
| C | 115710 | 83335 | 0 | 0 | 0.00% | 0.00% |  |
| D | 115710 | 83349 | 0 | 0 | 0.00% | 0.00% |  |
Top three noisy pixels from each quadrant. If the there are fewer than three noisy pixels in the level2.evt file, extra rows are filled as -1
| Pixel properties | Quadrant properties | ||||||
|---|---|---|---|---|---|---|---|
| Quadrant | DetID | PixID | Counts | Sigma | Mean | Median | Sigma |
| A | 7 | 110 | 4135 | 8.9 | 1321 | 1248 | 324.3 |
| A | 9 | 19 | 4020 | 8.55 | 1321 | 1248 | 324.3 |
| A | 0 | 29 | 3918 | 8.23 | 1321 | 1248 | 324.3 |
| B | 2 | 9 | 3866 | 12.02 | 1181 | 1130 | 227.7 |
| B | 3 | 80 | 3537 | 10.57 | 1181 | 1130 | 227.7 |
| B | 5 | 128 | 3163 | 8.93 | 1181 | 1130 | 227.7 |
| C | 1 | 81 | 3901 | 8.27 | 1280 | 1201 | 326.5 |
| C | 3 | 202 | 3822 | 8.03 | 1280 | 1201 | 326.5 |
| C | 1 | 80 | 3768 | 7.86 | 1280 | 1201 | 326.5 |
| D | 7 | 3 | 2953 | 6.42 | 1138 | 1042 | 297.5 |
| D | 10 | 189 | 2952 | 6.42 | 1138 | 1042 | 297.5 |
| D | 6 | 67 | 2880 | 6.18 | 1138 | 1042 | 297.5 |
Histogram calculated using DETX and DETY for each event in the final _common_clean file
| Quadrant A | 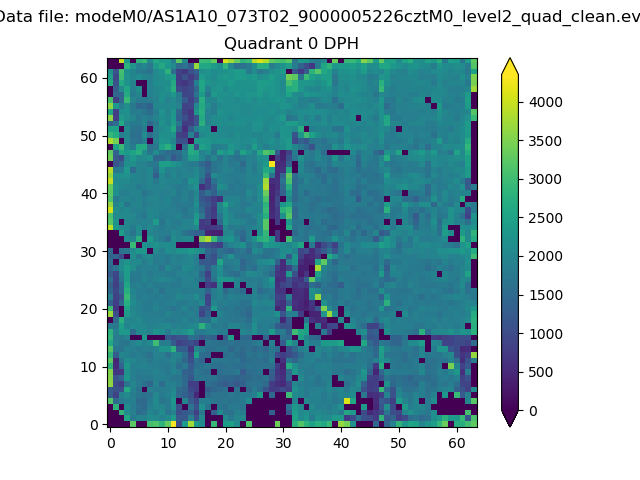 |
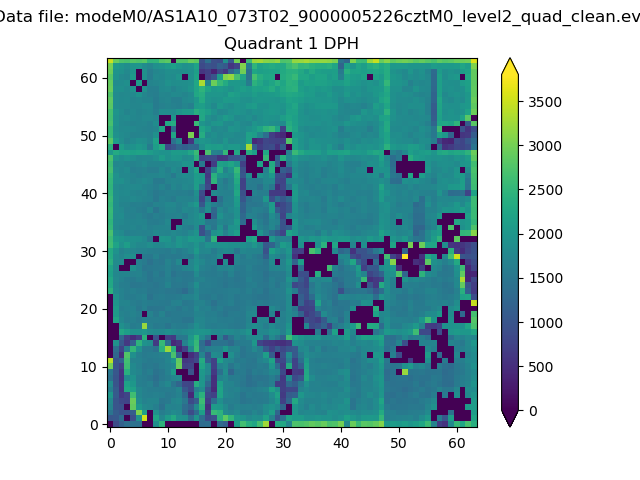 |
Quadrant B |
|---|---|---|---|
| Quadrant D |  |
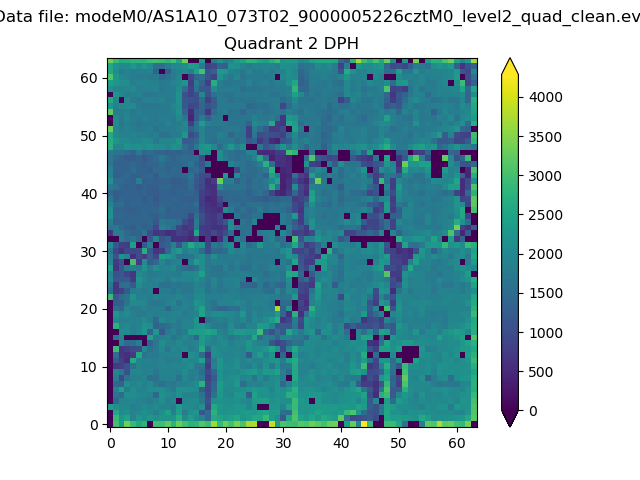 |
Quadrant C |
| Plot type | Count rate plots | Images |
|---|---|---|
| Comparison with Poisson distribution Blue bars denote a histogram of data divided into 1 sec bins. Red curve is a Poisson curve with rate = median count rate of data. |
 |
 |
| Quadrant-wise count rates Data is divided into 100 sec bins |
 |
|
| Module-wise count rates for Quadrant A Data is divided into 100 sec bins |
 |
 |
| Module-wise count rates for Quadrant B Data is divided into 100 sec bins |
 |
 |
| Module-wise count rates for Quadrant C Data is divided into 100 sec bins |
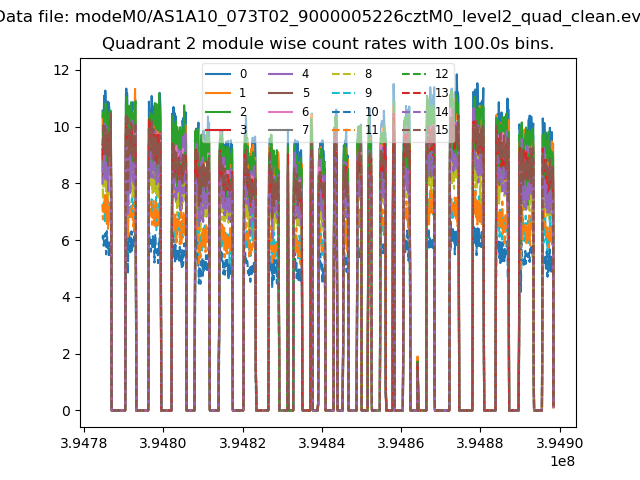 |
 |
| Module-wise count rates for Quadrant D Data is divided into 100 sec bins |
 |
 |
| Parameter | Plot |
|---|---|
| CZT HV Monitor |  |
| D_VDD | 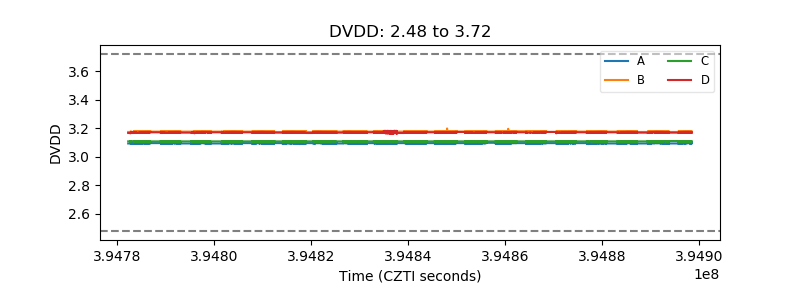 |
| Temperature 1 |  |
| Veto HV Monitor |  |
| Veto LLD |  |
| Alpha Counter | 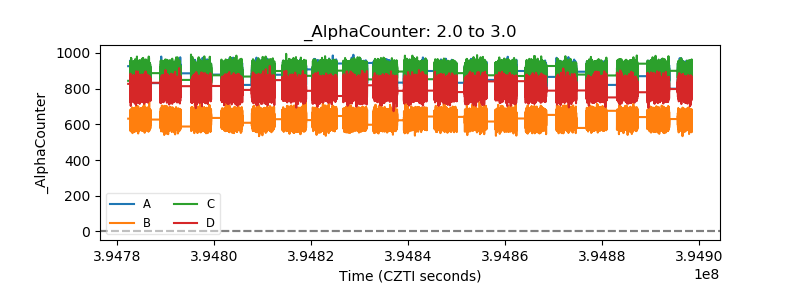 |
| _CPM_Rate | 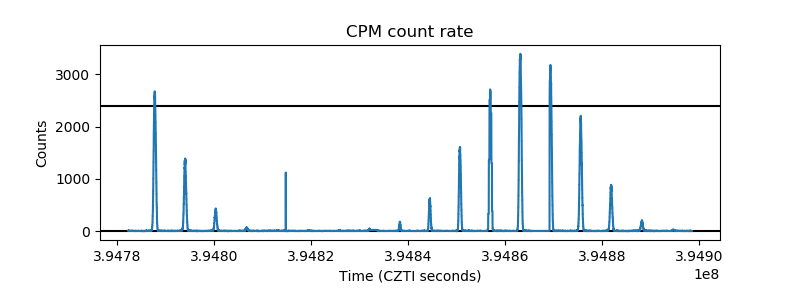 |
| CZT Counter |  |
| +2.5 Volts monitor |  |
| +5 Volts monitor |  |
| _ROLL_ROT | 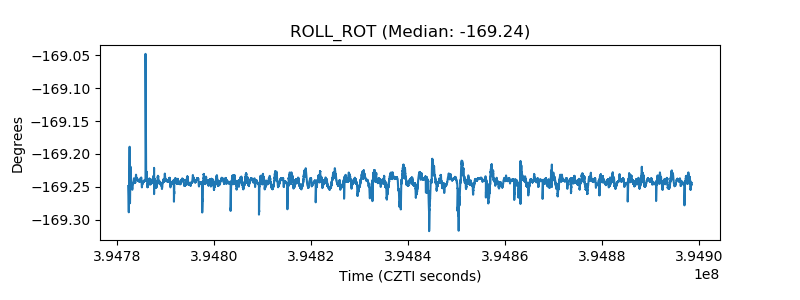 |
| _Roll_DEC | 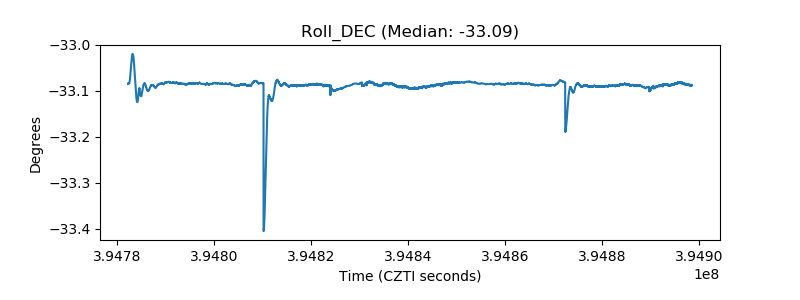 |
| _Roll_RA |  |
| Veto Counter |  |