| Param | Original file | Final file |
|---|---|---|
| Filename | modeM0/AS1A10_073T02_9000005226_36608cztM0_level2.evt | modeM0/AS1A10_073T02_9000005226_36608cztM0_level2_quad_clean.evt |
| Size (bytes) | 474,949,440 | 53,314,560 |
| Size | 452.9 MB | 50.8 MB |
| Events in quadrant A | 2,756,410 | 327,369 |
| Events in quadrant B | 2,695,081 | 330,273 |
| Events in quadrant C | 3,181,284 | 317,965 |
| Events in quadrant D | 5,411,481 | 286,857 |
| Mode SS | |||
|---|---|---|---|
| Quadrant | BADHDUFLAG | Total packets | Discarded packets |
| A | 0 | 102 | 0 |
| B | 0 | 102 | 0 |
| C | 0 | 102 | 0 |
| D | 0 | 102 | 0 |
| Mode M0 | |||
|---|---|---|---|
| Quadrant | BADHDUFLAG | Total packets | Discarded packets |
| A | 0 | 10943 | 3 |
| B | 0 | 10734 | 2 |
| C | 0 | 12341 | 2 |
| D | 0 | 19629 | 2 |
| Mode M9 | |||
|---|---|---|---|
| Quadrant | BADHDUFLAG | Total packets | Discarded packets |
| A | 0 | 26 | 0 |
| B | 0 | 26 | 0 |
| C | 0 | 26 | 0 |
| D | 0 | 26 | 0 |
| Quadrant | Total seconds | Saturated seconds | Saturation percentage |
|---|---|---|---|
| A | 5012 | 15 | 0.299282% |
| B | 5012 | 21 | 0.418994% |
| C | 5012 | 149 | 2.972865% |
| D | 5012 | 457 | 9.118117% |
Noise dominated data is calculated using 1-second bins in cleaned event files. If a bin has >2000 counts, and if more than 50% of those come from <1% of pixels, then it is considered to be noise-dominated and hence unusable.
| Quadrant | # 1 sec bins | Bins with >0 counts | Bins with >2000 counts | High rate bins dominated by noise | Noise dominated (total time) | Noise dominated (detector-on time) | Marked lightcurve |
|---|---|---|---|---|---|---|---|
| A | 7105 | 5013 | 3 | 3 | 0.04% | 0.06% | 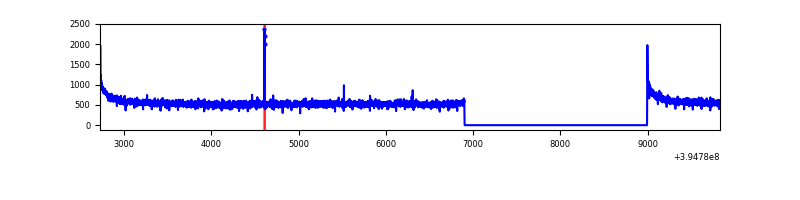 |
| B | 7105 | 5013 | 9 | 9 | 0.13% | 0.18% | 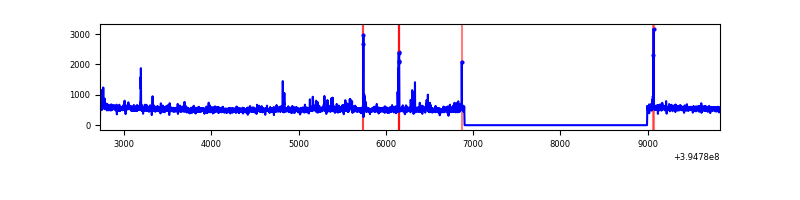 |
| C | 7105 | 5013 | 106 | 106 | 1.49% | 2.11% | 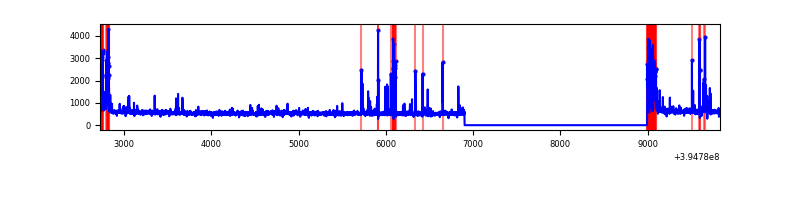 |
| D | 7105 | 5013 | 418 | 418 | 5.88% | 8.34% | 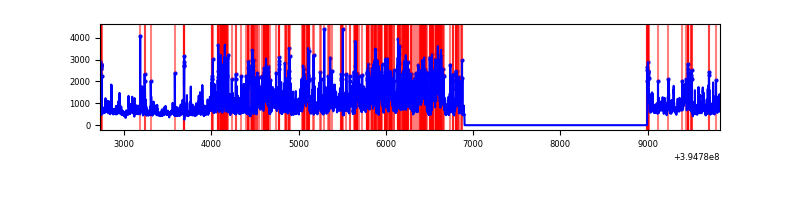 |
Top three noisy pixels from each quadrant. If the there are fewer than three noisy pixels in the level2.evt file, extra rows are filled as -1
| Pixel properties | Quadrant properties | ||||||
|---|---|---|---|---|---|---|---|
| Quadrant | DetID | PixID | Counts | Sigma | Mean | Median | Sigma |
| A | 10 | 83 | 195596 | 1495.73 | 658 | 648 | 130.3 |
| A | 15 | 223 | 13007 | 94.82 | 658 | 648 | 130.3 |
| A | 13 | 254 | 7760 | 54.56 | 658 | 648 | 130.3 |
| B | 4 | 171 | 48100 | 384.87 | 652 | 636 | 123.3 |
| B | 15 | 85 | 33403 | 265.7 | 652 | 636 | 123.3 |
| B | 0 | 213 | 18625 | 145.87 | 652 | 636 | 123.3 |
| C | 0 | 10 | 357464 | 2511.98 | 622 | 627 | 142.1 |
| C | 15 | 214 | 215506 | 1512.66 | 622 | 627 | 142.1 |
| C | 0 | 207 | 158401 | 1110.66 | 622 | 627 | 142.1 |
| D | 12 | 235 | 2521838 | 16914.49 | 616 | 600 | 149.1 |
| D | 2 | 250 | 93364 | 622.34 | 616 | 600 | 149.1 |
| D | 2 | 249 | 85742 | 571.2 | 616 | 600 | 149.1 |
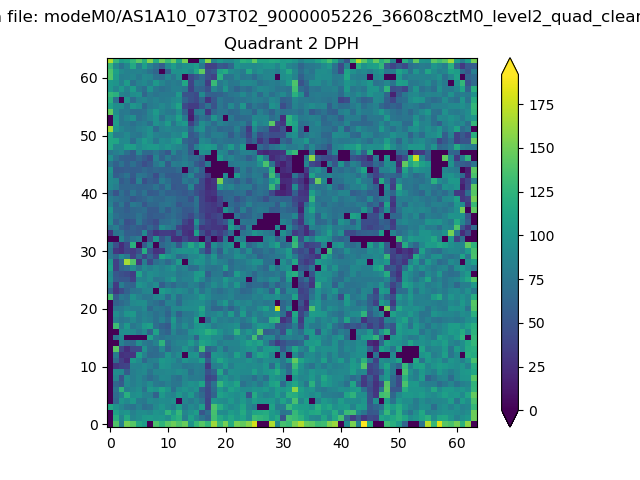
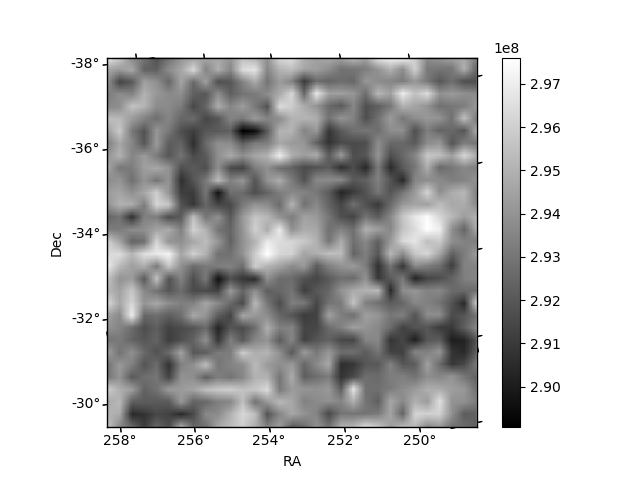
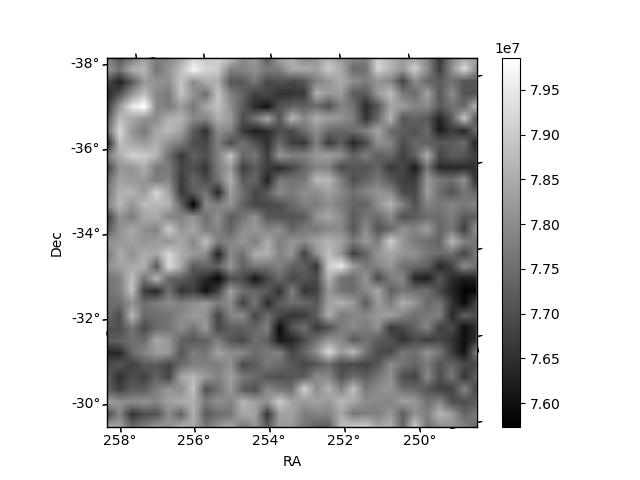
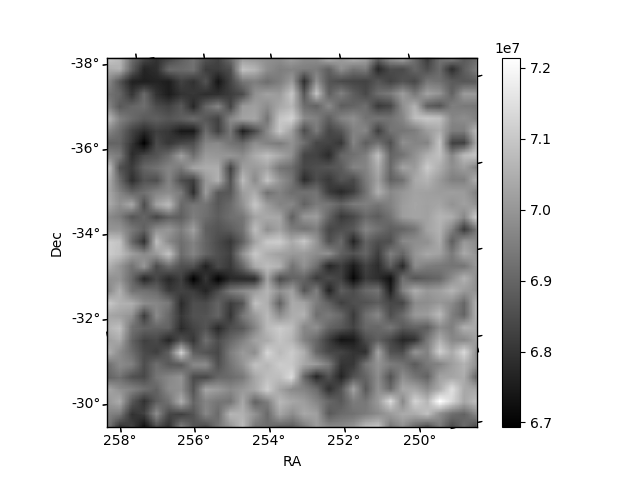
Histogram calculated using DETX and DETY for each event in the final _common_clean file
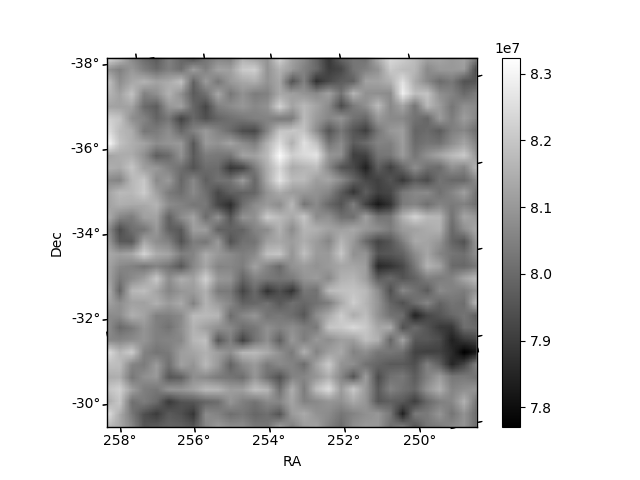
| Quadrant A | 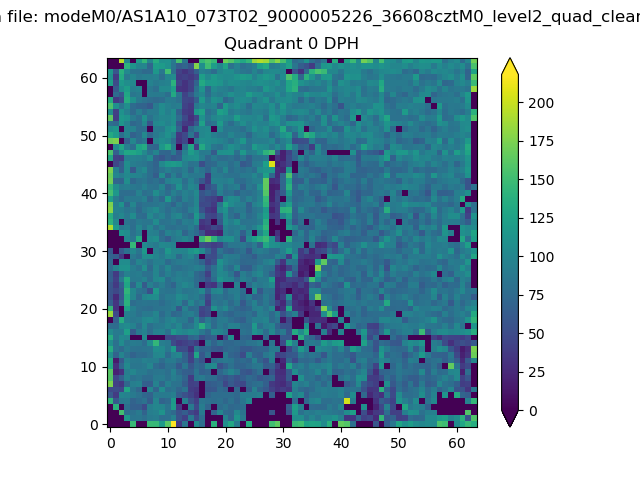 |
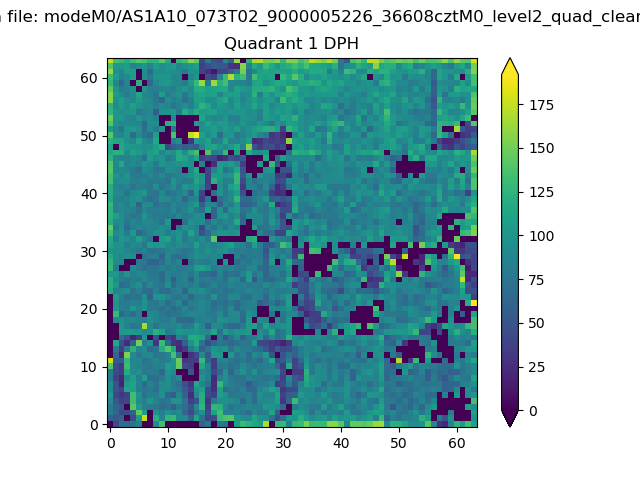 |
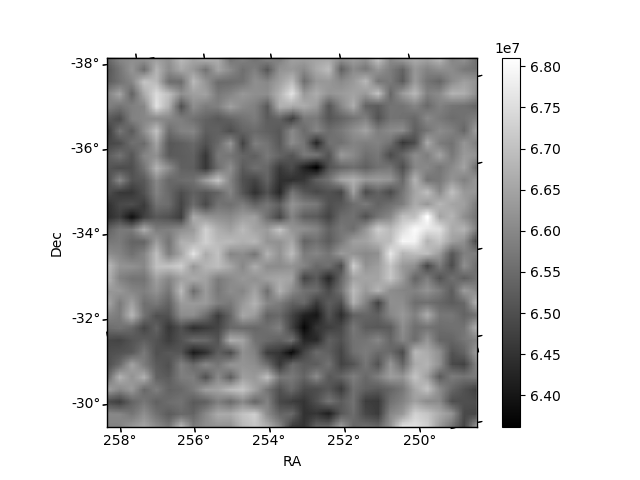
Quadrant B |
|---|---|---|---|
| Quadrant D | 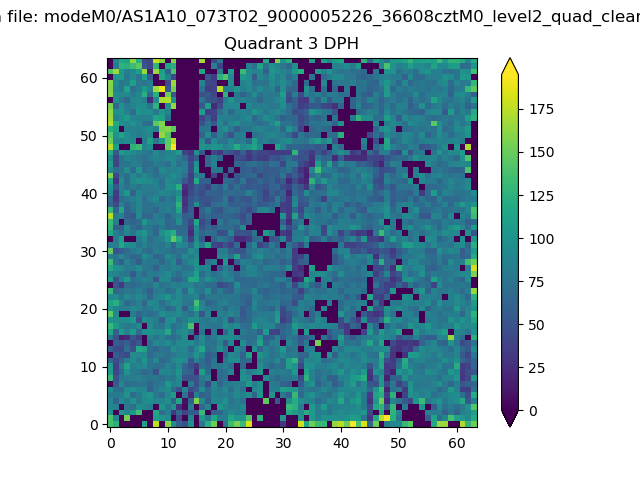 |
 |
Quadrant C |
| Plot type | Count rate plots | Images |
|---|---|---|
| Comparison with Poisson distribution Blue bars denote a histogram of data divided into 1 sec bins. Red curve is a Poisson curve with rate = median count rate of data. |
 |
 |
| Quadrant-wise count rates Data is divided into 100 sec bins |
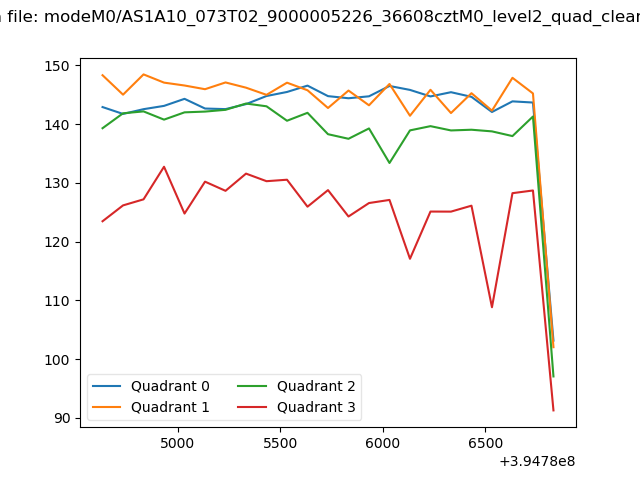 |
|
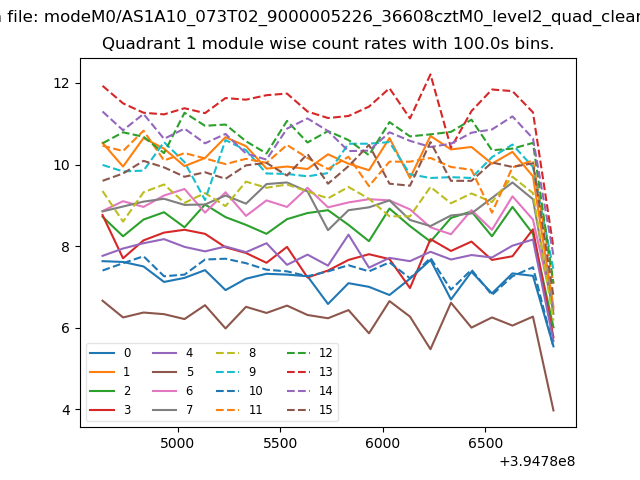
| Module-wise count rates for Quadrant A Data is divided into 100 sec bins |
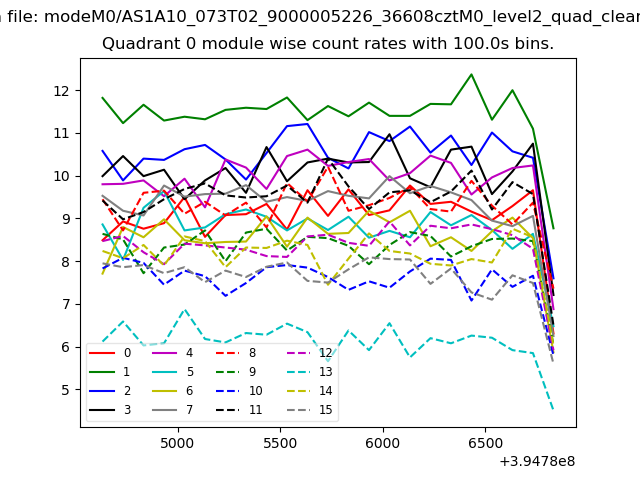 |
 |
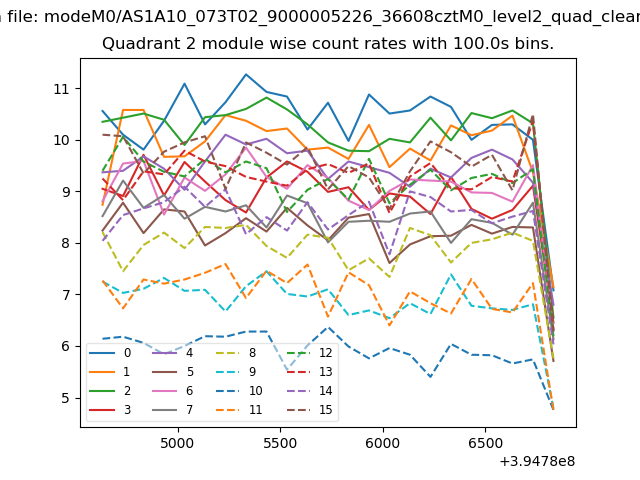
| Module-wise count rates for Quadrant B Data is divided into 100 sec bins |
 |
 |
| Module-wise count rates for Quadrant C Data is divided into 100 sec bins |
 |
 |
| Module-wise count rates for Quadrant D Data is divided into 100 sec bins |
 |
 |
| Parameter | Plot |
|---|---|
| CZT HV Monitor | 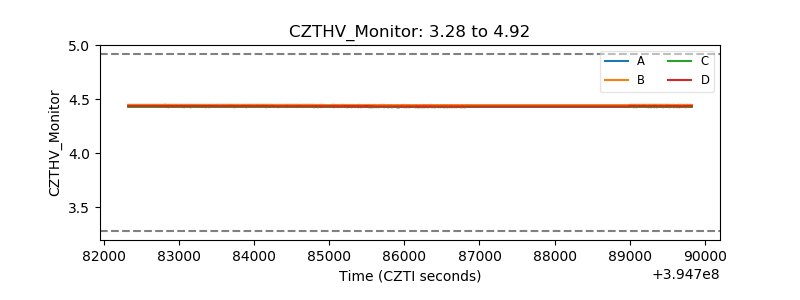 |
| D_VDD | 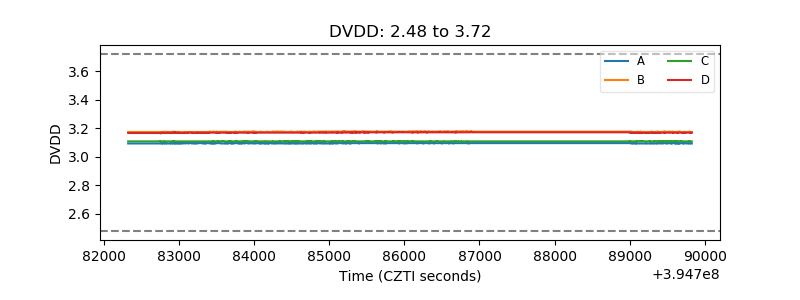 |
| Temperature 1 | 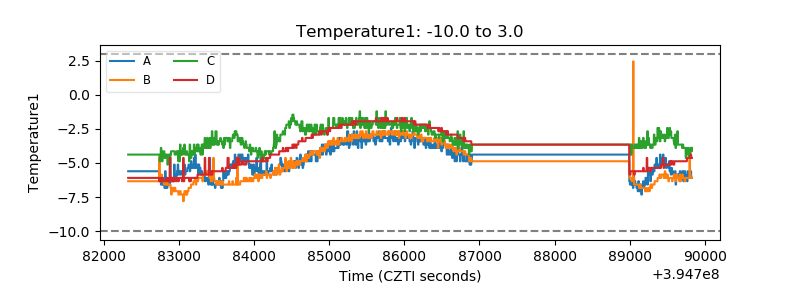 |
| Veto HV Monitor | 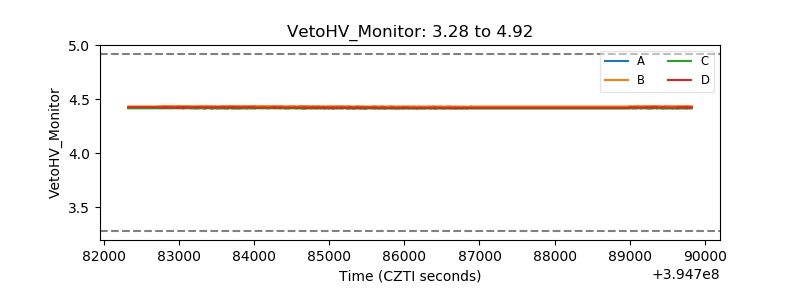 |
| Veto LLD | 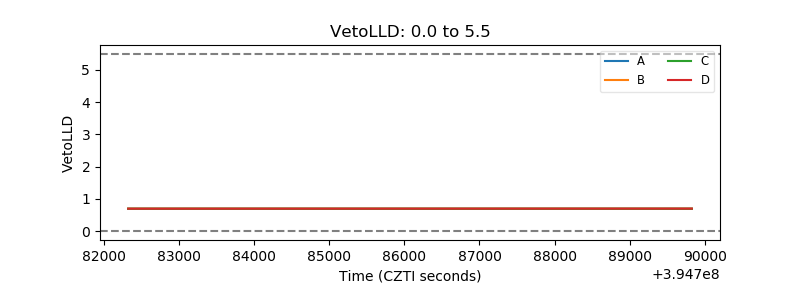 |
| Alpha Counter | 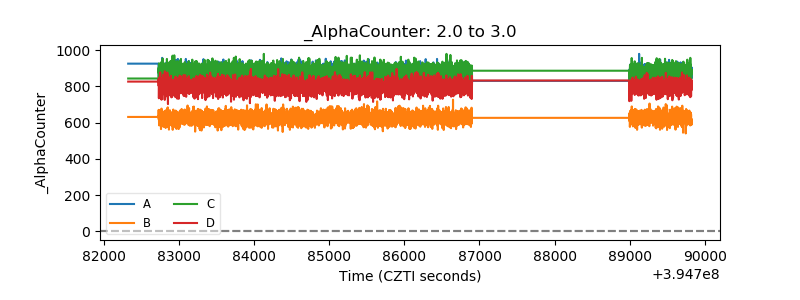 |
| _CPM_Rate | 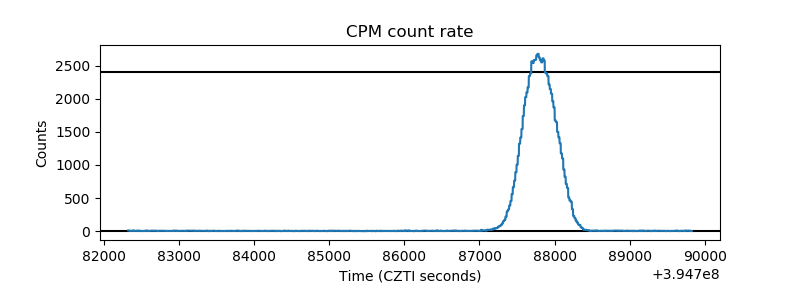 |
| CZT Counter | 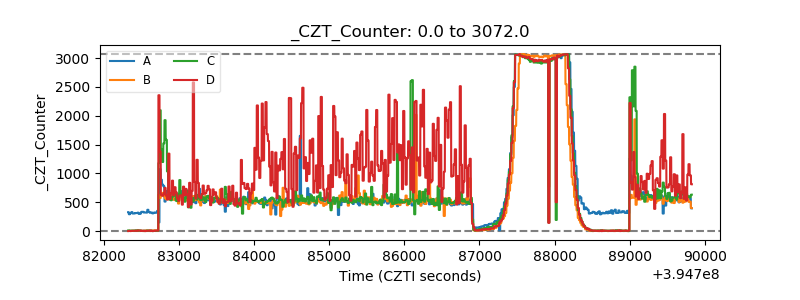 |
| +2.5 Volts monitor |  |
| +5 Volts monitor |  |
| _ROLL_ROT |  |
| _Roll_DEC | 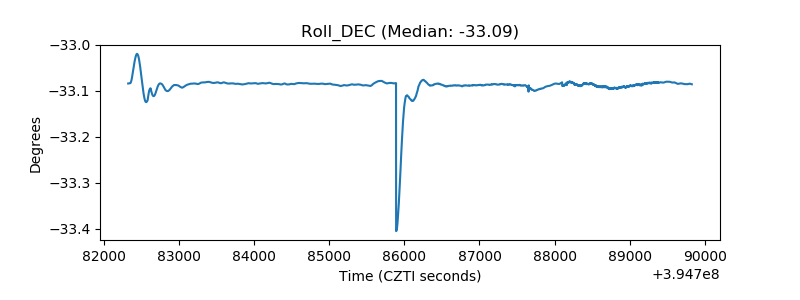 |
| _Roll_RA | 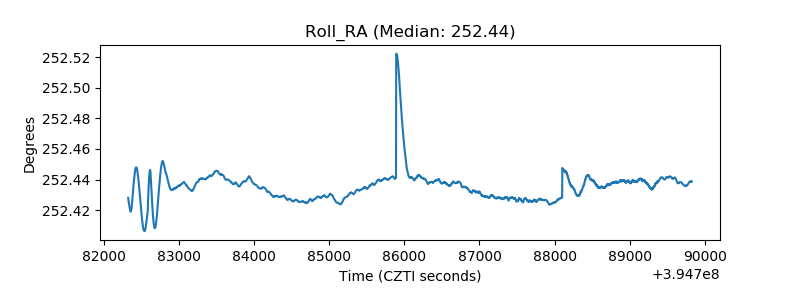 |
| Veto Counter | 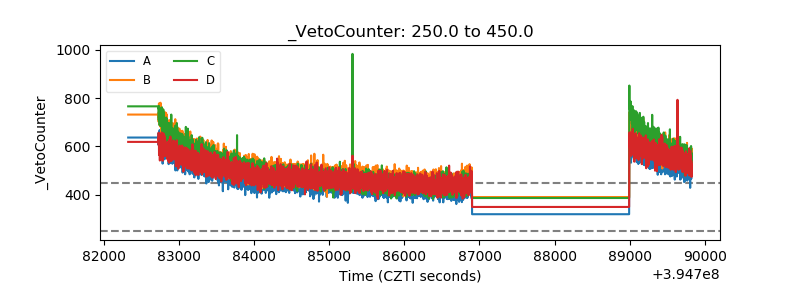 |