| Param | Original file | Final file |
|---|---|---|
| Filename | modeM0/AS1A10_073T02_9000005226_36609cztM0_level2.evt | modeM0/AS1A10_073T02_9000005226_36609cztM0_level2_quad_clean.evt |
| Size (bytes) | 513,872,640 | 58,933,440 |
| Size | 490.1 MB | 56.2 MB |
| Events in quadrant A | 2,796,601 | 381,423 |
| Events in quadrant B | 2,525,688 | 387,904 |
| Events in quadrant C | 3,786,548 | 371,251 |
| Events in quadrant D | 6,131,526 | 309,332 |
| Mode SS | |||
|---|---|---|---|
| Quadrant | BADHDUFLAG | Total packets | Discarded packets |
| A | 0 | 96 | 0 |
| B | 0 | 96 | 0 |
| C | 0 | 96 | 0 |
| D | 0 | 96 | 0 |
| Mode M0 | |||
|---|---|---|---|
| Quadrant | BADHDUFLAG | Total packets | Discarded packets |
| A | 0 | 11022 | 3 |
| B | 0 | 10085 | 2 |
| C | 0 | 14225 | 2 |
| D | 0 | 21501 | 2 |
| Mode M9 | |||
|---|---|---|---|
| Quadrant | BADHDUFLAG | Total packets | Discarded packets |
| A | 0 | 34 | 0 |
| B | 0 | 34 | 0 |
| C | 0 | 34 | 0 |
| D | 0 | 35 | 0 |
| Quadrant | Total seconds | Saturated seconds | Saturation percentage |
|---|---|---|---|
| A | 4762 | 42 | 0.881982% |
| B | 4762 | 19 | 0.398992% |
| C | 4762 | 384 | 8.063839% |
| D | 4762 | 984 | 20.663587% |
Noise dominated data is calculated using 1-second bins in cleaned event files. If a bin has >2000 counts, and if more than 50% of those come from <1% of pixels, then it is considered to be noise-dominated and hence unusable.
| Quadrant | # 1 sec bins | Bins with >0 counts | Bins with >2000 counts | High rate bins dominated by noise | Noise dominated (total time) | Noise dominated (detector-on time) | Marked lightcurve |
|---|---|---|---|---|---|---|---|
| A | 6914 | 4763 | 16 | 16 | 0.23% | 0.34% | 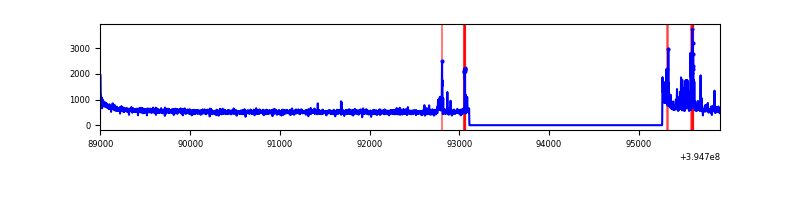 |
| B | 6914 | 4763 | 4 | 4 | 0.06% | 0.08% | 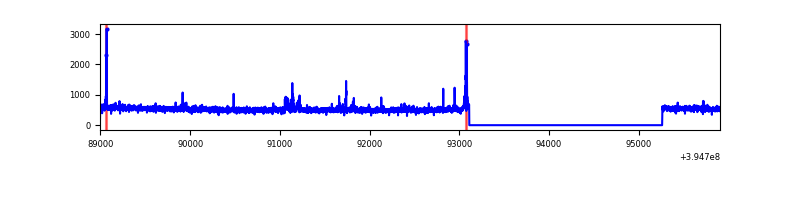 |
| C | 6914 | 4763 | 297 | 297 | 4.30% | 6.24% | 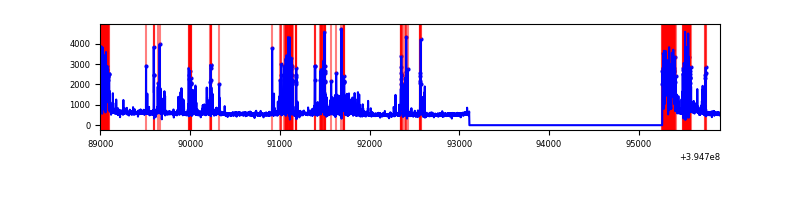 |
| D | 6914 | 4763 | 902 | 902 | 13.05% | 18.94% | 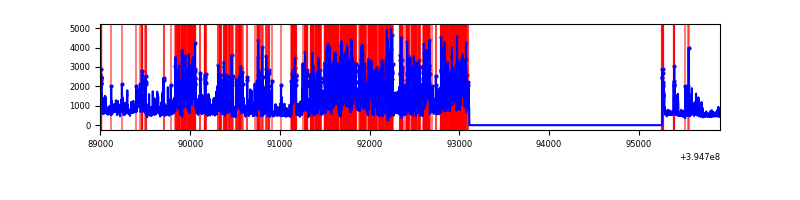 |
Top three noisy pixels from each quadrant. If the there are fewer than three noisy pixels in the level2.evt file, extra rows are filled as -1
| Pixel properties | Quadrant properties | ||||||
|---|---|---|---|---|---|---|---|
| Quadrant | DetID | PixID | Counts | Sigma | Mean | Median | Sigma |
| A | 15 | 223 | 203748 | 1636.44 | 621 | 612 | 124.1 |
| A | 10 | 83 | 191317 | 1536.3 | 621 | 612 | 124.1 |
| A | 13 | 254 | 7483 | 55.35 | 621 | 612 | 124.1 |
| B | 4 | 171 | 49195 | 420.83 | 615 | 601 | 115.5 |
| B | 0 | 213 | 29292 | 248.47 | 615 | 601 | 115.5 |
| B | 12 | 111 | 14095 | 116.86 | 615 | 601 | 115.5 |
| C | 0 | 207 | 847222 | 6319.34 | 580 | 586 | 134.0 |
| C | 0 | 10 | 457725 | 3412.11 | 580 | 586 | 134.0 |
| C | 15 | 214 | 201828 | 1502.08 | 580 | 586 | 134.0 |
| D | 12 | 235 | 3373040 | 24580.21 | 561 | 546 | 137.2 |
| D | 12 | 227 | 158991 | 1154.82 | 561 | 546 | 137.2 |
| D | 2 | 250 | 114298 | 829.07 | 561 | 546 | 137.2 |
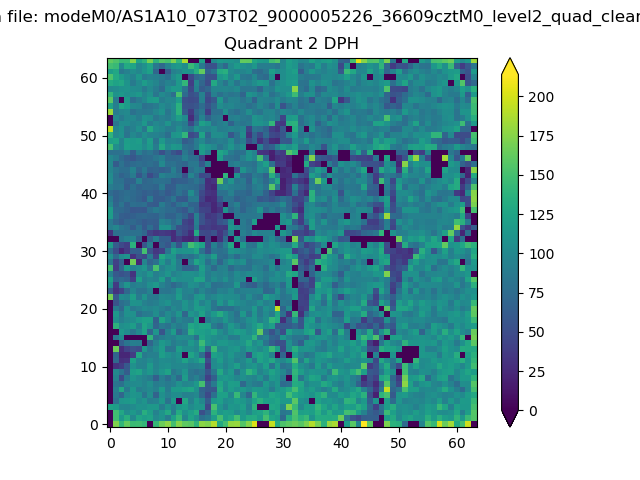
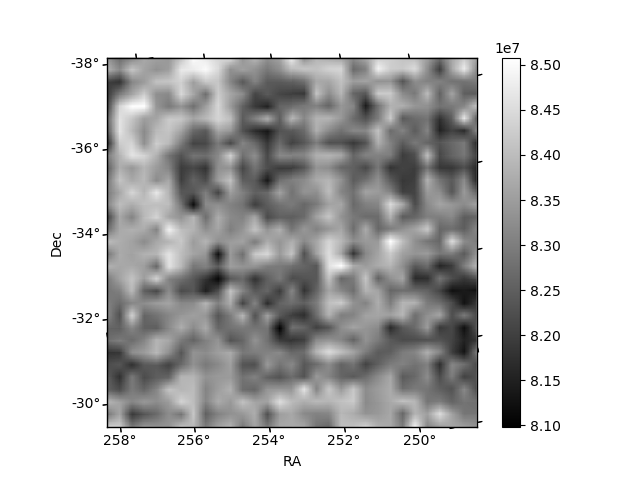
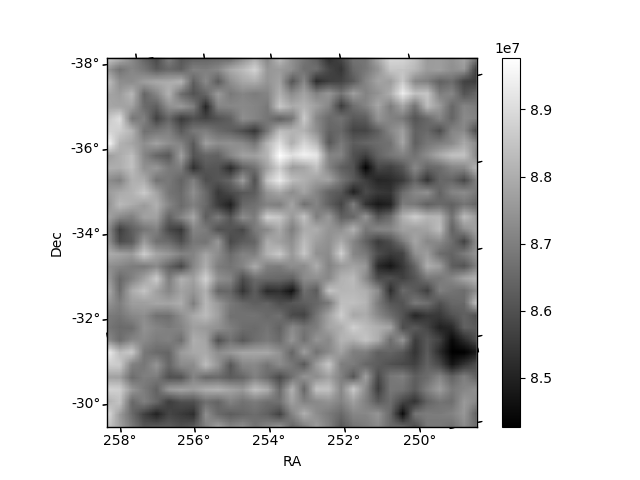
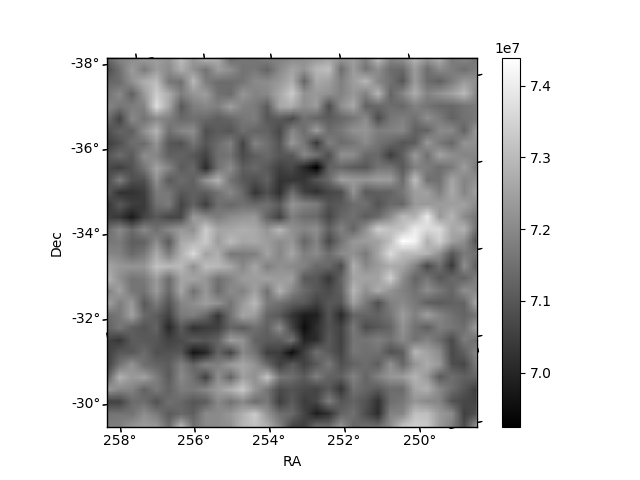
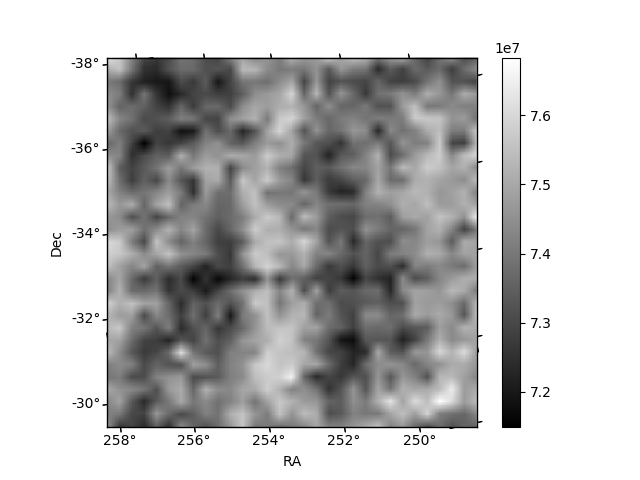
Histogram calculated using DETX and DETY for each event in the final _common_clean file
| Quadrant A | 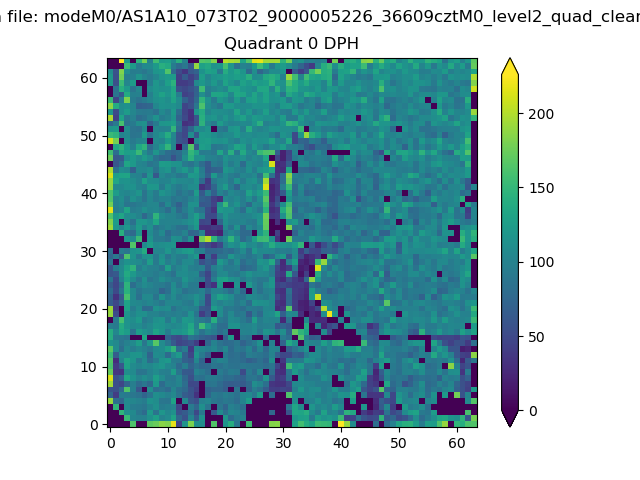 |
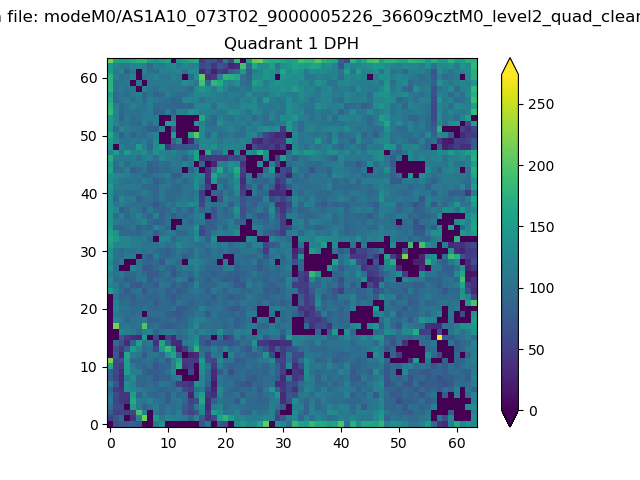 |
Quadrant B |
|---|---|---|---|
| Quadrant D | 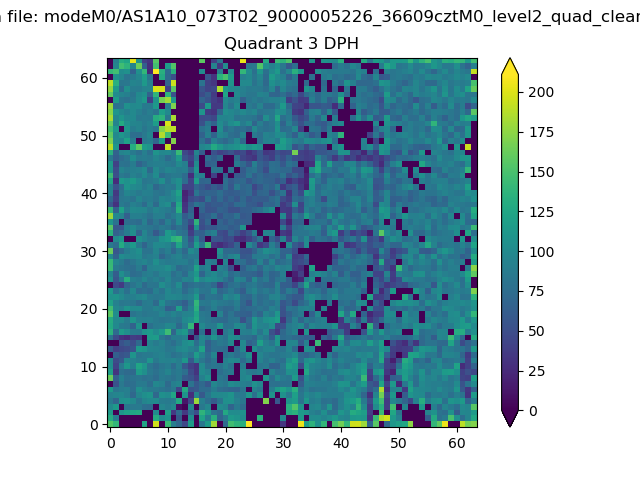 |
 |
Quadrant C |
| Plot type | Count rate plots | Images |
|---|---|---|
| Comparison with Poisson distribution Blue bars denote a histogram of data divided into 1 sec bins. Red curve is a Poisson curve with rate = median count rate of data. |
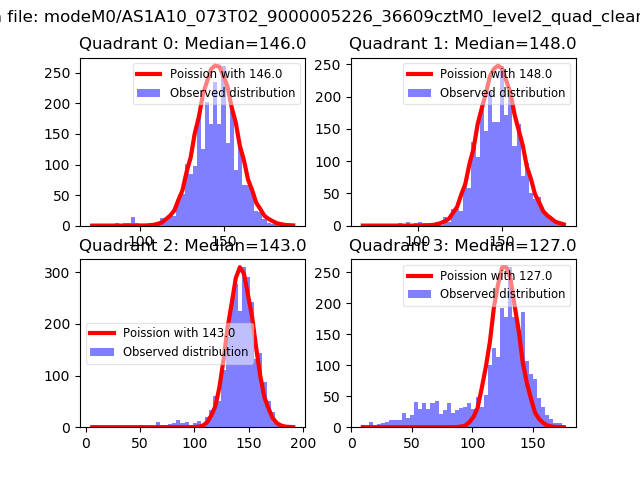 |
 |
| Quadrant-wise count rates Data is divided into 100 sec bins |
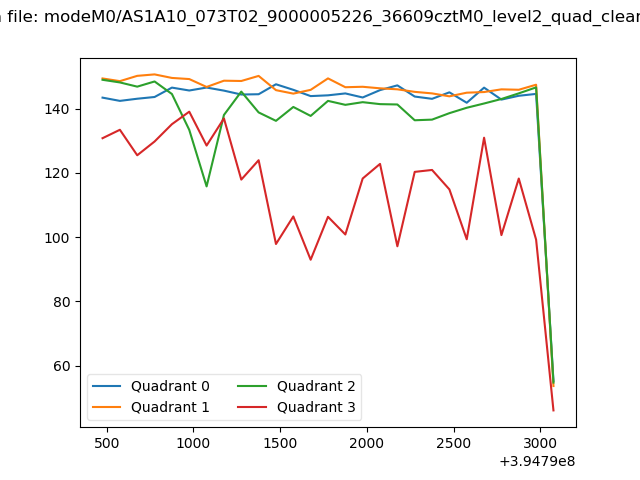 |
|
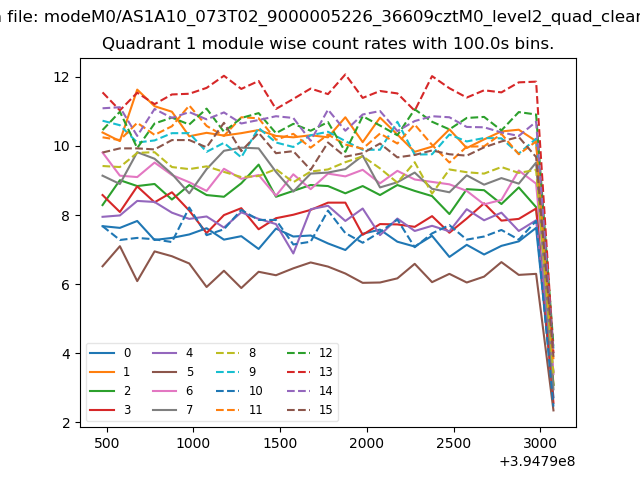
| Module-wise count rates for Quadrant A Data is divided into 100 sec bins |
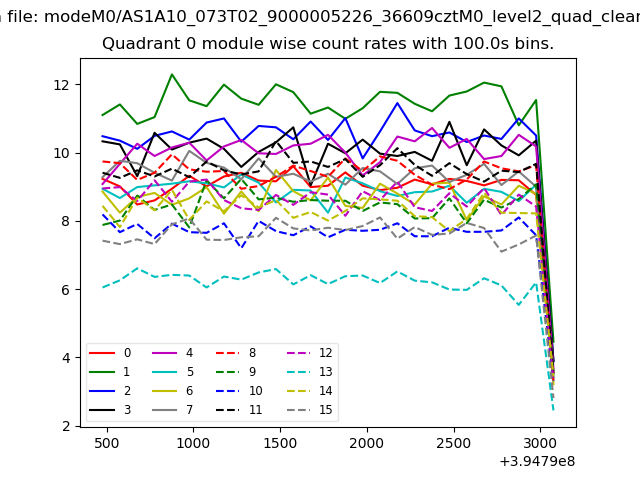 |
 |
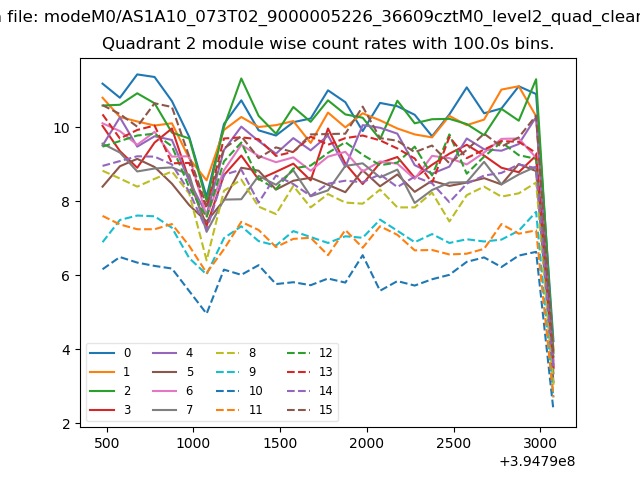
| Module-wise count rates for Quadrant B Data is divided into 100 sec bins |
 |
 |
| Module-wise count rates for Quadrant C Data is divided into 100 sec bins |
 |
 |
| Module-wise count rates for Quadrant D Data is divided into 100 sec bins |
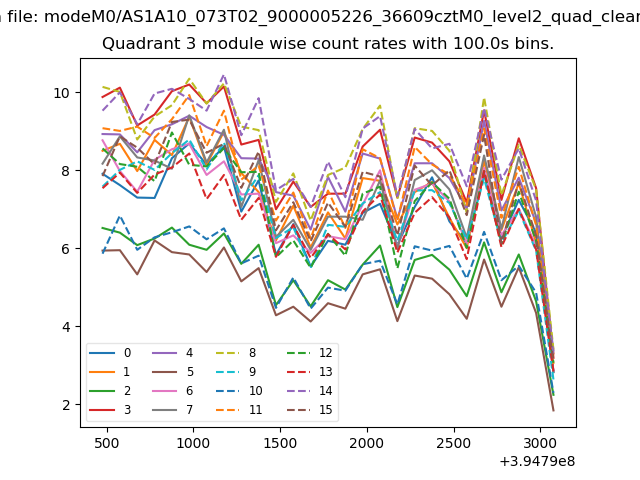 |
 |
| Parameter | Plot |
|---|---|
| CZT HV Monitor | 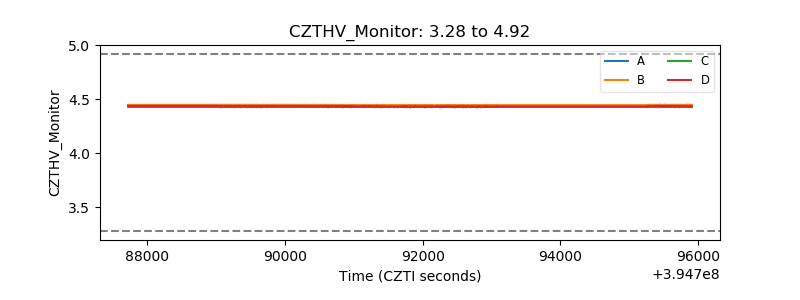 |
| D_VDD | 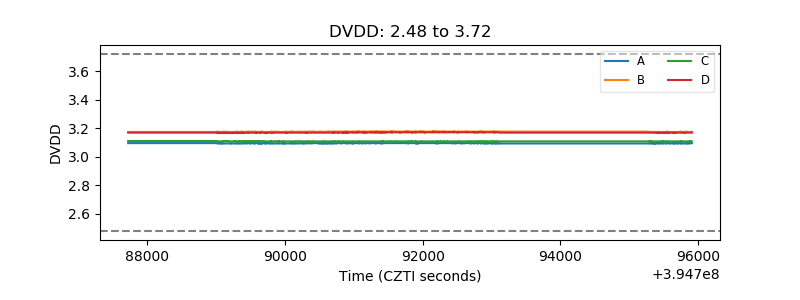 |
| Temperature 1 | 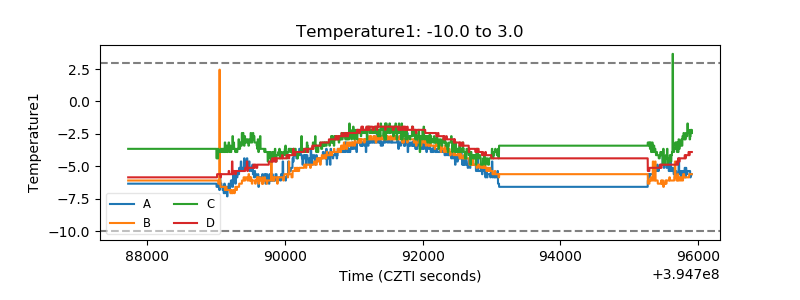 |
| Veto HV Monitor | 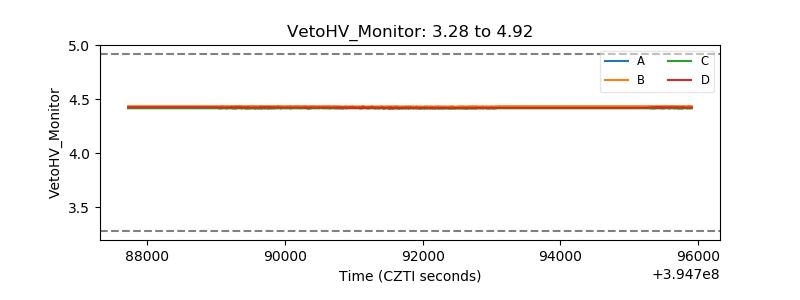 |
| Veto LLD | 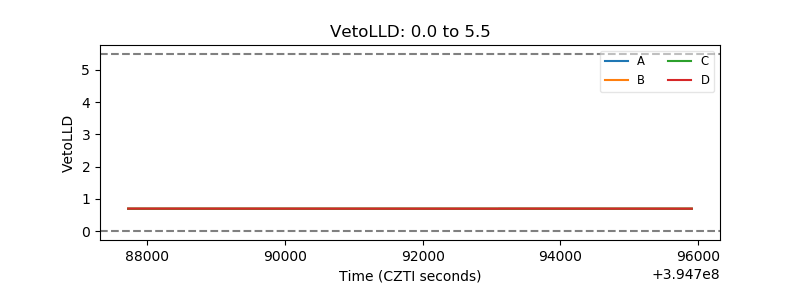 |
| Alpha Counter | 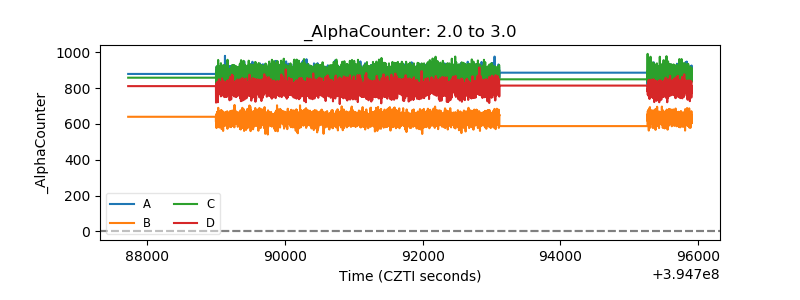 |
| _CPM_Rate | 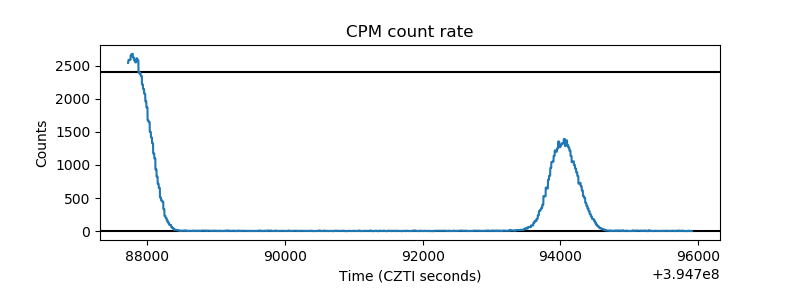 |
| CZT Counter | 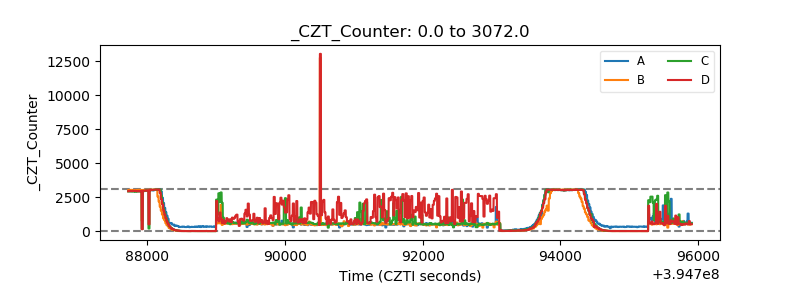 |
| +2.5 Volts monitor |  |
| +5 Volts monitor | 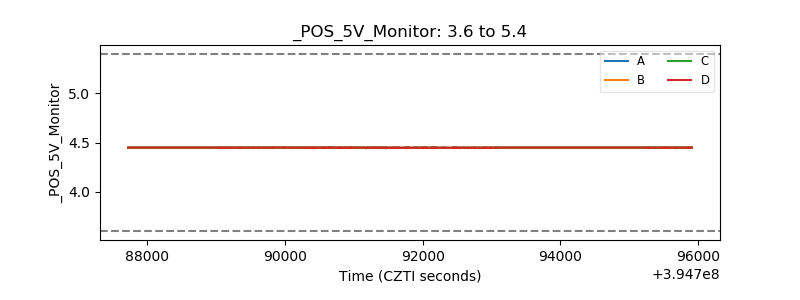 |
| _ROLL_ROT | 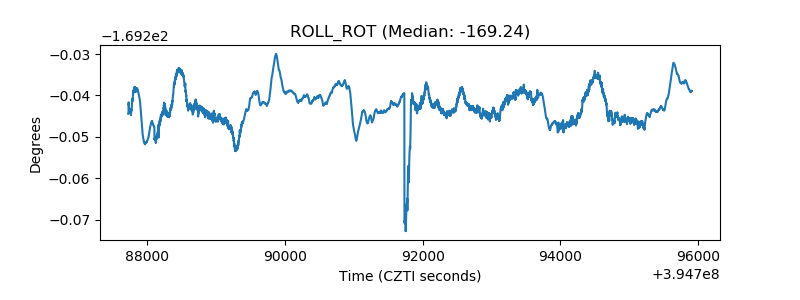 |
| _Roll_DEC | 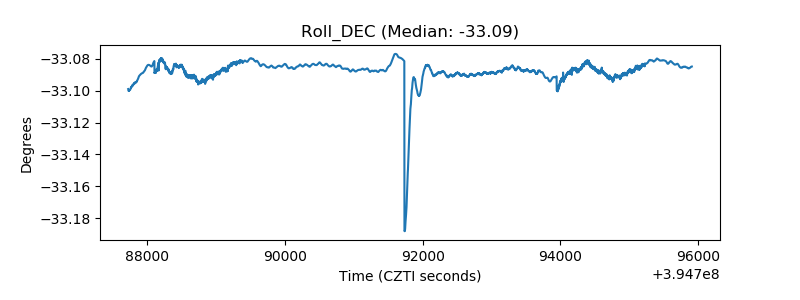 |
| _Roll_RA | 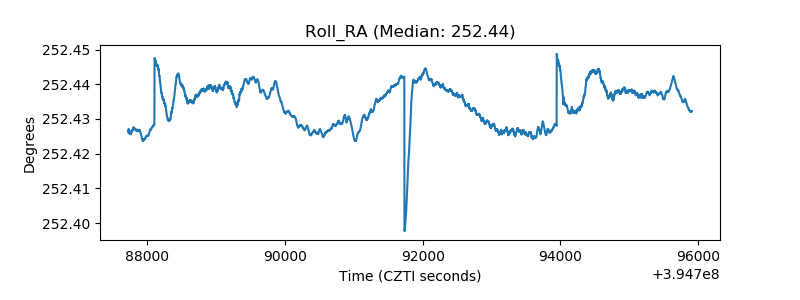 |
| Veto Counter | 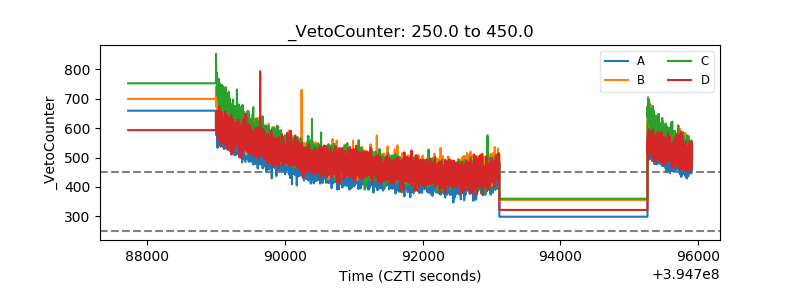 |