| Param | Original file | Final file |
|---|---|---|
| Filename | modeM0/AS1A10_073T02_9000005226_36610cztM0_level2.evt | modeM0/AS1A10_073T02_9000005226_36610cztM0_level2_quad_clean.evt |
| Size (bytes) | 521,346,240 | 69,465,600 |
| Size | 497.2 MB | 66.2 MB |
| Events in quadrant A | 2,923,654 | 454,366 |
| Events in quadrant B | 2,545,417 | 462,296 |
| Events in quadrant C | 3,436,026 | 453,239 |
| Events in quadrant D | 6,549,409 | 386,583 |
| Mode SS | |||
|---|---|---|---|
| Quadrant | BADHDUFLAG | Total packets | Discarded packets |
| A | 0 | 100 | 0 |
| B | 0 | 100 | 0 |
| C | 0 | 100 | 0 |
| D | 0 | 100 | 0 |
| Mode M0 | |||
|---|---|---|---|
| Quadrant | BADHDUFLAG | Total packets | Discarded packets |
| A | 0 | 11620 | 3 |
| B | 0 | 10269 | 2 |
| C | 0 | 13143 | 2 |
| D | 0 | 22831 | 2 |
| Mode M9 | |||
|---|---|---|---|
| Quadrant | BADHDUFLAG | Total packets | Discarded packets |
| A | 0 | 34 | 0 |
| B | 0 | 34 | 0 |
| C | 0 | 34 | 0 |
| D | 0 | 35 | 0 |
| Quadrant | Total seconds | Saturated seconds | Saturation percentage |
|---|---|---|---|
| A | 4943 | 48 | 0.971070% |
| B | 4943 | 9 | 0.182076% |
| C | 4943 | 285 | 5.765729% |
| D | 4943 | 926 | 18.733563% |
Noise dominated data is calculated using 1-second bins in cleaned event files. If a bin has >2000 counts, and if more than 50% of those come from <1% of pixels, then it is considered to be noise-dominated and hence unusable.
| Quadrant | # 1 sec bins | Bins with >0 counts | Bins with >2000 counts | High rate bins dominated by noise | Noise dominated (total time) | Noise dominated (detector-on time) | Marked lightcurve |
|---|---|---|---|---|---|---|---|
| A | 7066 | 4944 | 21 | 21 | 0.30% | 0.42% | 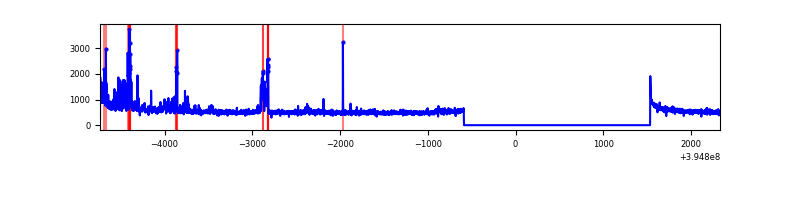 |
| B | 7066 | 4944 | 1 | 1 | 0.01% | 0.02% | 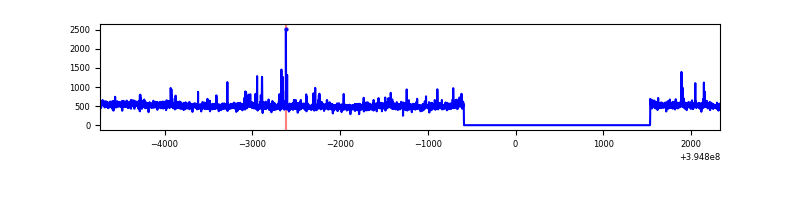 |
| C | 7066 | 4944 | 217 | 217 | 3.07% | 4.39% | 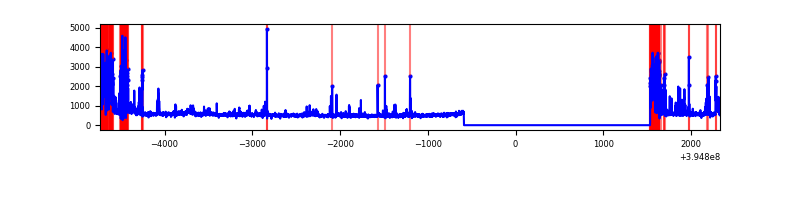 |
| D | 7066 | 4944 | 850 | 850 | 12.03% | 17.19% |  |
Top three noisy pixels from each quadrant. If the there are fewer than three noisy pixels in the level2.evt file, extra rows are filled as -1
| Pixel properties | Quadrant properties | ||||||
|---|---|---|---|---|---|---|---|
| Quadrant | DetID | PixID | Counts | Sigma | Mean | Median | Sigma |
| A | 15 | 223 | 326466 | 2605.86 | 620 | 609 | 125.0 |
| A | 10 | 83 | 194645 | 1551.7 | 620 | 609 | 125.0 |
| A | 13 | 254 | 8055 | 59.55 | 620 | 609 | 125.0 |
| B | 0 | 189 | 23510 | 196.29 | 614 | 599 | 116.7 |
| B | 5 | 255 | 22091 | 184.13 | 614 | 599 | 116.7 |
| B | 0 | 219 | 18286 | 151.53 | 614 | 599 | 116.7 |
| C | 0 | 10 | 533412 | 4029.79 | 582 | 587 | 132.2 |
| C | 0 | 207 | 378185 | 2855.8 | 582 | 587 | 132.2 |
| C | 15 | 214 | 208793 | 1574.68 | 582 | 587 | 132.2 |
| D | 12 | 235 | 3690015 | 26752.01 | 570 | 555 | 137.9 |
| D | 2 | 249 | 140873 | 1017.44 | 570 | 555 | 137.9 |
| D | 12 | 17 | 97339 | 701.77 | 570 | 555 | 137.9 |
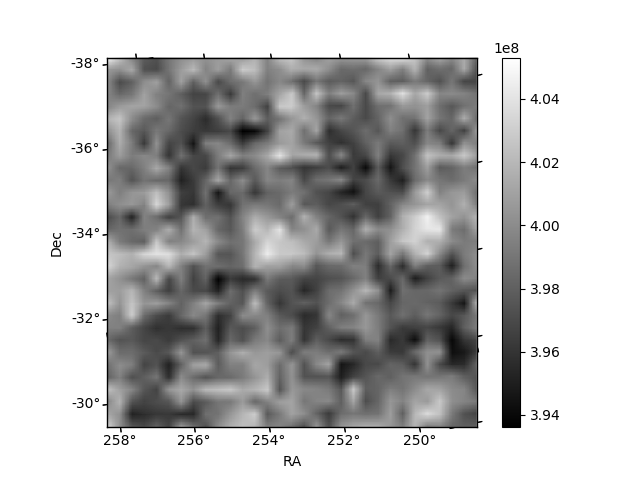
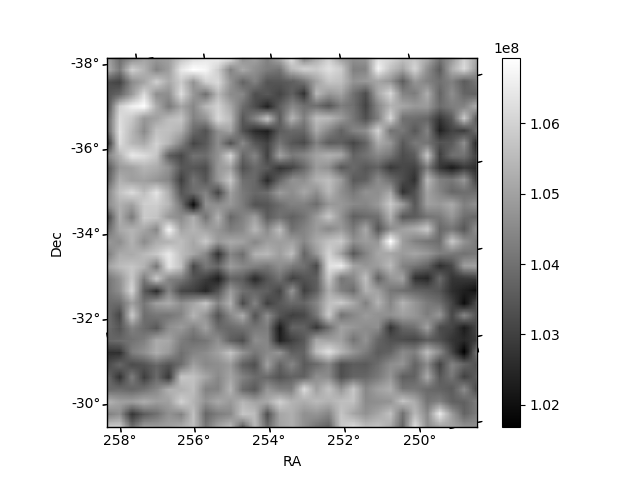
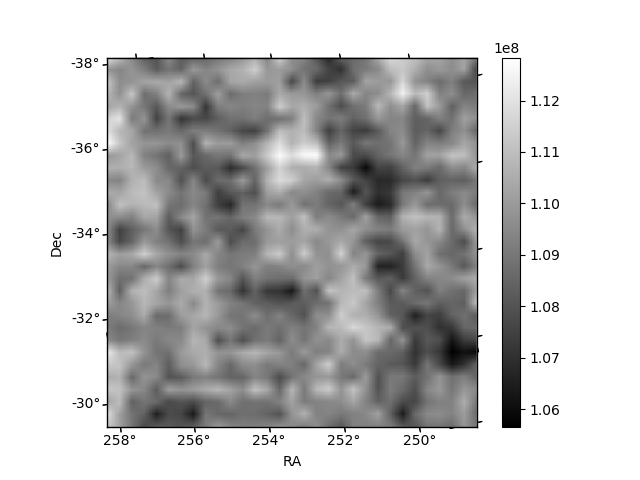
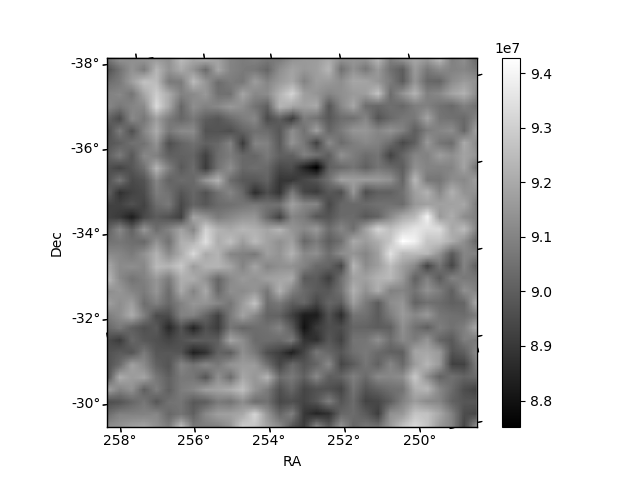
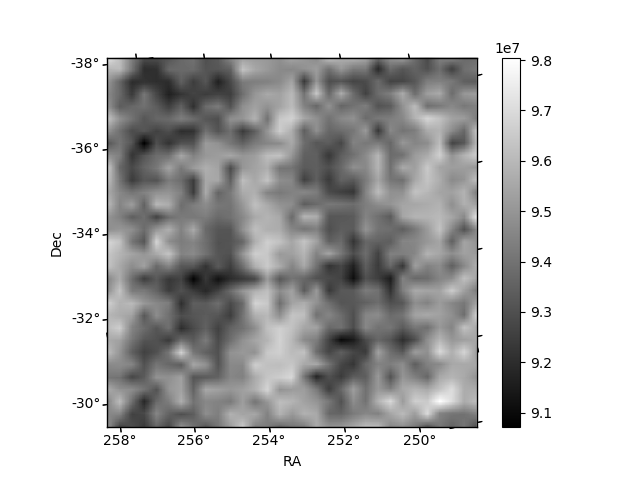
Histogram calculated using DETX and DETY for each event in the final _common_clean file
| Quadrant A |  |
 |
Quadrant B |
|---|---|---|---|
| Quadrant D |  |
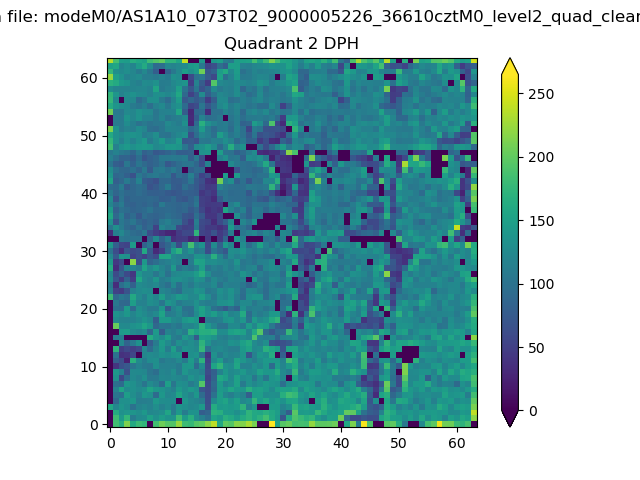 |
Quadrant C |
| Plot type | Count rate plots | Images |
|---|---|---|
| Comparison with Poisson distribution Blue bars denote a histogram of data divided into 1 sec bins. Red curve is a Poisson curve with rate = median count rate of data. |
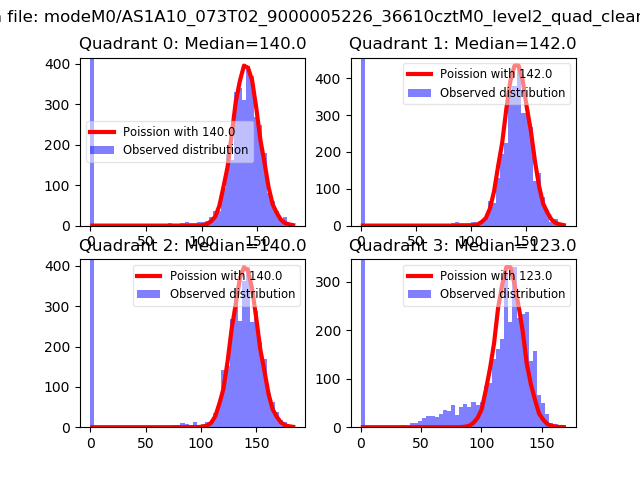 |
 |
| Quadrant-wise count rates Data is divided into 100 sec bins |
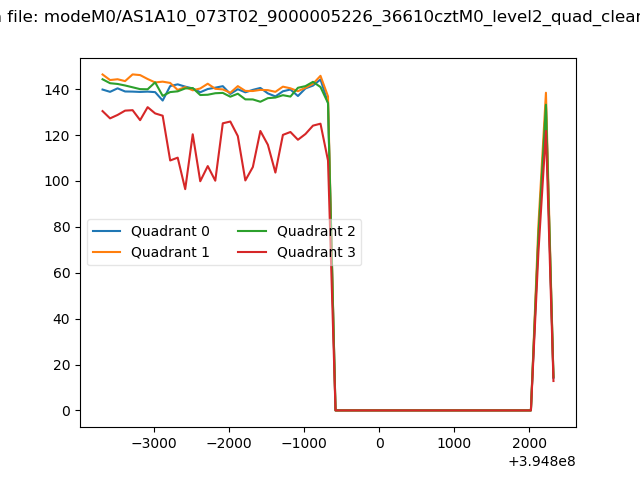 |
|
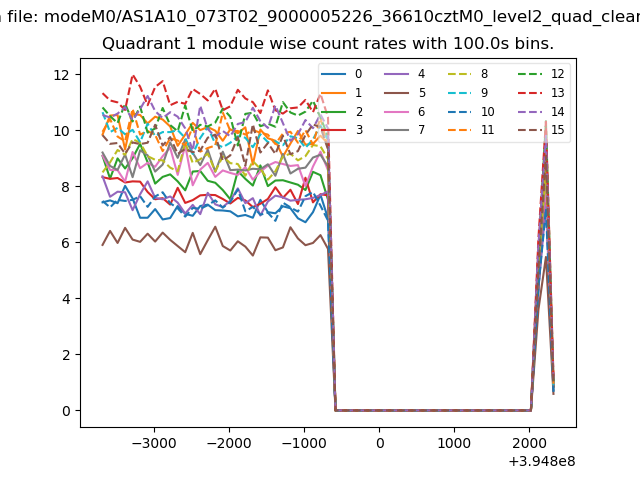
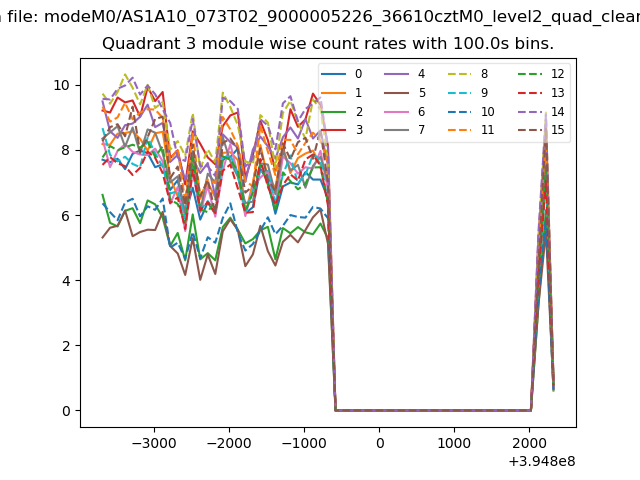
| Module-wise count rates for Quadrant A Data is divided into 100 sec bins |
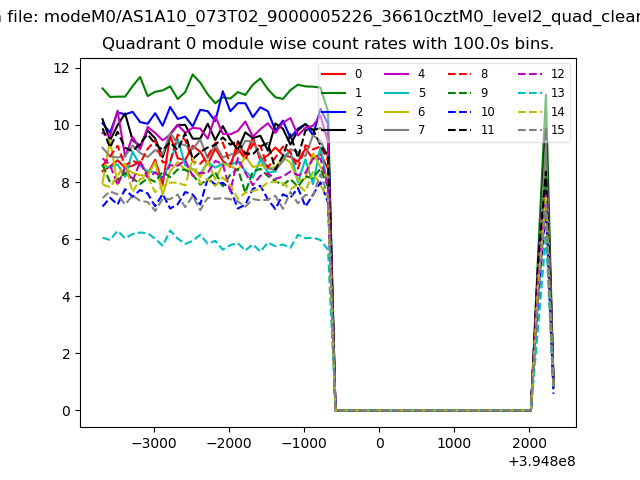 |
 |
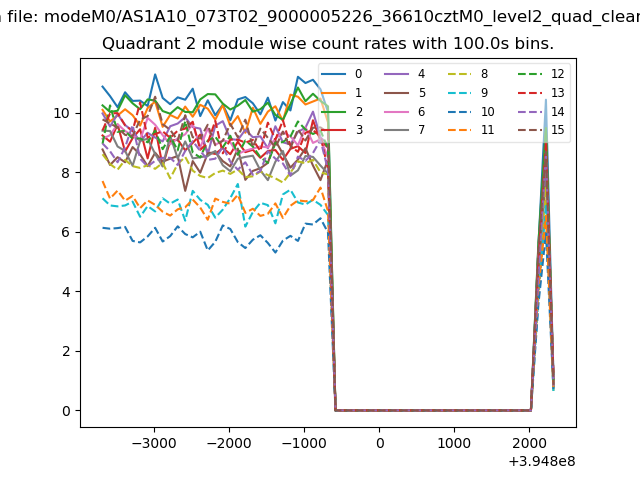
| Module-wise count rates for Quadrant B Data is divided into 100 sec bins |
 |
 |
| Module-wise count rates for Quadrant C Data is divided into 100 sec bins |
 |
 |
| Module-wise count rates for Quadrant D Data is divided into 100 sec bins |
 |
 |
| Parameter | Plot |
|---|---|
| CZT HV Monitor |  |
| D_VDD | 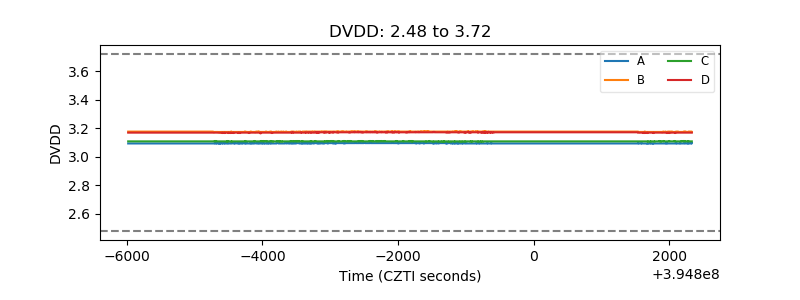 |
| Temperature 1 | 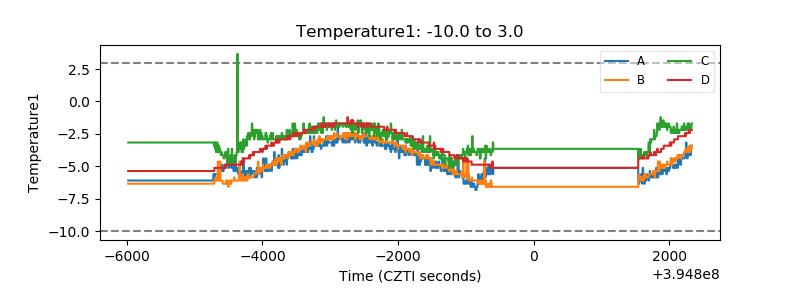 |
| Veto HV Monitor |  |
| Veto LLD | 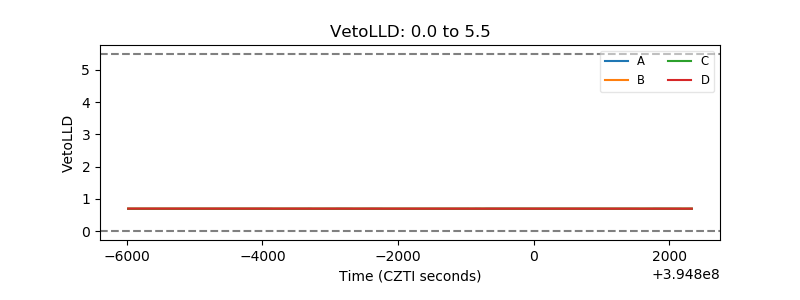 |
| Alpha Counter | 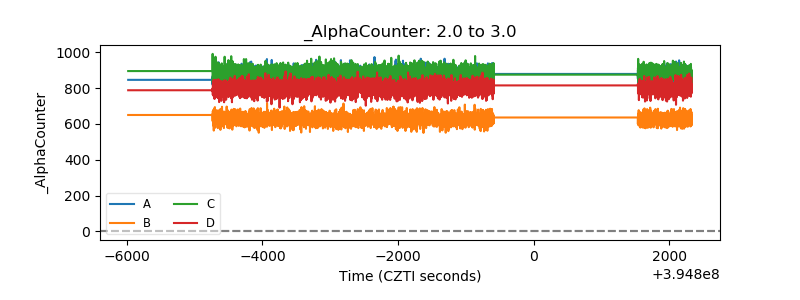 |
| _CPM_Rate | 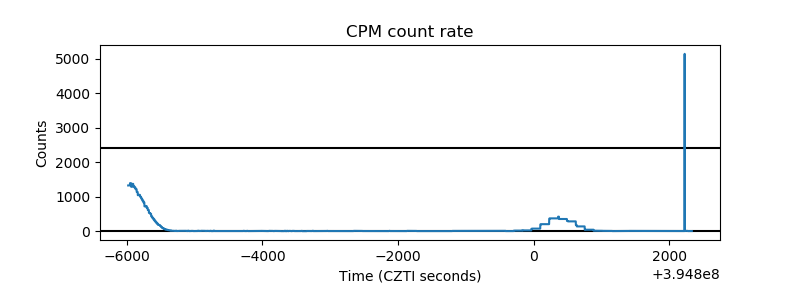 |
| CZT Counter | 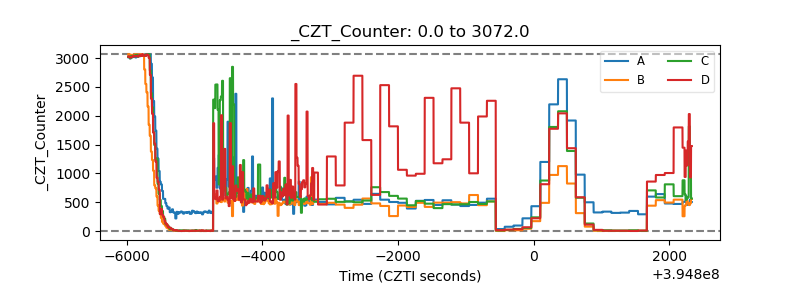 |
| +2.5 Volts monitor |  |
| +5 Volts monitor |  |
| _ROLL_ROT | 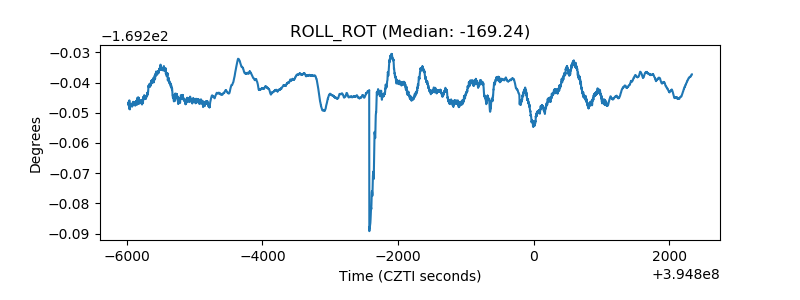 |
| _Roll_DEC | 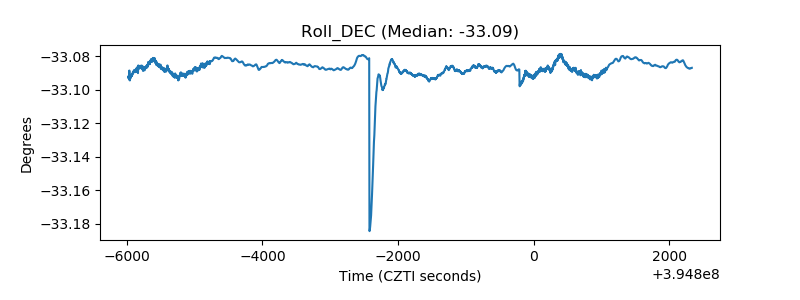 |
| _Roll_RA | 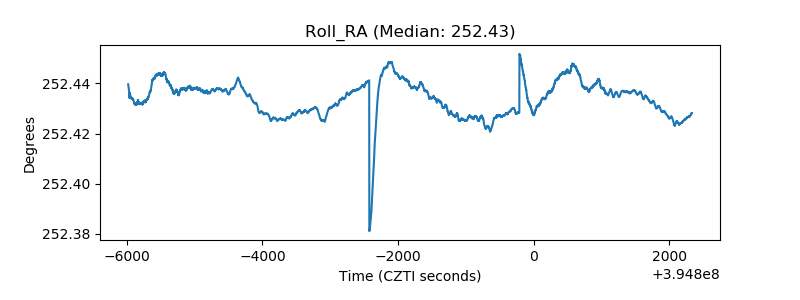 |
| Veto Counter | 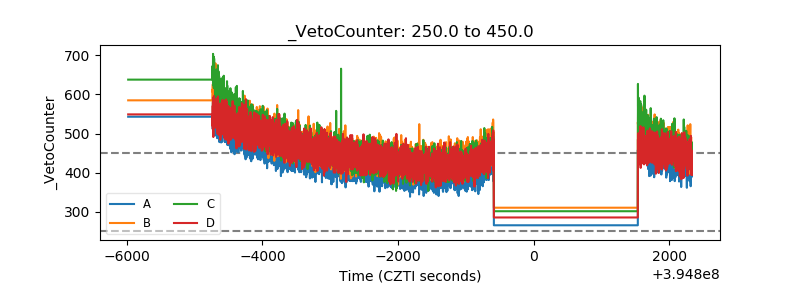 |