| Param | Original file | Final file |
|---|---|---|
| Filename | modeM0/AS1A10_073T02_9000005226_36612cztM0_level2.evt | modeM0/AS1A10_073T02_9000005226_36612cztM0_level2_quad_clean.evt |
| Size (bytes) | 516,991,680 | 90,172,800 |
| Size | 493.0 MB | 86.0 MB |
| Events in quadrant A | 2,823,269 | 598,949 |
| Events in quadrant B | 2,882,455 | 603,844 |
| Events in quadrant C | 3,996,583 | 582,786 |
| Events in quadrant D | 5,570,375 | 548,303 |
| Mode SS | |||
|---|---|---|---|
| Quadrant | BADHDUFLAG | Total packets | Discarded packets |
| A | 0 | 120 | 0 |
| B | 0 | 120 | 0 |
| C | 0 | 120 | 0 |
| D | 0 | 120 | 0 |
| Mode M0 | |||
|---|---|---|---|
| Quadrant | BADHDUFLAG | Total packets | Discarded packets |
| A | 0 | 11929 | 3 |
| B | 0 | 12019 | 2 |
| C | 0 | 15379 | 2 |
| D | 0 | 20538 | 2 |
| Mode M9 | |||
|---|---|---|---|
| Quadrant | BADHDUFLAG | Total packets | Discarded packets |
| A | 0 | 35 | 0 |
| B | 0 | 35 | 0 |
| C | 0 | 35 | 0 |
| D | 0 | 35 | 0 |
| Quadrant | Total seconds | Saturated seconds | Saturation percentage |
|---|---|---|---|
| A | 5665 | 9 | 0.158870% |
| B | 5665 | 17 | 0.300088% |
| C | 5665 | 309 | 5.454545% |
| D | 5665 | 311 | 5.489850% |
Noise dominated data is calculated using 1-second bins in cleaned event files. If a bin has >2000 counts, and if more than 50% of those come from <1% of pixels, then it is considered to be noise-dominated and hence unusable.
| Quadrant | # 1 sec bins | Bins with >0 counts | Bins with >2000 counts | High rate bins dominated by noise | Noise dominated (total time) | Noise dominated (detector-on time) | Marked lightcurve |
|---|---|---|---|---|---|---|---|
| A | 9281 | 5667 | 0 | 0 | 0.00% | 0.00% | 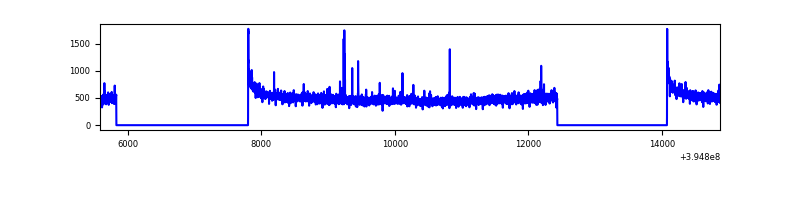 |
| B | 9281 | 5667 | 9 | 9 | 0.10% | 0.16% | 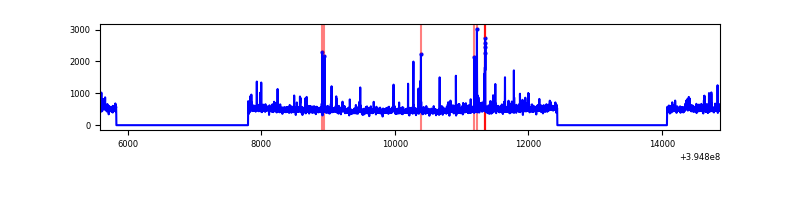 |
| C | 9281 | 5667 | 245 | 245 | 2.64% | 4.32% | 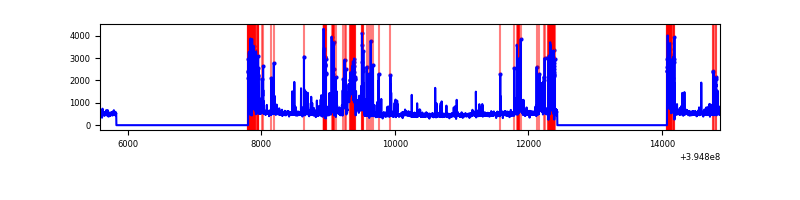 |
| D | 9281 | 5667 | 300 | 300 | 3.23% | 5.29% | 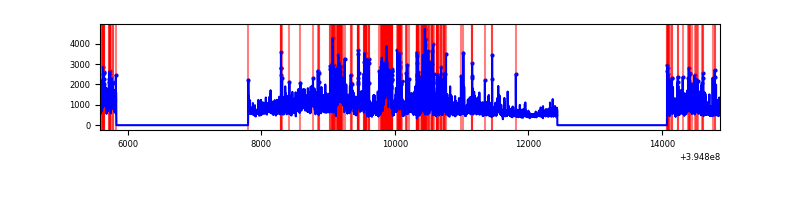 |
Top three noisy pixels from each quadrant. If the there are fewer than three noisy pixels in the level2.evt file, extra rows are filled as -1
| Pixel properties | Quadrant properties | ||||||
|---|---|---|---|---|---|---|---|
| Quadrant | DetID | PixID | Counts | Sigma | Mean | Median | Sigma |
| A | 10 | 83 | 211941 | 1568.96 | 664 | 652 | 134.7 |
| A | 15 | 223 | 41054 | 300.01 | 664 | 652 | 134.7 |
| A | 13 | 254 | 7064 | 47.61 | 664 | 652 | 134.7 |
| B | 4 | 171 | 82890 | 651.85 | 657 | 640 | 126.2 |
| B | 0 | 219 | 69423 | 545.12 | 657 | 640 | 126.2 |
| B | 0 | 213 | 35194 | 273.85 | 657 | 640 | 126.2 |
| C | 0 | 207 | 666461 | 4551.71 | 624 | 626 | 146.3 |
| C | 0 | 10 | 491603 | 3356.36 | 624 | 626 | 146.3 |
| C | 15 | 214 | 238390 | 1625.38 | 624 | 626 | 146.3 |
| D | 12 | 235 | 2626160 | 16717.02 | 633 | 614 | 157.1 |
| D | 2 | 153 | 100138 | 633.68 | 633 | 614 | 157.1 |
| D | 10 | 199 | 64833 | 408.89 | 633 | 614 | 157.1 |
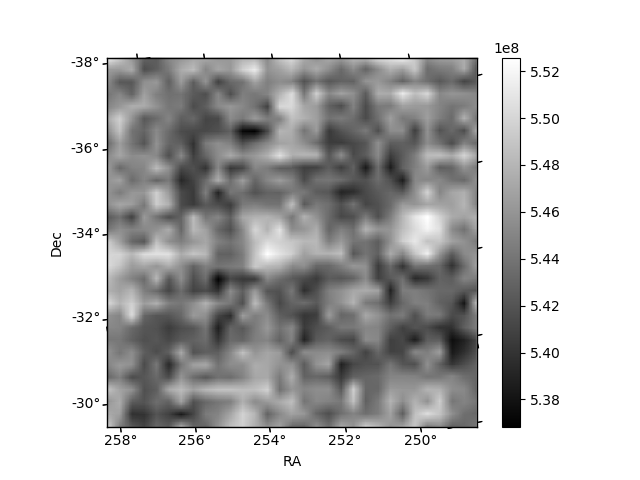
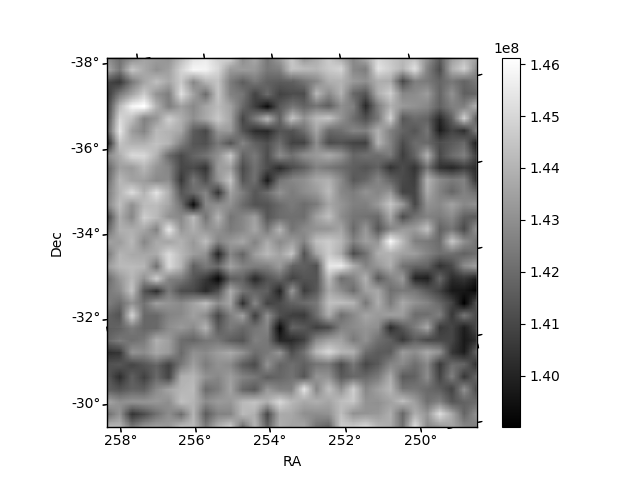
Histogram calculated using DETX and DETY for each event in the final _common_clean file
| Quadrant A | 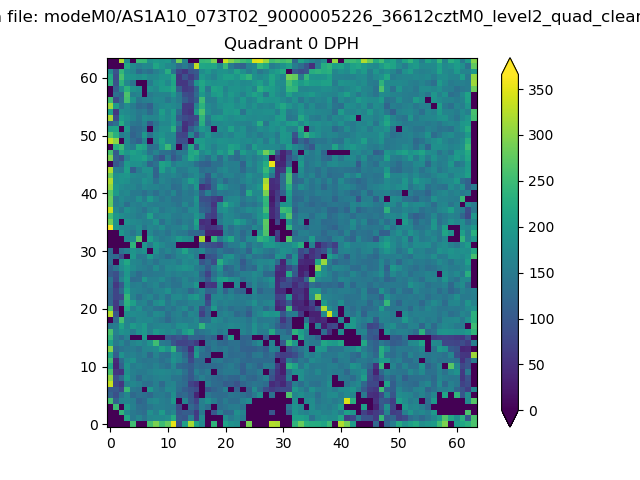 |
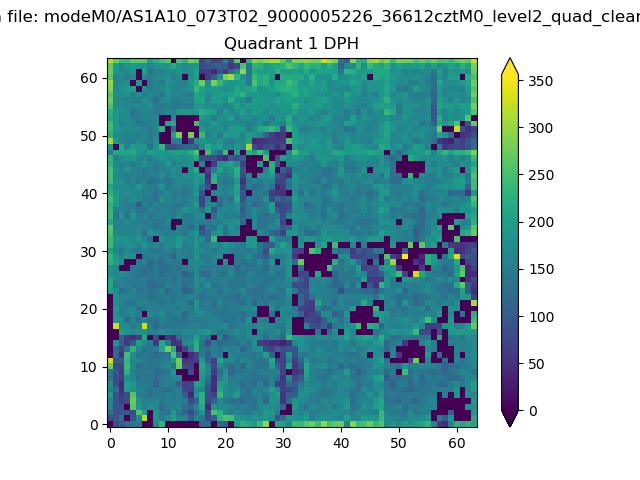 |
Quadrant B |
|---|---|---|---|
| Quadrant D | 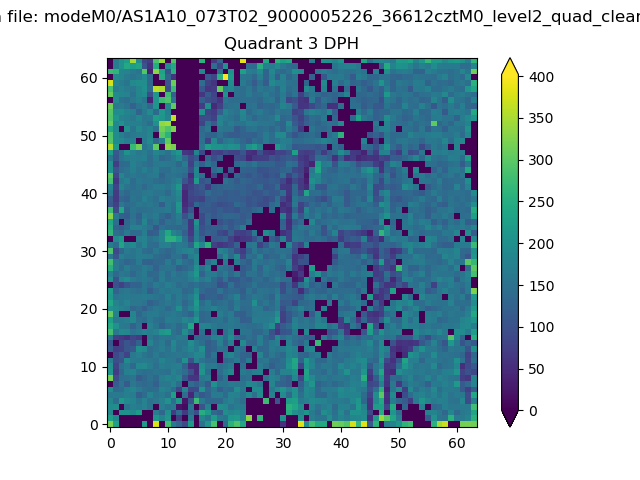 |
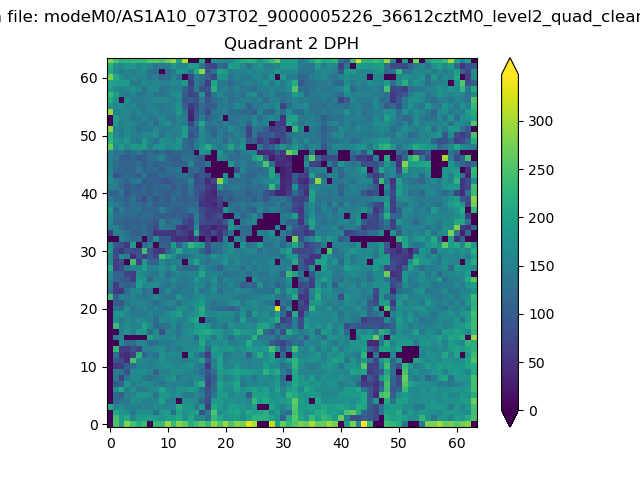 |
Quadrant C |
| Plot type | Count rate plots | Images |
|---|---|---|
| Comparison with Poisson distribution Blue bars denote a histogram of data divided into 1 sec bins. Red curve is a Poisson curve with rate = median count rate of data. |
 |
 |
| Quadrant-wise count rates Data is divided into 100 sec bins |
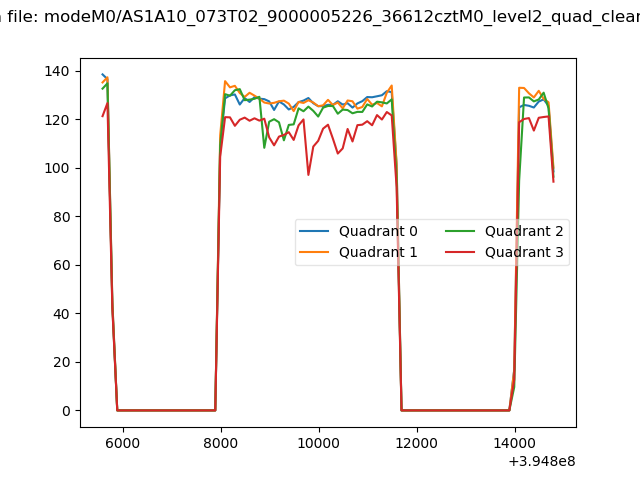 |
|
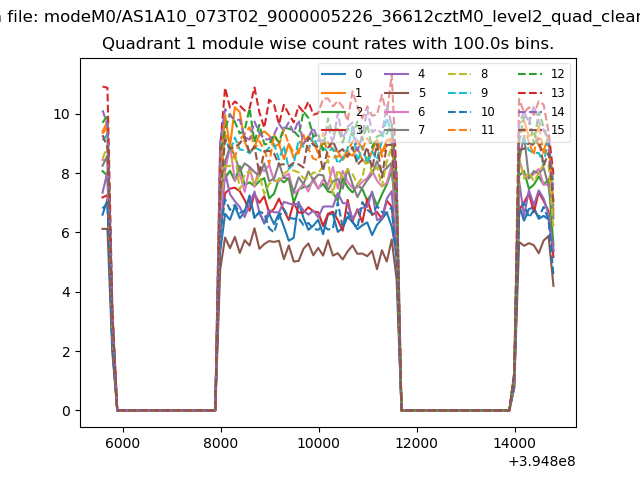
| Module-wise count rates for Quadrant A Data is divided into 100 sec bins |
 |
 |
| Module-wise count rates for Quadrant B Data is divided into 100 sec bins |
 |
 |
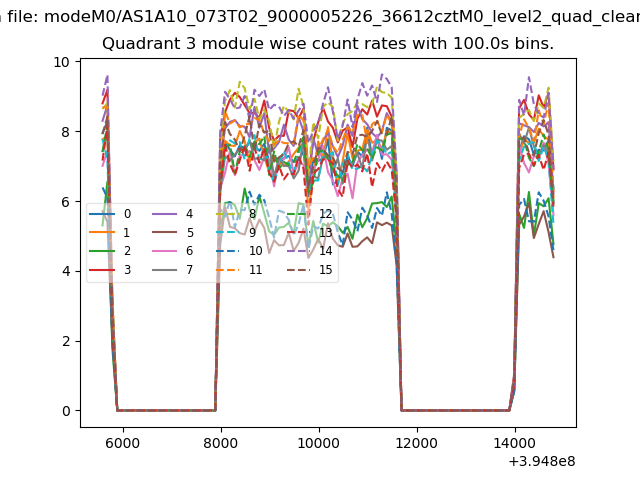
| Module-wise count rates for Quadrant C Data is divided into 100 sec bins |
 |
 |
| Module-wise count rates for Quadrant D Data is divided into 100 sec bins |
 |
 |
| Parameter | Plot |
|---|---|
| CZT HV Monitor | 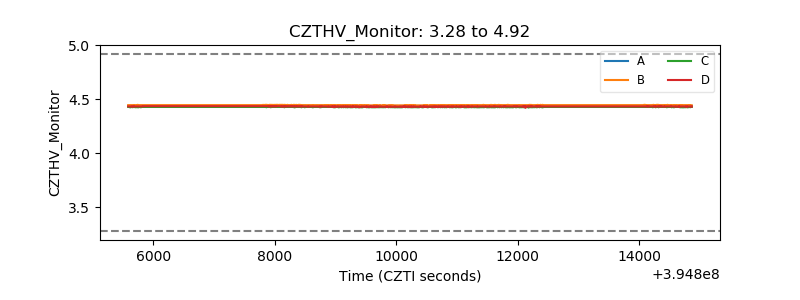 |
| D_VDD | 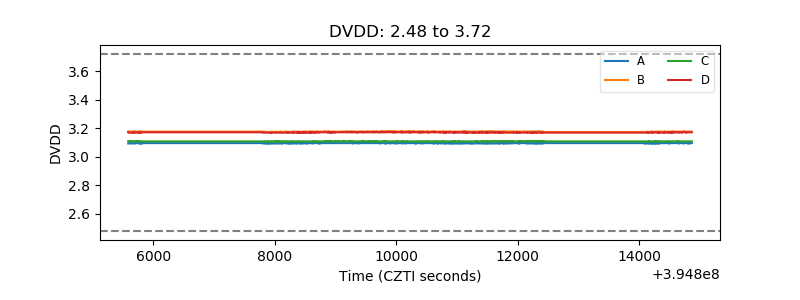 |
| Temperature 1 | 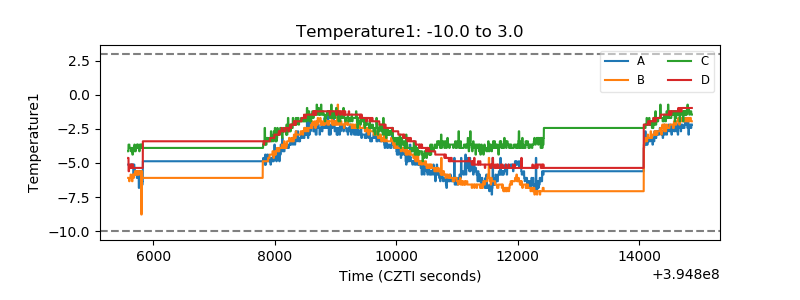 |
| Veto HV Monitor | 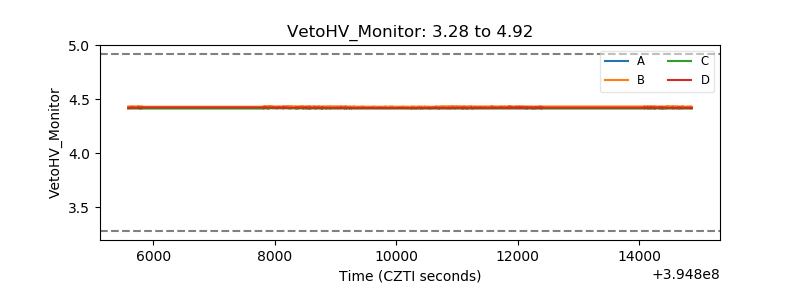 |
| Veto LLD |  |
| Alpha Counter | 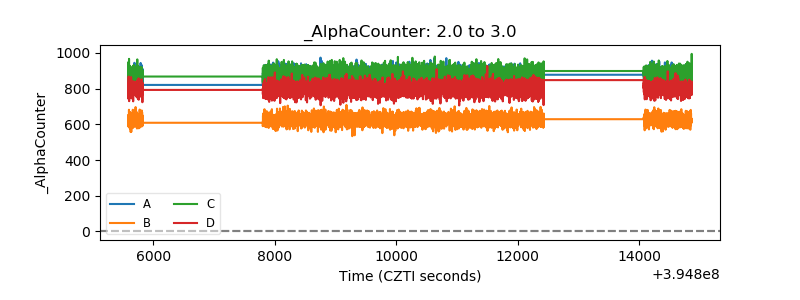 |
| _CPM_Rate | 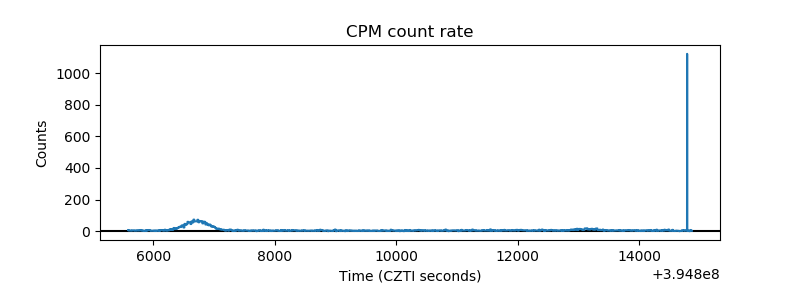 |
| CZT Counter | 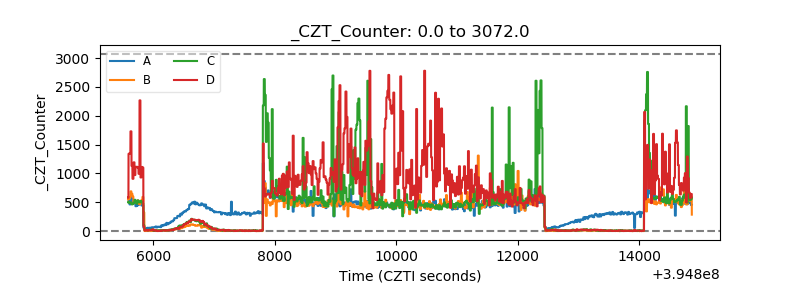 |
| +2.5 Volts monitor |  |
| +5 Volts monitor |  |
| _ROLL_ROT |  |
| _Roll_DEC | 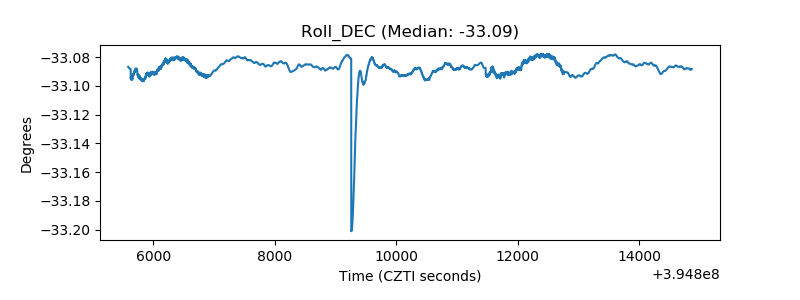 |
| _Roll_RA | 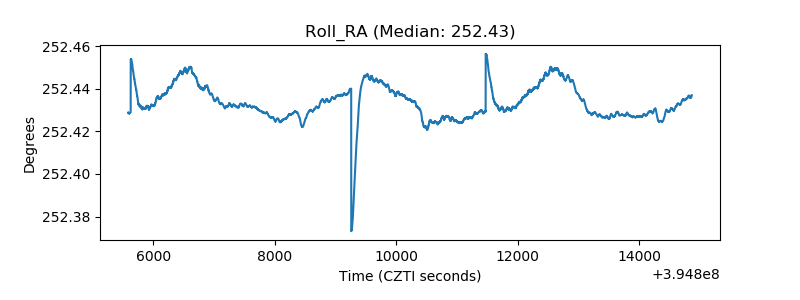 |
| Veto Counter |  |