| Param | Original file | Final file |
|---|---|---|
| Filename | modeM0/AS1A10_073T02_9000005226_36613cztM0_level2.evt | modeM0/AS1A10_073T02_9000005226_36613cztM0_level2_quad_clean.evt |
| Size (bytes) | 544,610,880 | 82,252,800 |
| Size | 519.4 MB | 78.4 MB |
| Events in quadrant A | 2,997,475 | 541,852 |
| Events in quadrant B | 3,739,730 | 530,114 |
| Events in quadrant C | 3,763,326 | 523,697 |
| Events in quadrant D | 5,596,985 | 486,320 |
| Mode SS | |||
|---|---|---|---|
| Quadrant | BADHDUFLAG | Total packets | Discarded packets |
| A | 0 | 122 | 0 |
| B | 0 | 122 | 0 |
| C | 0 | 122 | 0 |
| D | 0 | 122 | 0 |
| Mode M0 | |||
|---|---|---|---|
| Quadrant | BADHDUFLAG | Total packets | Discarded packets |
| A | 0 | 12584 | 3 |
| B | 0 | 14804 | 2 |
| C | 0 | 14793 | 2 |
| D | 0 | 20729 | 2 |
| Mode M9 | |||
|---|---|---|---|
| Quadrant | BADHDUFLAG | Total packets | Discarded packets |
| A | 0 | 29 | 0 |
| B | 0 | 29 | 0 |
| C | 0 | 29 | 0 |
| D | 0 | 29 | 0 |
| Quadrant | Total seconds | Saturated seconds | Saturation percentage |
|---|---|---|---|
| A | 5843 | 20 | 0.342290% |
| B | 5843 | 366 | 6.263906% |
| C | 5843 | 158 | 2.704090% |
| D | 5843 | 386 | 6.606195% |
Noise dominated data is calculated using 1-second bins in cleaned event files. If a bin has >2000 counts, and if more than 50% of those come from <1% of pixels, then it is considered to be noise-dominated and hence unusable.
| Quadrant | # 1 sec bins | Bins with >0 counts | Bins with >2000 counts | High rate bins dominated by noise | Noise dominated (total time) | Noise dominated (detector-on time) | Marked lightcurve |
|---|---|---|---|---|---|---|---|
| A | 8829 | 5845 | 10 | 10 | 0.11% | 0.17% | 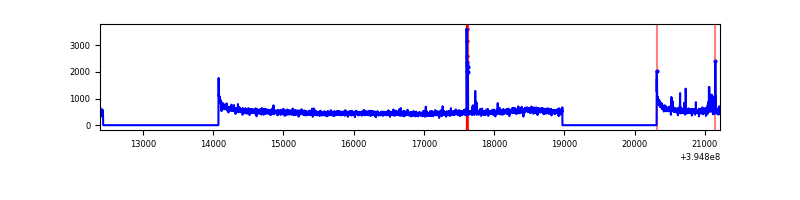 |
| B | 8829 | 5845 | 264 | 264 | 2.99% | 4.52% | 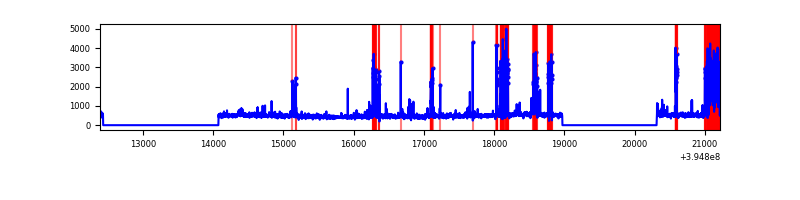 |
| C | 8829 | 5845 | 117 | 117 | 1.33% | 2.00% | 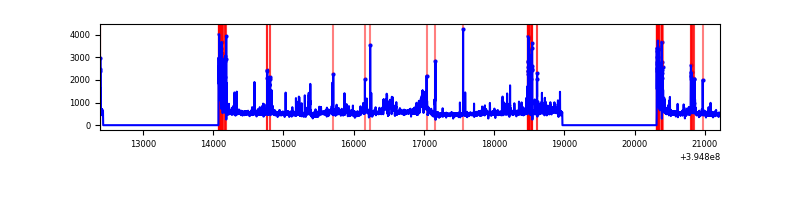 |
| D | 8829 | 5845 | 364 | 364 | 4.12% | 6.23% | 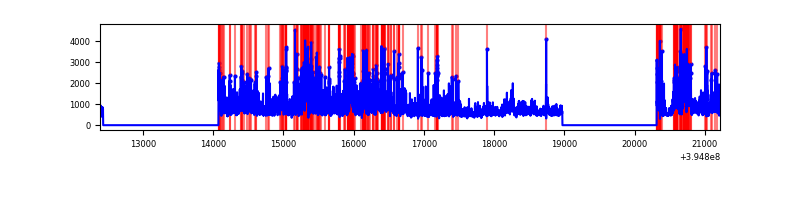 |
Top three noisy pixels from each quadrant. If the there are fewer than three noisy pixels in the level2.evt file, extra rows are filled as -1
| Pixel properties | Quadrant properties | ||||||
|---|---|---|---|---|---|---|---|
| Quadrant | DetID | PixID | Counts | Sigma | Mean | Median | Sigma |
| A | 10 | 83 | 221508 | 1612.94 | 677 | 665 | 136.9 |
| A | 15 | 223 | 150119 | 1091.55 | 677 | 665 | 136.9 |
| A | 13 | 254 | 8196 | 55.0 | 677 | 665 | 136.9 |
| B | 4 | 171 | 777251 | 6134.95 | 653 | 634 | 126.6 |
| B | 0 | 219 | 148232 | 1165.96 | 653 | 634 | 126.6 |
| B | 15 | 32 | 61797 | 483.16 | 653 | 634 | 126.6 |
| C | 0 | 207 | 465919 | 3065.75 | 645 | 649 | 151.8 |
| C | 0 | 10 | 329195 | 2164.85 | 645 | 649 | 151.8 |
| C | 15 | 214 | 247926 | 1629.36 | 645 | 649 | 151.8 |
| D | 12 | 235 | 2479870 | 15526.83 | 643 | 624 | 159.7 |
| D | 12 | 128 | 173608 | 1083.35 | 643 | 624 | 159.7 |
| D | 13 | 171 | 144018 | 898.04 | 643 | 624 | 159.7 |
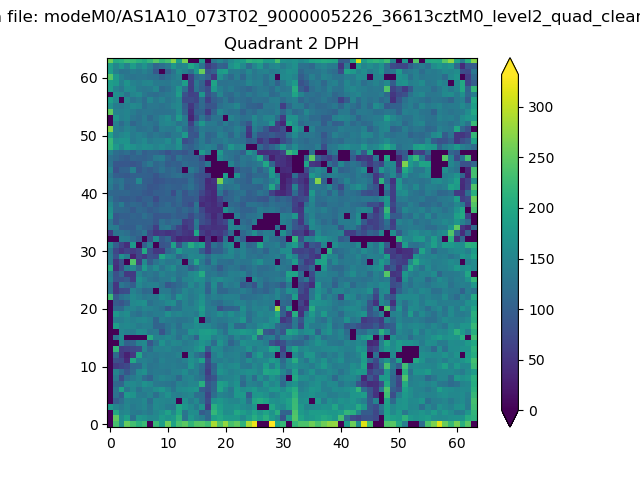
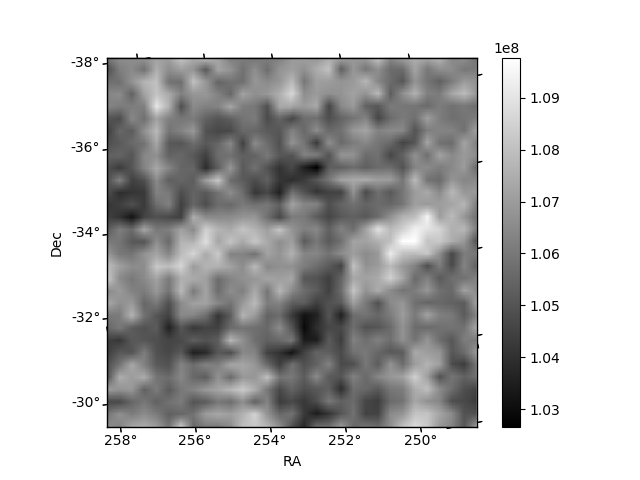
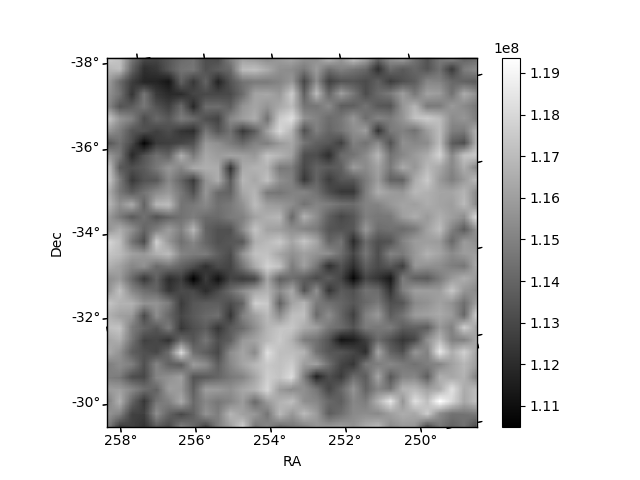
Histogram calculated using DETX and DETY for each event in the final _common_clean file
| Quadrant A | 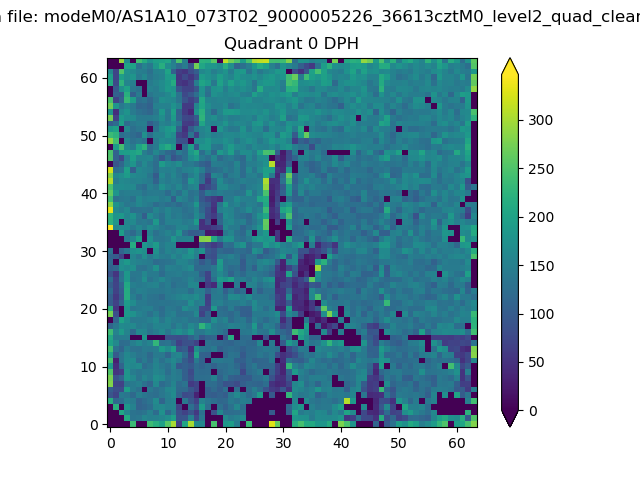 |
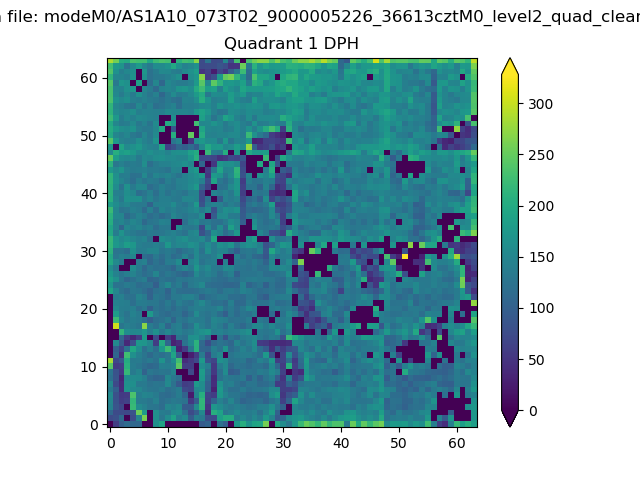 |
Quadrant B |
|---|---|---|---|
| Quadrant D | 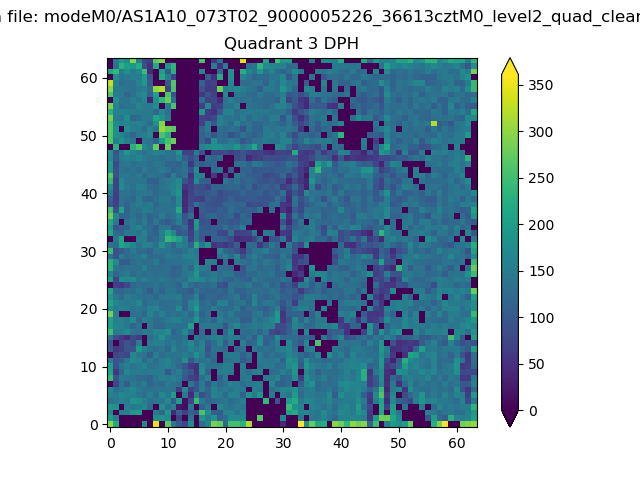 |
 |
Quadrant C |
| Plot type | Count rate plots | Images |
|---|---|---|
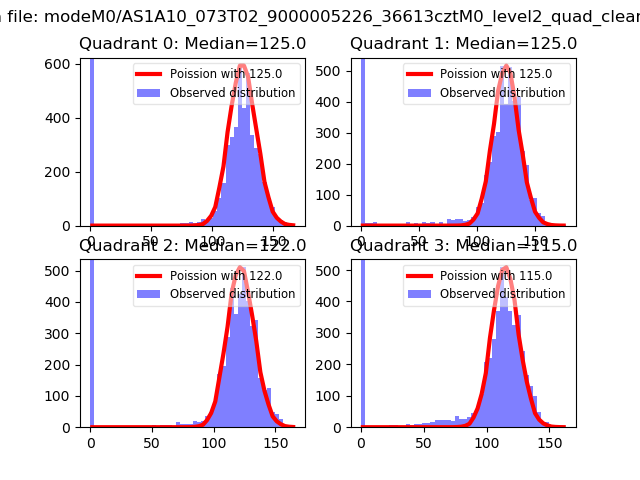
| Comparison with Poisson distribution Blue bars denote a histogram of data divided into 1 sec bins. Red curve is a Poisson curve with rate = median count rate of data. |
 |
 |
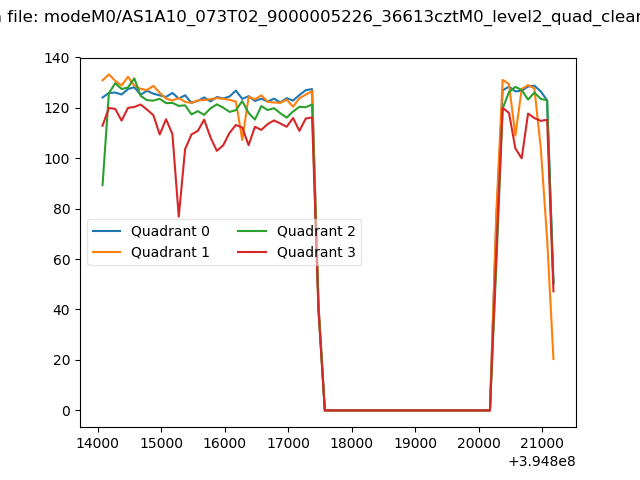
| Quadrant-wise count rates Data is divided into 100 sec bins |
 |
|
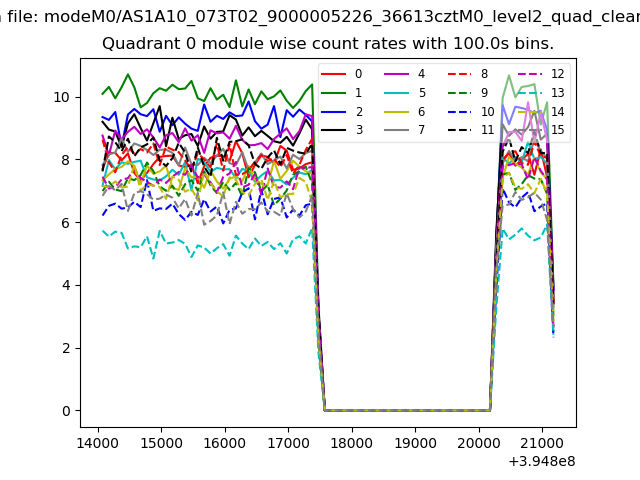
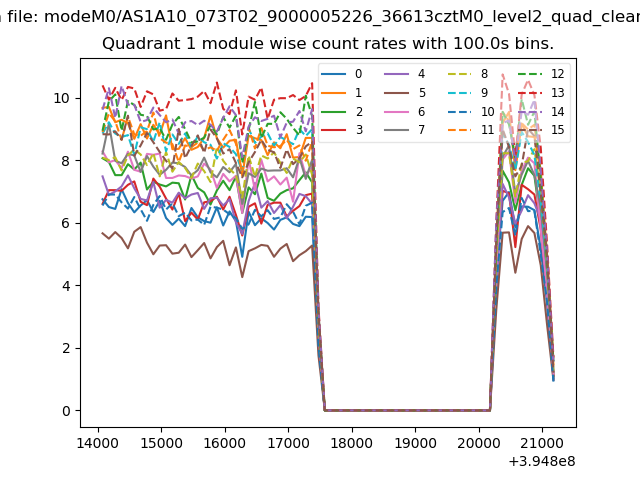
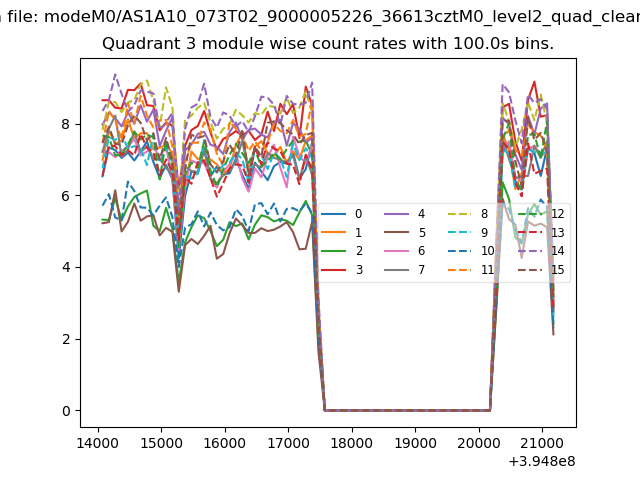
| Module-wise count rates for Quadrant A Data is divided into 100 sec bins |
 |
 |
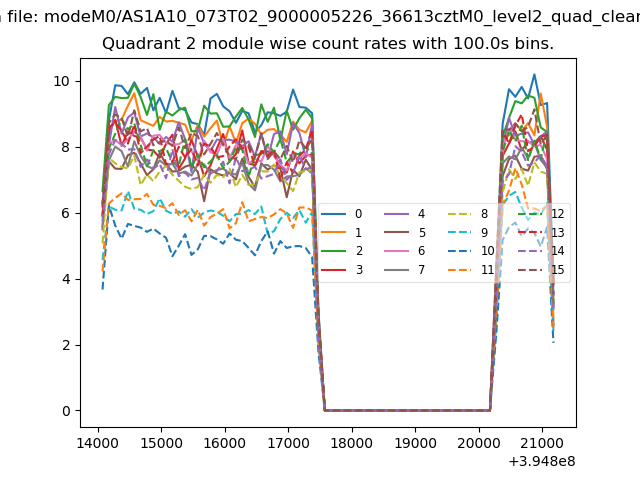
| Module-wise count rates for Quadrant B Data is divided into 100 sec bins |
 |
 |
| Module-wise count rates for Quadrant C Data is divided into 100 sec bins |
 |
 |
| Module-wise count rates for Quadrant D Data is divided into 100 sec bins |
 |
 |
| Parameter | Plot |
|---|---|
| CZT HV Monitor | 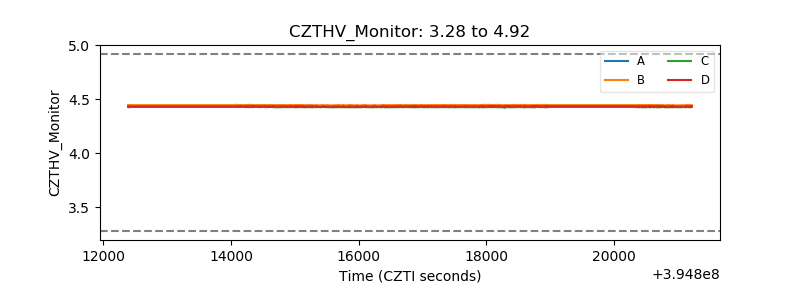 |
| D_VDD | 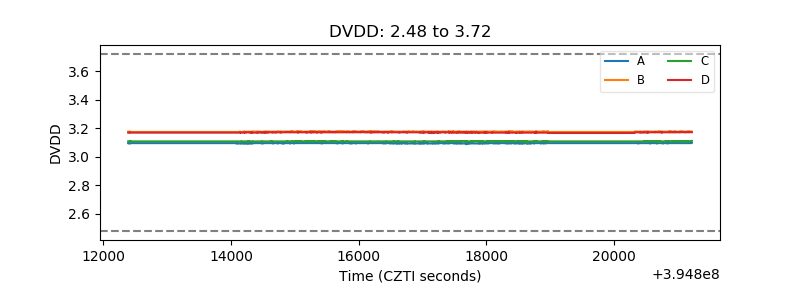 |
| Temperature 1 | 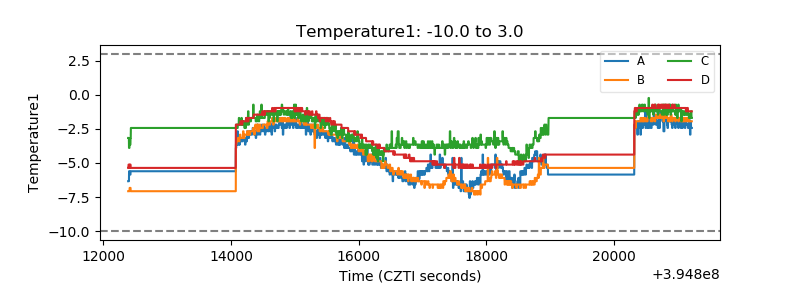 |
| Veto HV Monitor | 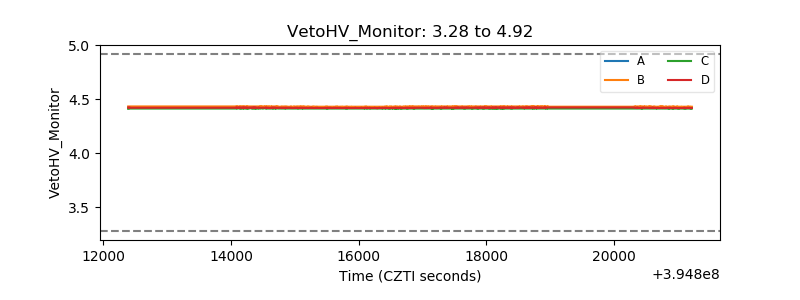 |
| Veto LLD | 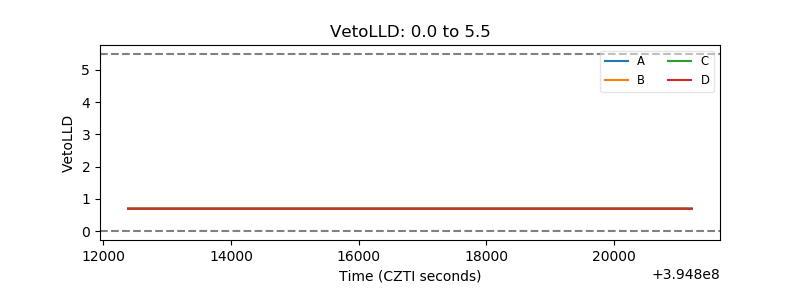 |
| Alpha Counter | 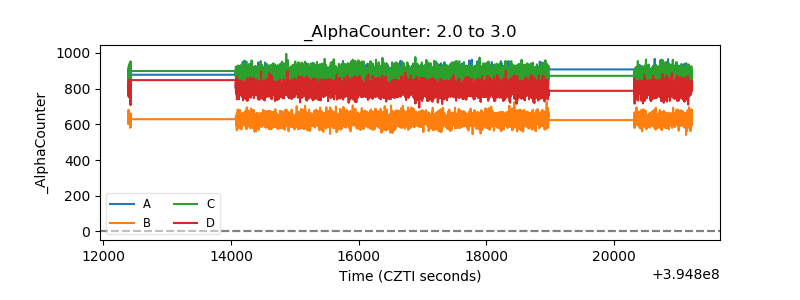 |
| _CPM_Rate | 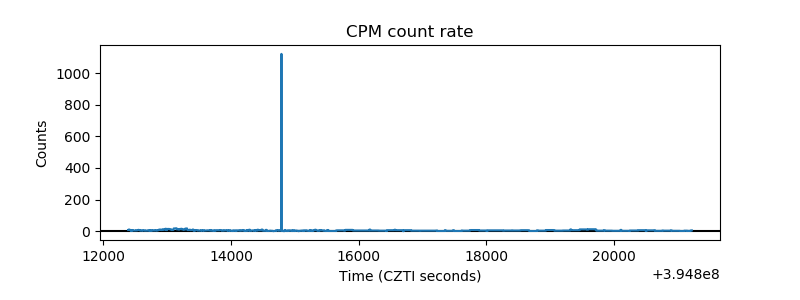 |
| CZT Counter |  |
| +2.5 Volts monitor |  |
| +5 Volts monitor |  |
| _ROLL_ROT | 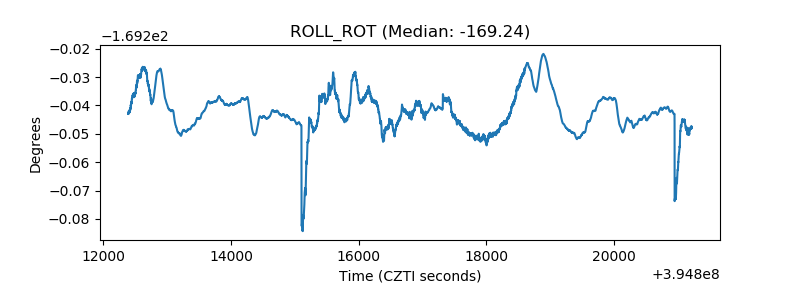 |
| _Roll_DEC | 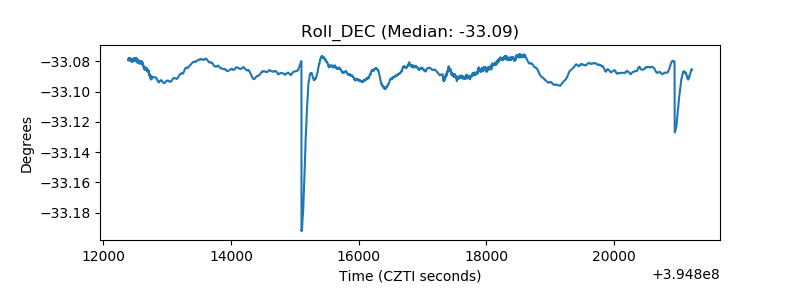 |
| _Roll_RA | 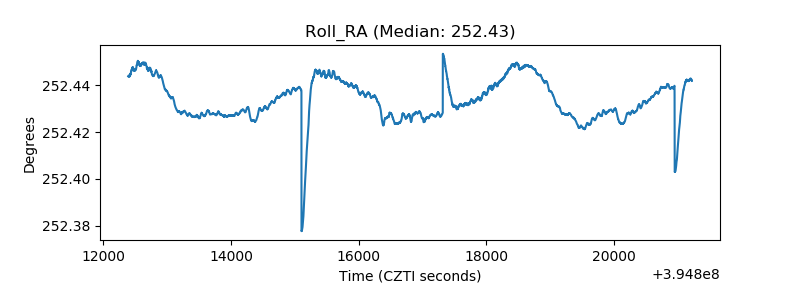 |
| Veto Counter | 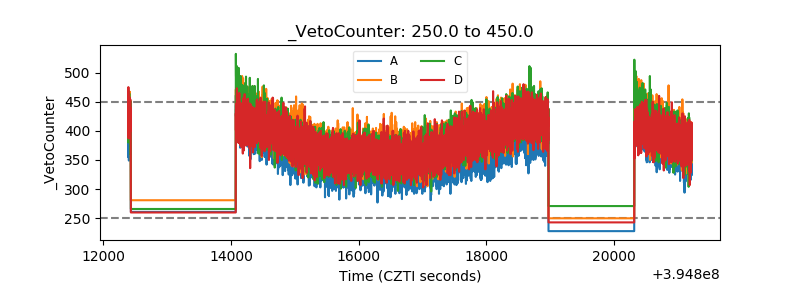 |