| Param | Original file | Final file |
|---|---|---|
| Filename | modeM0/AS1A10_073T02_9000005226_36614cztM0_level2.evt | modeM0/AS1A10_073T02_9000005226_36614cztM0_level2_quad_clean.evt |
| Size (bytes) | 869,284,800 | 67,014,720 |
| Size | 829.0 MB | 63.9 MB |
| Events in quadrant A | 3,033,952 | 489,514 |
| Events in quadrant B | 12,314,092 | 236,103 |
| Events in quadrant C | 3,689,392 | 469,297 |
| Events in quadrant D | 6,889,963 | 418,980 |
| Mode SS | |||
|---|---|---|---|
| Quadrant | BADHDUFLAG | Total packets | Discarded packets |
| A | 0 | 120 | 0 |
| B | 0 | 120 | 0 |
| C | 0 | 120 | 0 |
| D | 0 | 120 | 0 |
| Mode M0 | |||
|---|---|---|---|
| Quadrant | BADHDUFLAG | Total packets | Discarded packets |
| A | 0 | 12767 | 3 |
| B | 0 | 40550 | 2 |
| C | 0 | 14668 | 2 |
| D | 0 | 24586 | 2 |
| Mode M9 | |||
|---|---|---|---|
| Quadrant | BADHDUFLAG | Total packets | Discarded packets |
| A | 0 | 18 | 0 |
| B | 0 | 18 | 0 |
| C | 0 | 18 | 0 |
| D | 0 | 19 | 0 |
| Quadrant | Total seconds | Saturated seconds | Saturation percentage |
|---|---|---|---|
| A | 5918 | 31 | 0.523826% |
| B | 5918 | 4400 | 74.349442% |
| C | 5918 | 182 | 3.075363% |
| D | 5918 | 747 | 12.622508% |
Noise dominated data is calculated using 1-second bins in cleaned event files. If a bin has >2000 counts, and if more than 50% of those come from <1% of pixels, then it is considered to be noise-dominated and hence unusable.
| Quadrant | # 1 sec bins | Bins with >0 counts | Bins with >2000 counts | High rate bins dominated by noise | Noise dominated (total time) | Noise dominated (detector-on time) | Marked lightcurve |
|---|---|---|---|---|---|---|---|
| A | 7202 | 5919 | 14 | 14 | 0.19% | 0.24% | 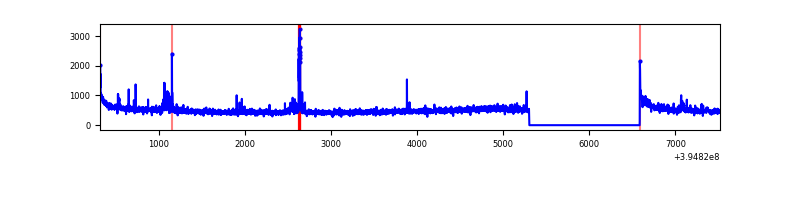 |
| B | 7202 | 5918 | 4044 | 4044 | 56.15% | 68.33% | 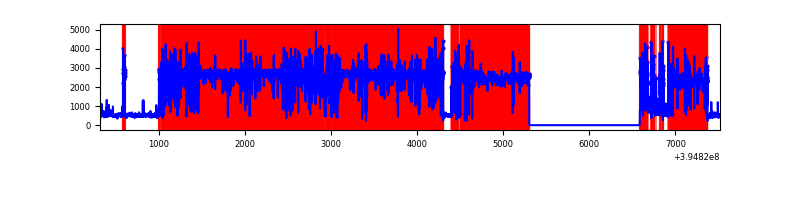 |
| C | 7202 | 5919 | 148 | 148 | 2.05% | 2.50% | 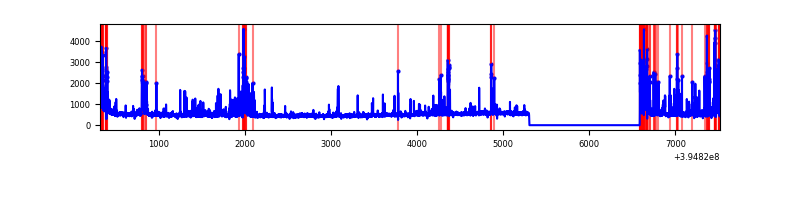 |
| D | 7202 | 5919 | 776 | 776 | 10.77% | 13.11% | 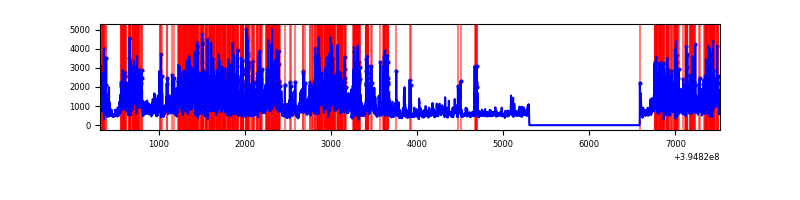 |
Top three noisy pixels from each quadrant. If the there are fewer than three noisy pixels in the level2.evt file, extra rows are filled as -1
| Pixel properties | Quadrant properties | ||||||
|---|---|---|---|---|---|---|---|
| Quadrant | DetID | PixID | Counts | Sigma | Mean | Median | Sigma |
| A | 10 | 83 | 227831 | 1635.71 | 684 | 673 | 138.9 |
| A | 15 | 223 | 146708 | 1051.57 | 684 | 673 | 138.9 |
| A | 13 | 254 | 9337 | 62.39 | 684 | 673 | 138.9 |
| B | 4 | 171 | 10804575 | 179951.95 | 306 | 299 | 60.0 |
| B | 5 | 255 | 95852 | 1591.49 | 306 | 299 | 60.0 |
| B | 0 | 213 | 60347 | 1000.14 | 306 | 299 | 60.0 |
| C | 0 | 10 | 541945 | 3553.75 | 649 | 654 | 152.3 |
| C | 15 | 214 | 250815 | 1642.39 | 649 | 654 | 152.3 |
| C | 14 | 254 | 244667 | 1602.02 | 649 | 654 | 152.3 |
| D | 12 | 235 | 3995168 | 25557.86 | 633 | 615 | 156.3 |
| D | 13 | 171 | 124575 | 793.12 | 633 | 615 | 156.3 |
| D | 13 | 249 | 96211 | 611.64 | 633 | 615 | 156.3 |
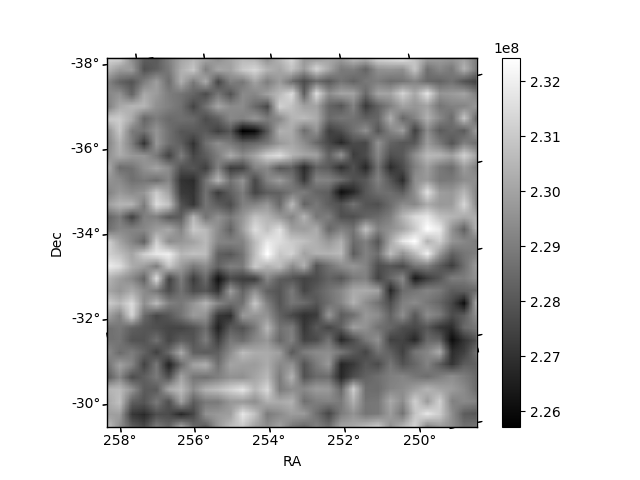
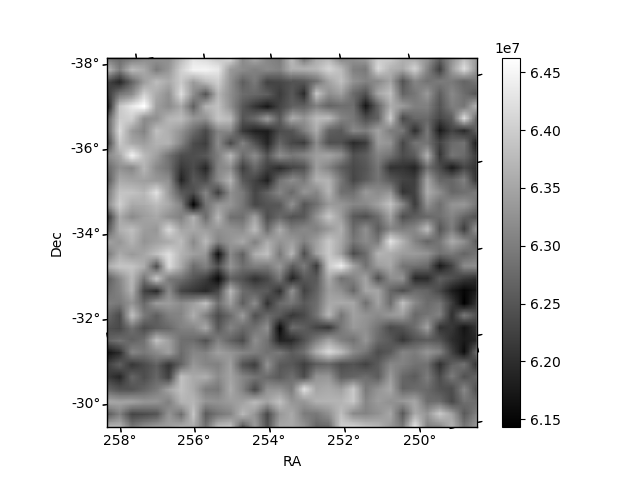
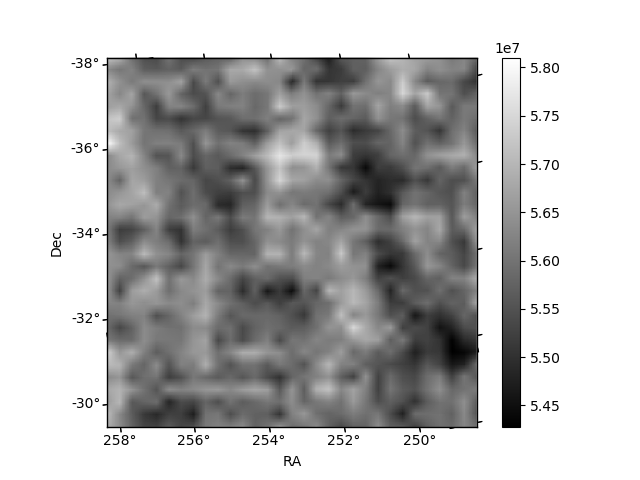
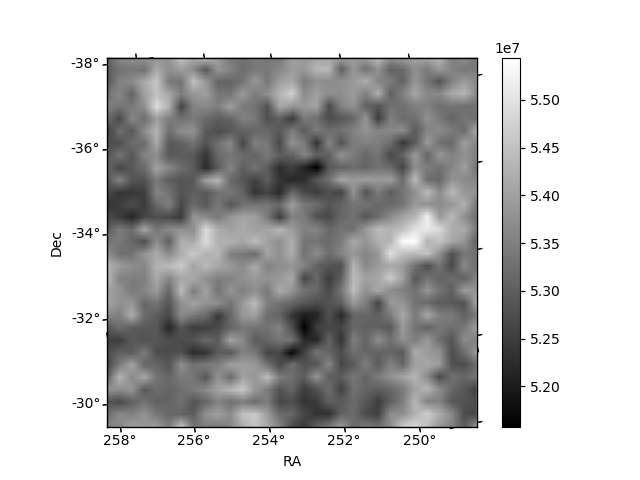
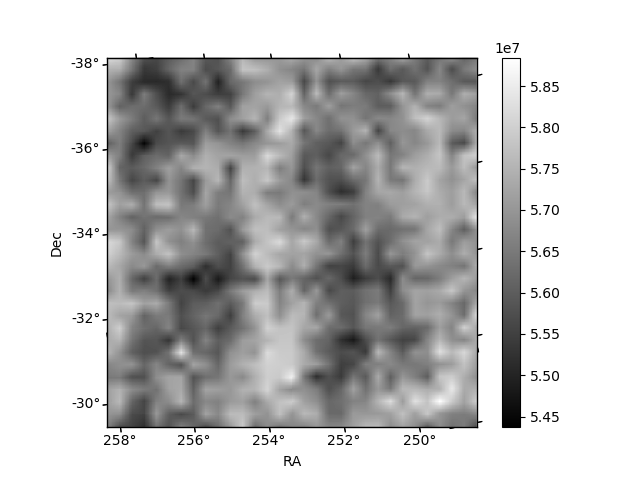
Histogram calculated using DETX and DETY for each event in the final _common_clean file
| Quadrant A | 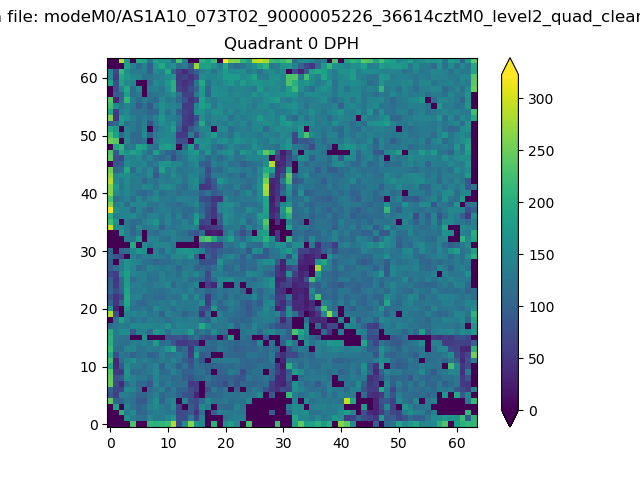 |
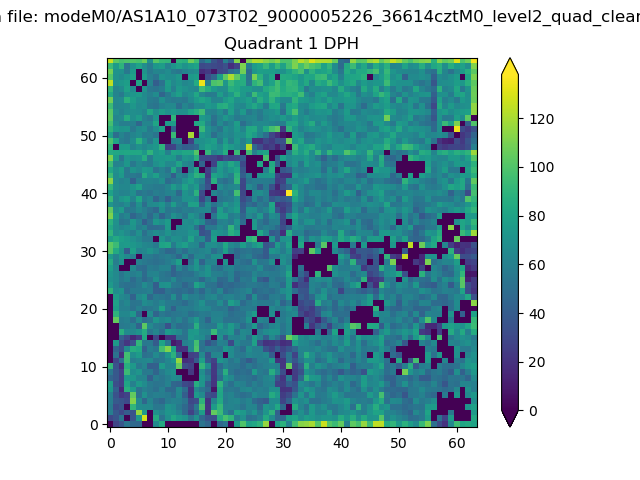 |
Quadrant B |
|---|---|---|---|
| Quadrant D | 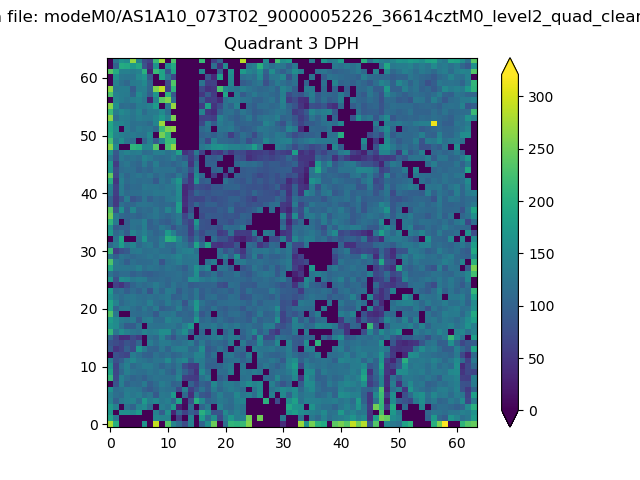 |
 |
Quadrant C |
| Plot type | Count rate plots | Images |
|---|---|---|
| Comparison with Poisson distribution Blue bars denote a histogram of data divided into 1 sec bins. Red curve is a Poisson curve with rate = median count rate of data. |
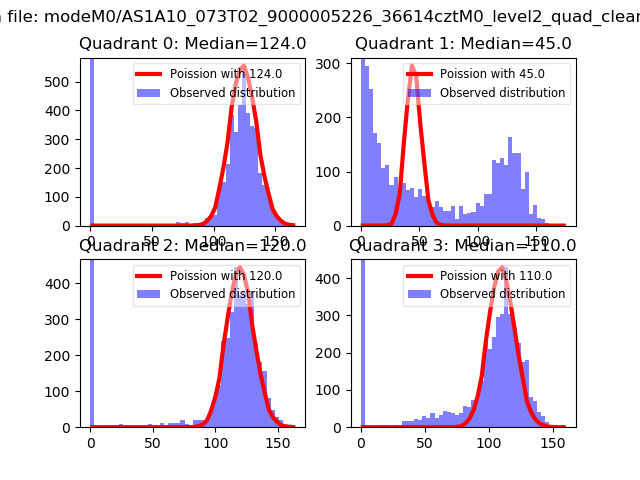 |
 |
| Quadrant-wise count rates Data is divided into 100 sec bins |
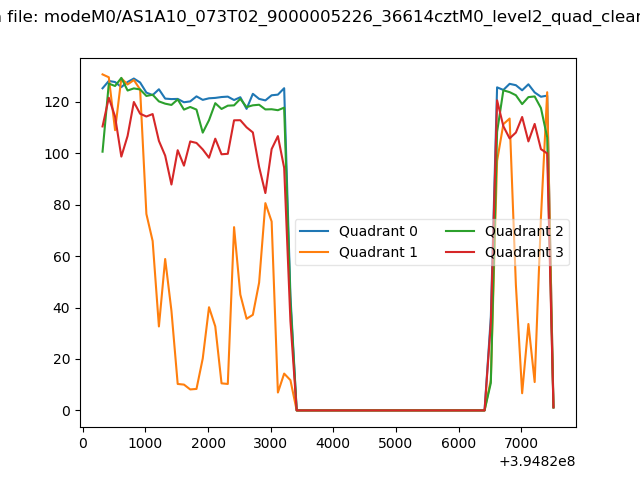 |
|
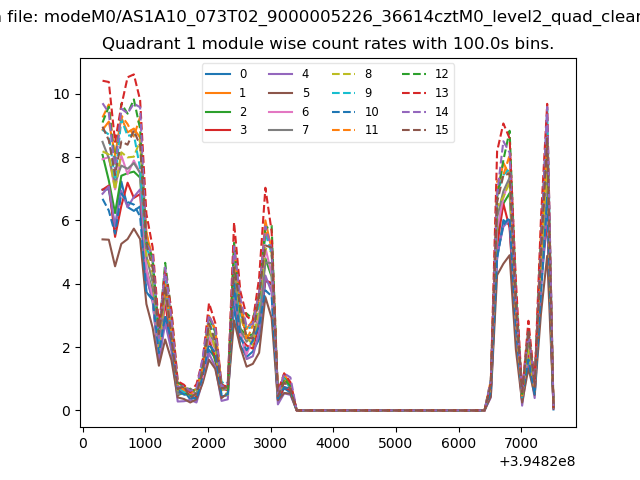
| Module-wise count rates for Quadrant A Data is divided into 100 sec bins |
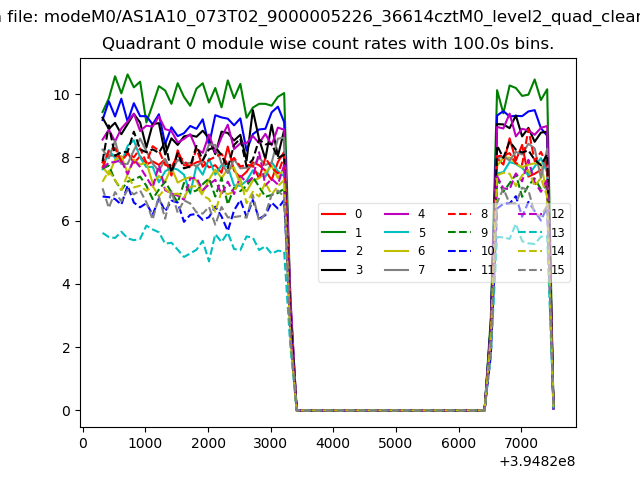 |
 |
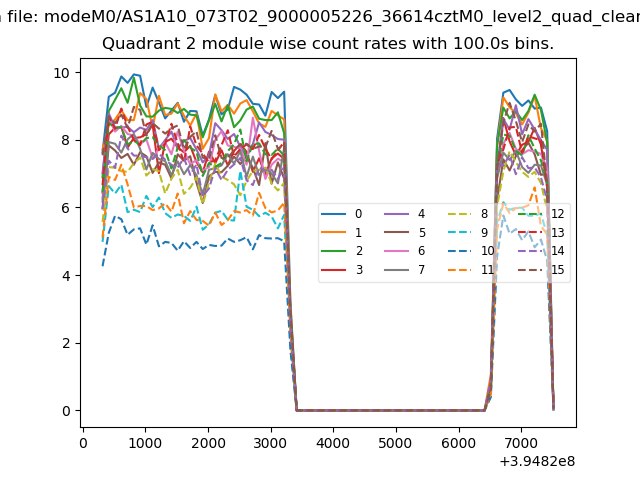
| Module-wise count rates for Quadrant B Data is divided into 100 sec bins |
 |
 |
| Module-wise count rates for Quadrant C Data is divided into 100 sec bins |
 |
 |
| Module-wise count rates for Quadrant D Data is divided into 100 sec bins |
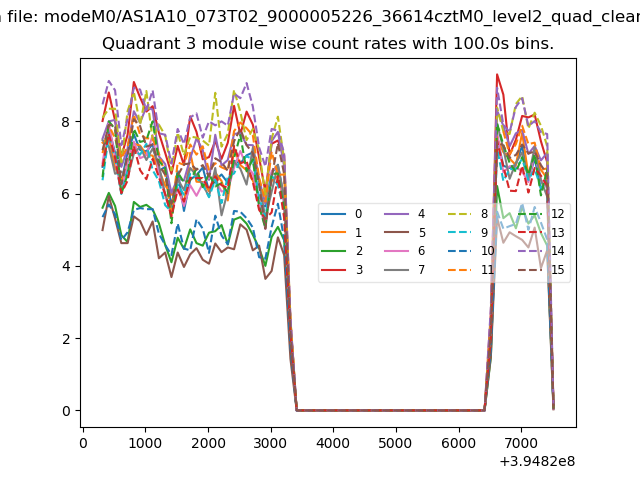 |
 |
| Parameter | Plot |
|---|---|
| CZT HV Monitor | 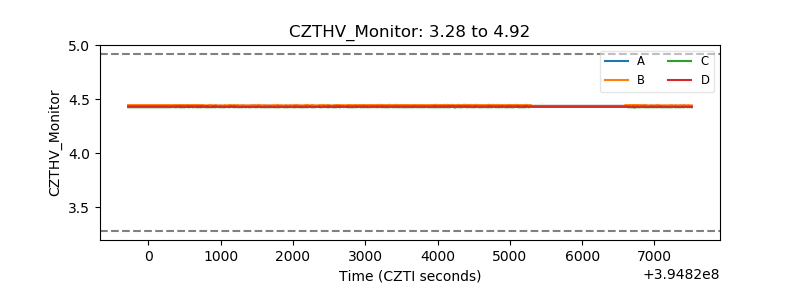 |
| D_VDD | 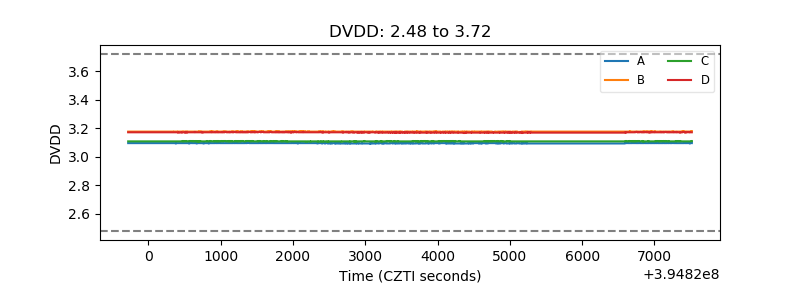 |
| Temperature 1 | 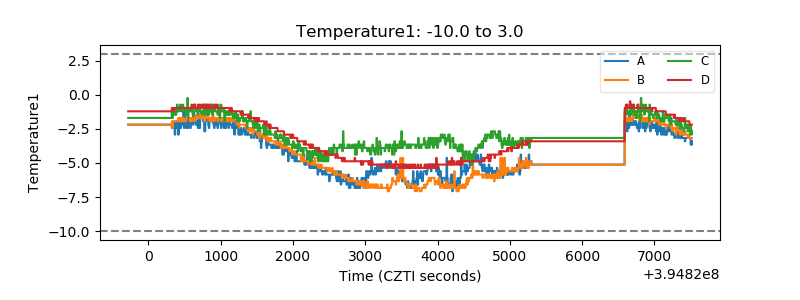 |
| Veto HV Monitor | 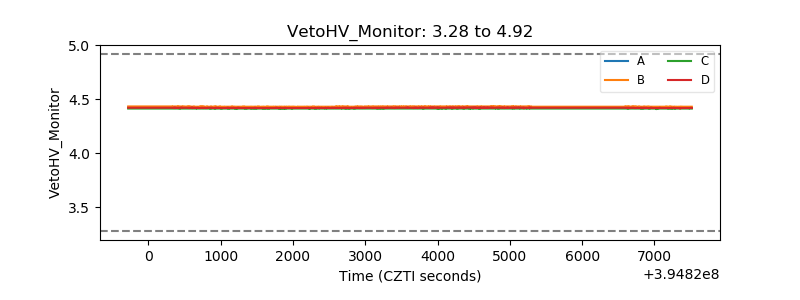 |
| Veto LLD | 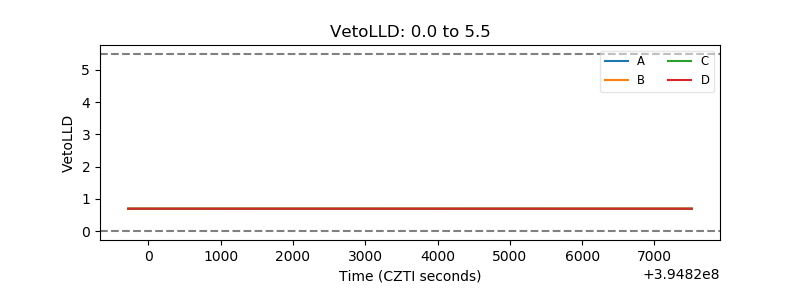 |
| Alpha Counter | 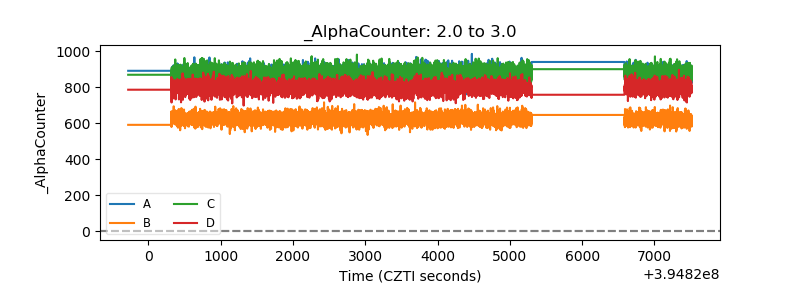 |
| _CPM_Rate | 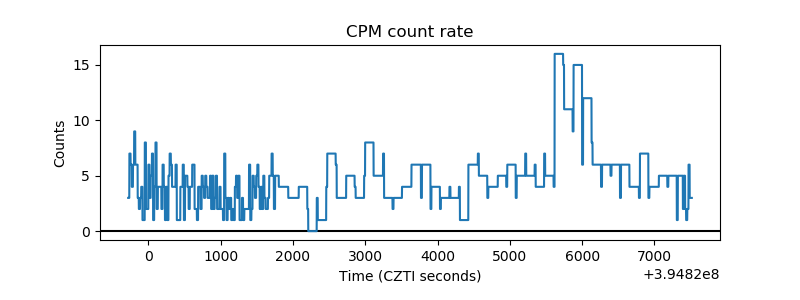 |
| CZT Counter |  |
| +2.5 Volts monitor |  |
| +5 Volts monitor |  |
| _ROLL_ROT | 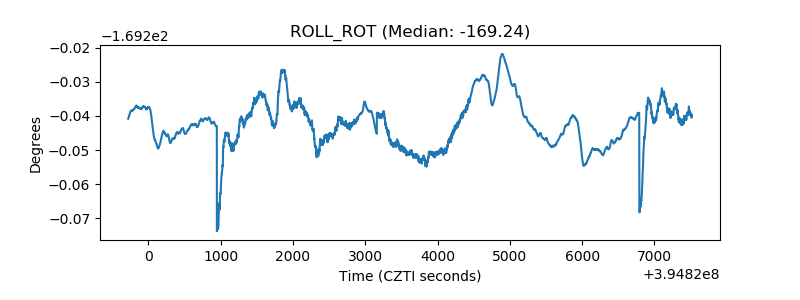 |
| _Roll_DEC | 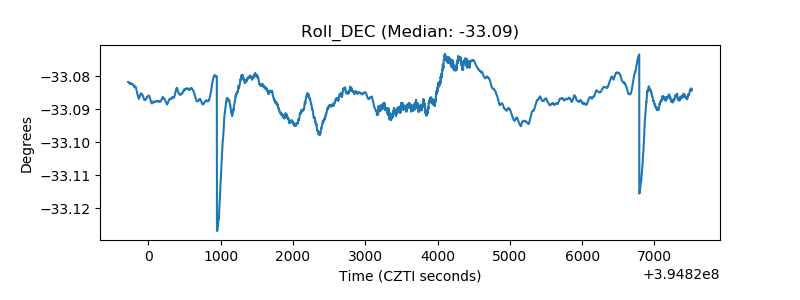 |
| _Roll_RA | 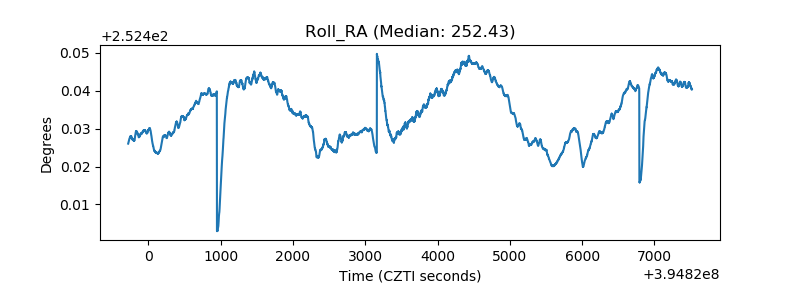 |
| Veto Counter | 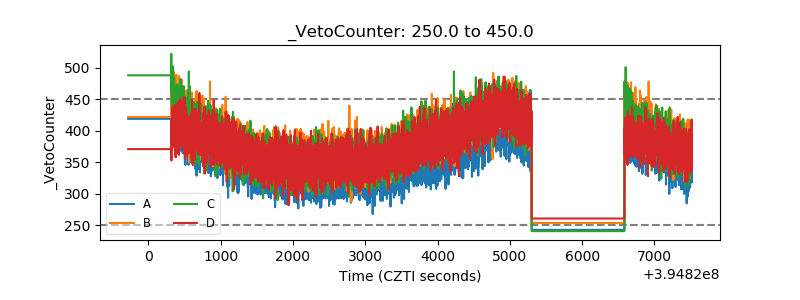 |