| Param | Original file | Final file |
|---|---|---|
| Filename | modeM0/AS1A10_073T02_9000005226_36616cztM0_level2.evt | modeM0/AS1A10_073T02_9000005226_36616cztM0_level2_quad_clean.evt |
| Size (bytes) | 456,275,520 | 51,557,760 |
| Size | 435.1 MB | 49.2 MB |
| Events in quadrant A | 2,858,648 | 330,278 |
| Events in quadrant B | 3,487,453 | 276,562 |
| Events in quadrant C | 2,915,630 | 316,327 |
| Events in quadrant D | 4,224,277 | 293,977 |
| Mode SS | |||
|---|---|---|---|
| Quadrant | BADHDUFLAG | Total packets | Discarded packets |
| A | 0 | 98 | 0 |
| B | 0 | 98 | 0 |
| C | 0 | 98 | 0 |
| D | 0 | 98 | 0 |
| Mode M0 | |||
|---|---|---|---|
| Quadrant | BADHDUFLAG | Total packets | Discarded packets |
| A | 0 | 11680 | 2 |
| B | 0 | 13477 | 1 |
| C | 0 | 11852 | 1 |
| D | 0 | 15889 | 1 |
| Mode M9 | |||
|---|---|---|---|
| Quadrant | BADHDUFLAG | Total packets | Discarded packets |
| A | 0 | 4 | 0 |
| B | 0 | 4 | 0 |
| C | 0 | 4 | 0 |
| D | 0 | 5 | 0 |
| Quadrant | Total seconds | Saturated seconds | Saturation percentage |
|---|---|---|---|
| A | 4892 | 142 | 2.902698% |
| B | 4892 | 535 | 10.936222% |
| C | 4892 | 109 | 2.228128% |
| D | 4892 | 345 | 7.052330% |
Noise dominated data is calculated using 1-second bins in cleaned event files. If a bin has >2000 counts, and if more than 50% of those come from <1% of pixels, then it is considered to be noise-dominated and hence unusable.
| Quadrant | # 1 sec bins | Bins with >0 counts | Bins with >2000 counts | High rate bins dominated by noise | Noise dominated (total time) | Noise dominated (detector-on time) | Marked lightcurve |
|---|---|---|---|---|---|---|---|
| A | 4892 | 4892 | 62 | 62 | 1.27% | 1.27% | 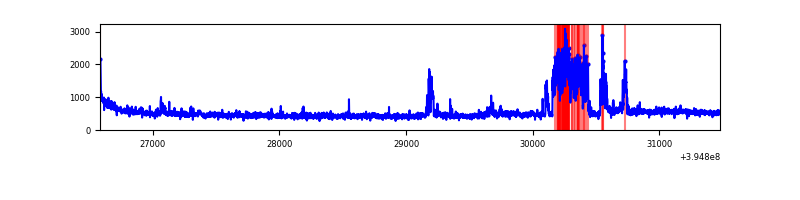 |
| B | 4892 | 4892 | 462 | 462 | 9.44% | 9.44% | 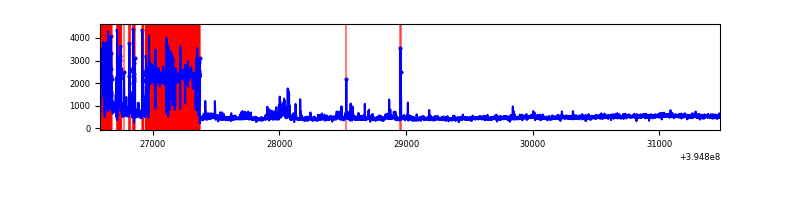 |
| C | 4892 | 4892 | 92 | 92 | 1.88% | 1.88% | 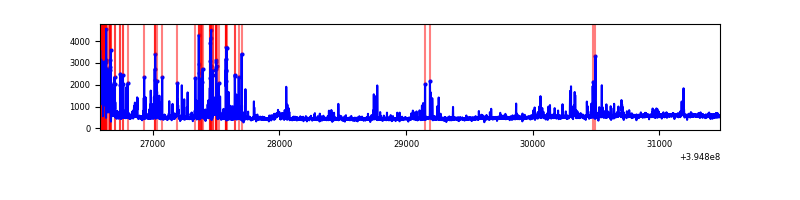 |
| D | 4892 | 4892 | 325 | 325 | 6.64% | 6.64% | 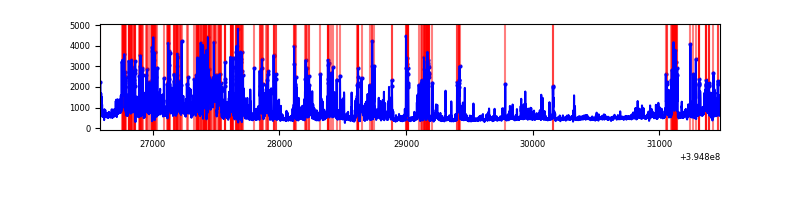 |
Top three noisy pixels from each quadrant. If the there are fewer than three noisy pixels in the level2.evt file, extra rows are filled as -1
| Pixel properties | Quadrant properties | ||||||
|---|---|---|---|---|---|---|---|
| Quadrant | DetID | PixID | Counts | Sigma | Mean | Median | Sigma |
| A | 15 | 223 | 539726 | 4747.36 | 559 | 549 | 113.6 |
| A | 10 | 83 | 147649 | 1295.19 | 559 | 549 | 113.6 |
| A | 10 | 255 | 7376 | 60.11 | 559 | 549 | 113.6 |
| B | 4 | 171 | 1216781 | 12184.81 | 513 | 500 | 99.8 |
| B | 0 | 213 | 110121 | 1098.19 | 513 | 500 | 99.8 |
| B | 0 | 219 | 45347 | 449.28 | 513 | 500 | 99.8 |
| C | 0 | 10 | 445596 | 3487.72 | 539 | 542 | 127.6 |
| C | 15 | 214 | 202261 | 1580.8 | 539 | 542 | 127.6 |
| C | 14 | 254 | 160211 | 1251.27 | 539 | 542 | 127.6 |
| D | 12 | 235 | 1730772 | 13235.4 | 532 | 516 | 130.7 |
| D | 2 | 153 | 103371 | 786.78 | 532 | 516 | 130.7 |
| D | 13 | 171 | 76979 | 584.9 | 532 | 516 | 130.7 |
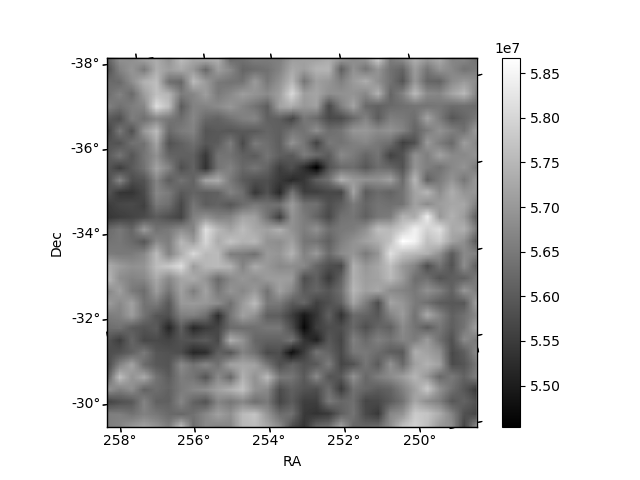
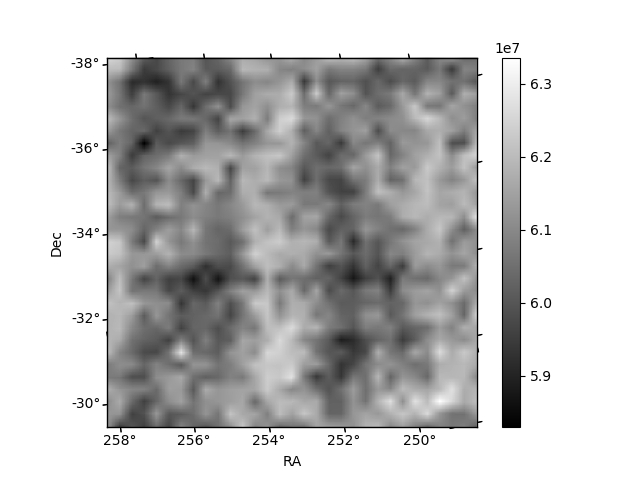
Histogram calculated using DETX and DETY for each event in the final _common_clean file
| Quadrant A |  |
 |
Quadrant B |
|---|---|---|---|
| Quadrant D |  |
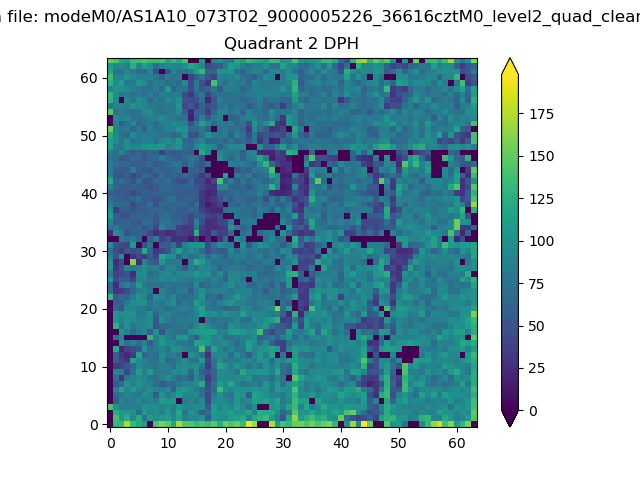 |
Quadrant C |
| Plot type | Count rate plots | Images |
|---|---|---|
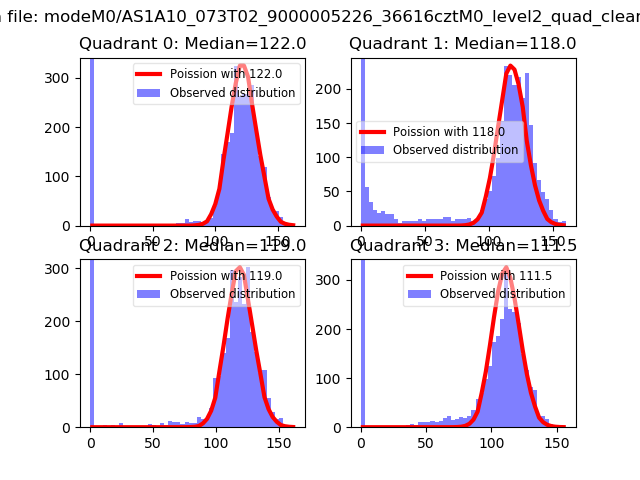
| Comparison with Poisson distribution Blue bars denote a histogram of data divided into 1 sec bins. Red curve is a Poisson curve with rate = median count rate of data. |
 |
 |
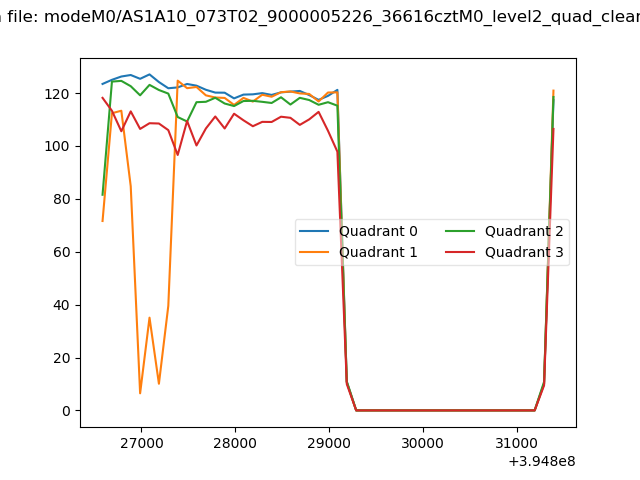
| Quadrant-wise count rates Data is divided into 100 sec bins |
 |
|
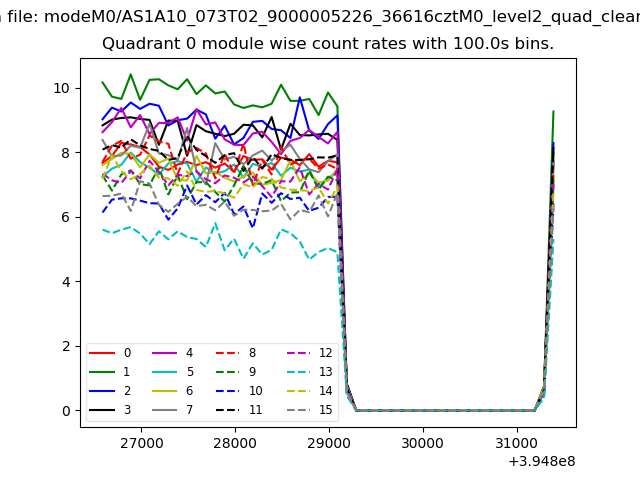
| Module-wise count rates for Quadrant A Data is divided into 100 sec bins |
 |
 |
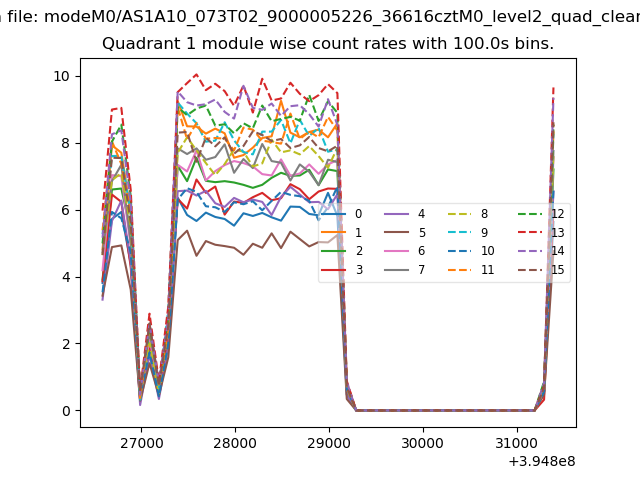
| Module-wise count rates for Quadrant B Data is divided into 100 sec bins |
 |
 |
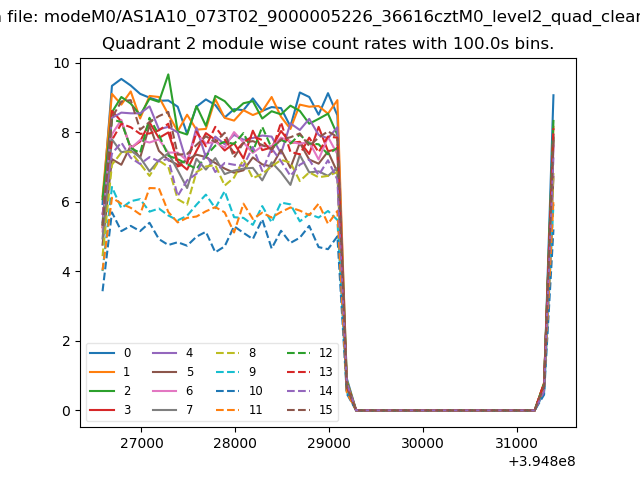
| Module-wise count rates for Quadrant C Data is divided into 100 sec bins |
 |
 |
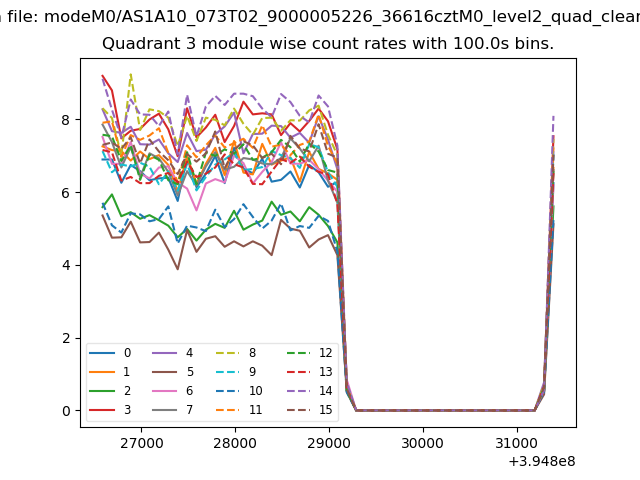
| Module-wise count rates for Quadrant D Data is divided into 100 sec bins |
 |
 |
| Parameter | Plot |
|---|---|
| CZT HV Monitor | 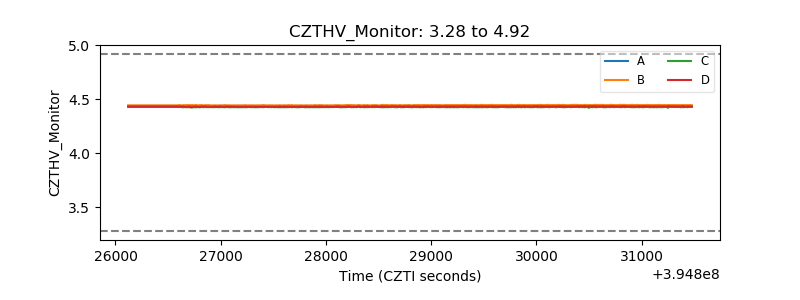 |
| D_VDD | 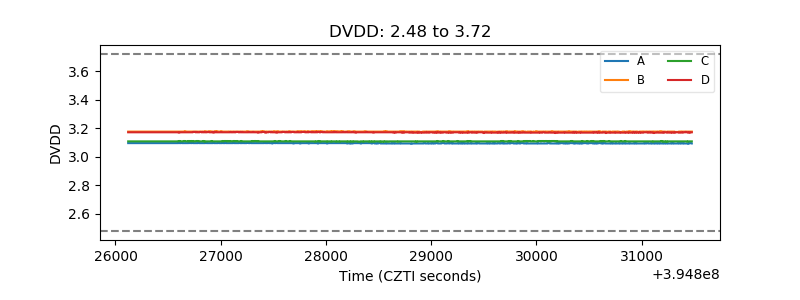 |
| Temperature 1 | 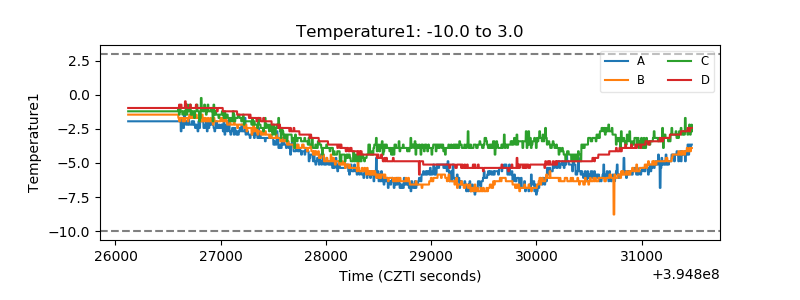 |
| Veto HV Monitor | 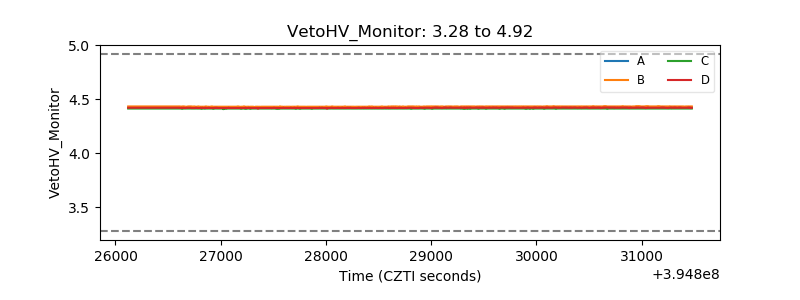 |
| Veto LLD | 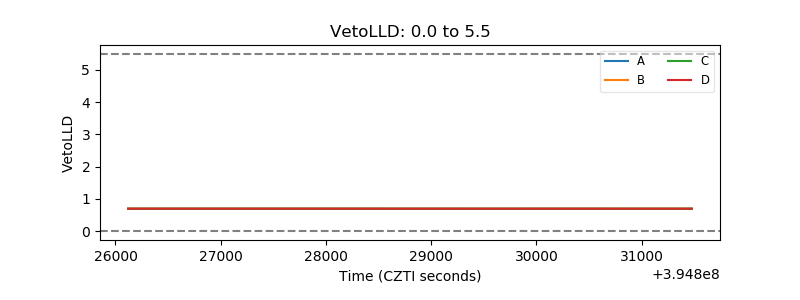 |
| Alpha Counter | 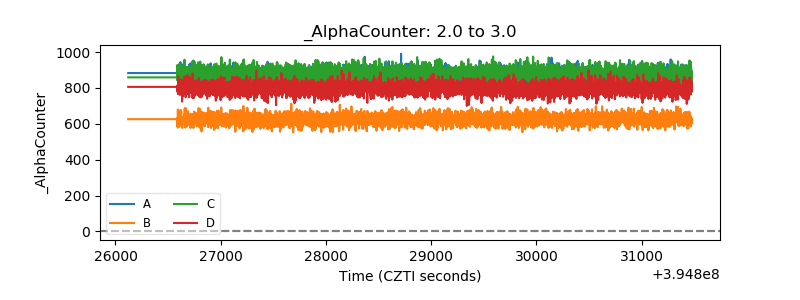 |
| _CPM_Rate | 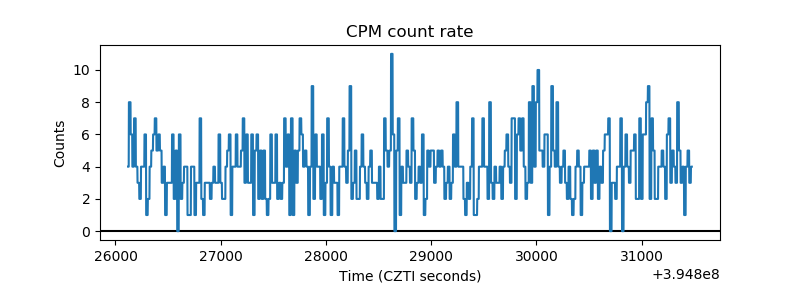 |
| CZT Counter |  |
| +2.5 Volts monitor |  |
| +5 Volts monitor | 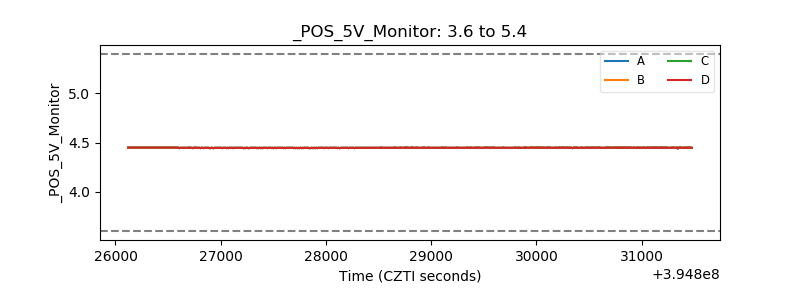 |
| _ROLL_ROT | 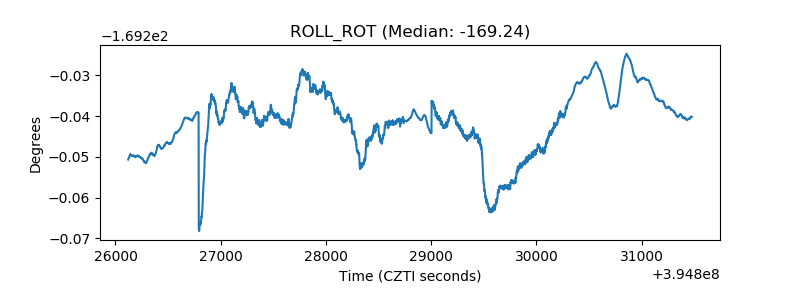 |
| _Roll_DEC | 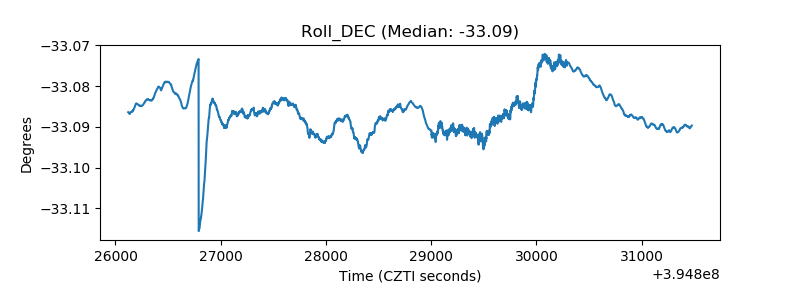 |
| _Roll_RA | 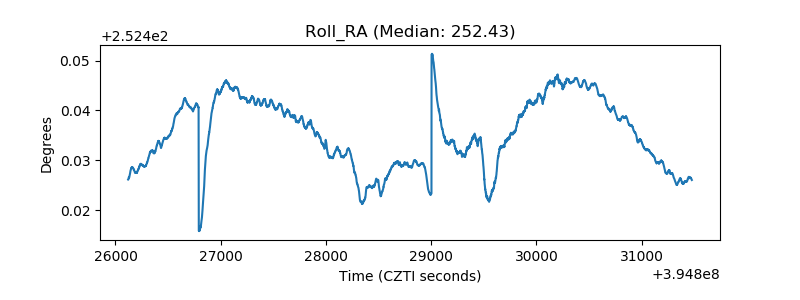 |
| Veto Counter | 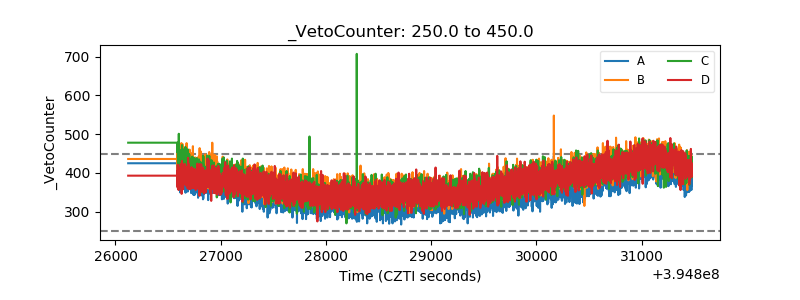 |