| Param | Original file | Final file |
|---|---|---|
| Filename | modeM0/AS1A10_073T02_9000005226_36617cztM0_level2.evt | modeM0/AS1A10_073T02_9000005226_36617cztM0_level2_quad_clean.evt |
| Size (bytes) | 953,467,200 | 125,516,160 |
| Size | 909.3 MB | 119.7 MB |
| Events in quadrant A | 5,370,022 | 793,294 |
| Events in quadrant B | 6,316,520 | 783,409 |
| Events in quadrant C | 6,057,117 | 772,606 |
| Events in quadrant D | 10,403,218 | 703,577 |
| Mode SS | |||
|---|---|---|---|
| Quadrant | BADHDUFLAG | Total packets | Discarded packets |
| A | 0 | 222 | 0 |
| B | 0 | 222 | 0 |
| C | 0 | 222 | 0 |
| D | 0 | 222 | 0 |
| Mode M0 | |||
|---|---|---|---|
| Quadrant | BADHDUFLAG | Total packets | Discarded packets |
| A | 0 | 22879 | 4 |
| B | 0 | 25609 | 3 |
| C | 0 | 24762 | 3 |
| D | 0 | 38384 | 3 |
| Mode M9 | |||
|---|---|---|---|
| Quadrant | BADHDUFLAG | Total packets | Discarded packets |
| A | 0 | 42 | 0 |
| B | 0 | 42 | 0 |
| C | 0 | 42 | 0 |
| D | 0 | 42 | 0 |
| Quadrant | Total seconds | Saturated seconds | Saturation percentage |
|---|---|---|---|
| A | 10802 | 30 | 0.277726% |
| B | 10802 | 266 | 2.462507% |
| C | 10802 | 164 | 1.518237% |
| D | 10802 | 873 | 8.081837% |
Noise dominated data is calculated using 1-second bins in cleaned event files. If a bin has >2000 counts, and if more than 50% of those come from <1% of pixels, then it is considered to be noise-dominated and hence unusable.
| Quadrant | # 1 sec bins | Bins with >0 counts | Bins with >2000 counts | High rate bins dominated by noise | Noise dominated (total time) | Noise dominated (detector-on time) | Marked lightcurve |
|---|---|---|---|---|---|---|---|
| A | 15043 | 10805 | 7 | 7 | 0.05% | 0.06% | 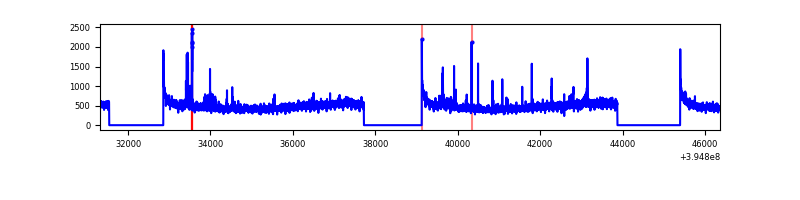 |
| B | 15043 | 10805 | 173 | 173 | 1.15% | 1.60% | 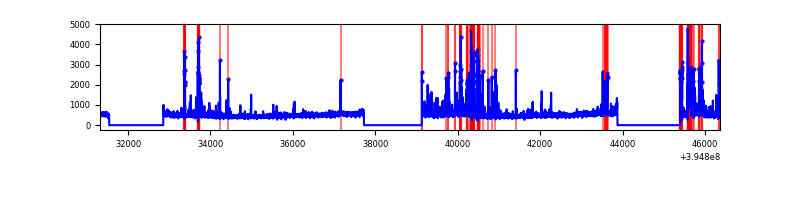 |
| C | 15043 | 10805 | 127 | 127 | 0.84% | 1.18% | 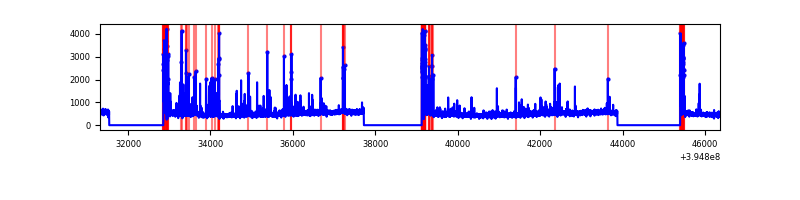 |
| D | 15043 | 10805 | 739 | 739 | 4.91% | 6.84% |  |
Top three noisy pixels from each quadrant. If the there are fewer than three noisy pixels in the level2.evt file, extra rows are filled as -1
| Pixel properties | Quadrant properties | ||||||
|---|---|---|---|---|---|---|---|
| Quadrant | DetID | PixID | Counts | Sigma | Mean | Median | Sigma |
| A | 10 | 83 | 363134 | 1449.02 | 1242 | 1219 | 249.8 |
| A | 15 | 223 | 164179 | 652.45 | 1242 | 1219 | 249.8 |
| A | 13 | 6 | 26669 | 101.9 | 1242 | 1219 | 249.8 |
| B | 5 | 200 | 853280 | 3604.25 | 1228 | 1196 | 236.4 |
| B | 5 | 255 | 235162 | 989.66 | 1228 | 1196 | 236.4 |
| B | 0 | 219 | 89438 | 373.26 | 1228 | 1196 | 236.4 |
| C | 0 | 10 | 713343 | 2548.72 | 1201 | 1209 | 279.4 |
| C | 15 | 214 | 454643 | 1622.83 | 1201 | 1209 | 279.4 |
| C | 14 | 254 | 90143 | 318.29 | 1201 | 1209 | 279.4 |
| D | 12 | 235 | 4662111 | 16217.28 | 1172 | 1139 | 287.4 |
| D | 13 | 171 | 205127 | 709.75 | 1172 | 1139 | 287.4 |
| D | 13 | 249 | 197556 | 683.41 | 1172 | 1139 | 287.4 |
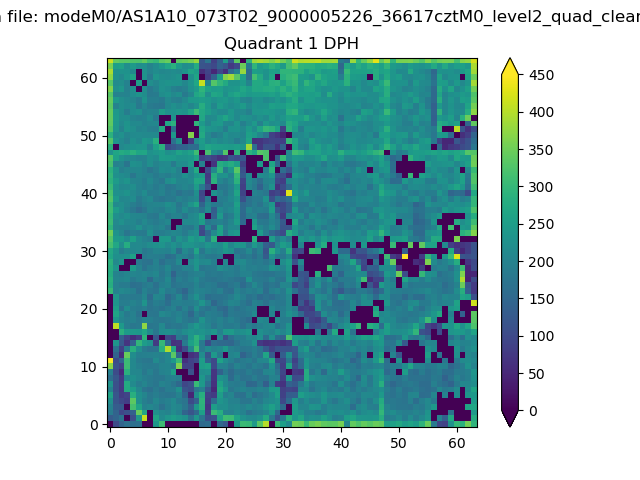
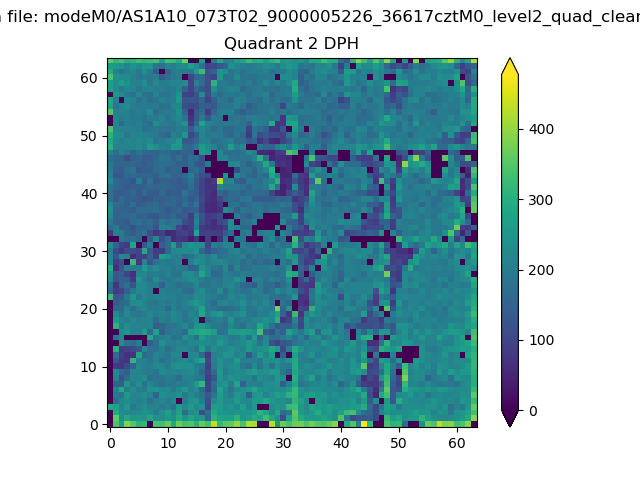
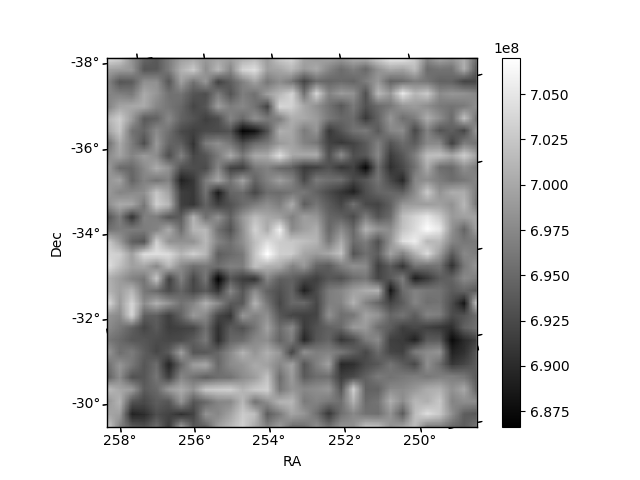
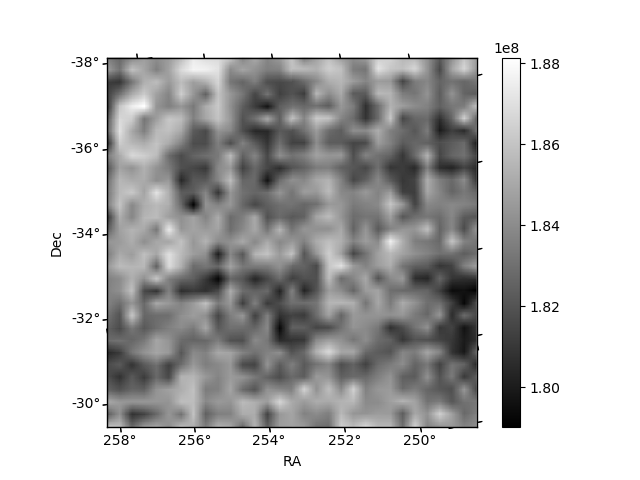
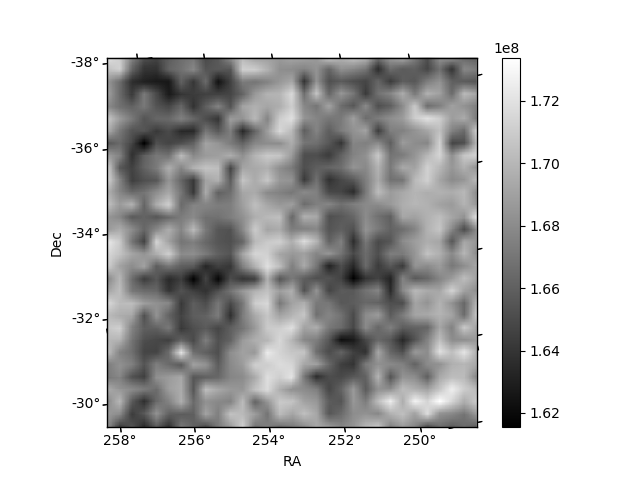
Histogram calculated using DETX and DETY for each event in the final _common_clean file
| Quadrant A | 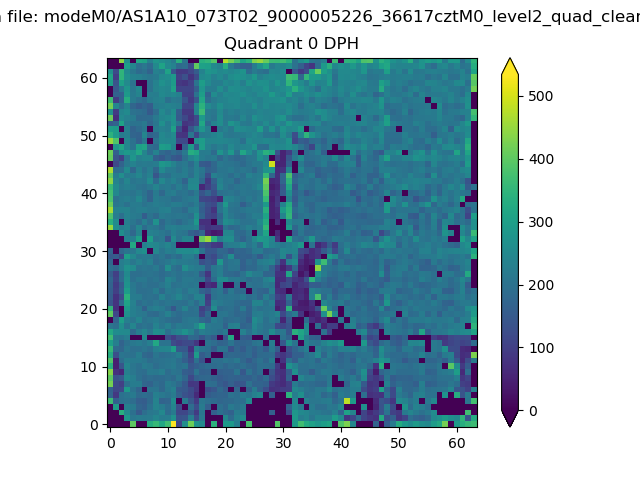 |
 |
Quadrant B |
|---|---|---|---|
| Quadrant D | 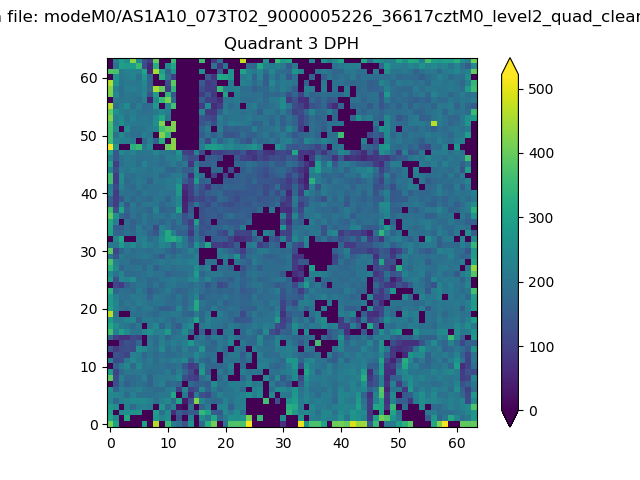 |
 |
Quadrant C |
| Plot type | Count rate plots | Images |
|---|---|---|
| Comparison with Poisson distribution Blue bars denote a histogram of data divided into 1 sec bins. Red curve is a Poisson curve with rate = median count rate of data. |
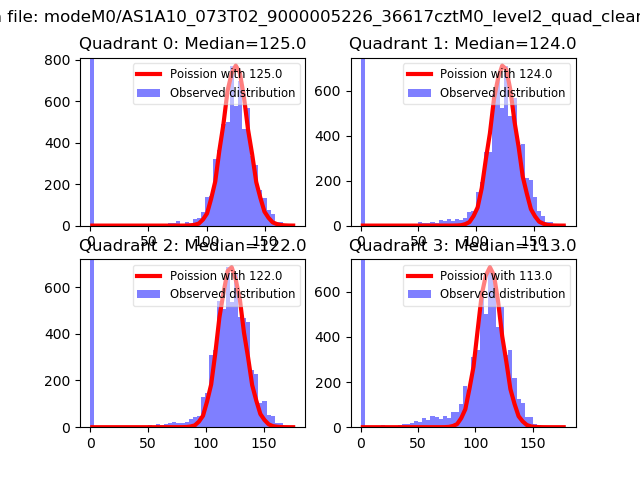 |
 |
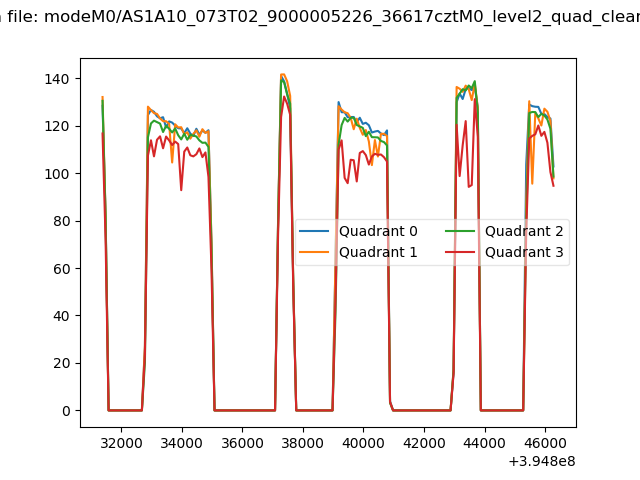
| Quadrant-wise count rates Data is divided into 100 sec bins |
 |
|
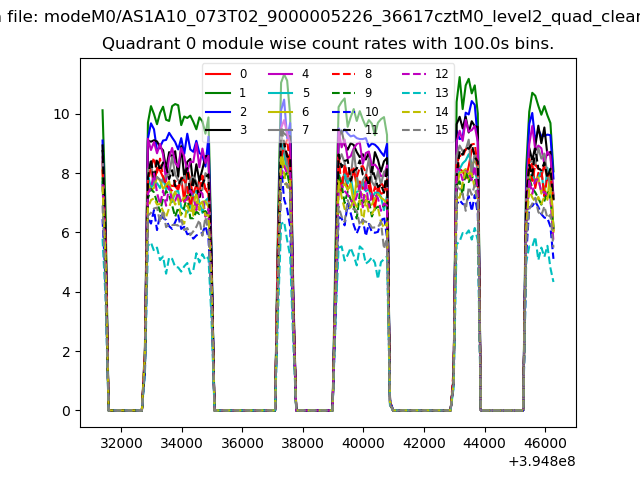
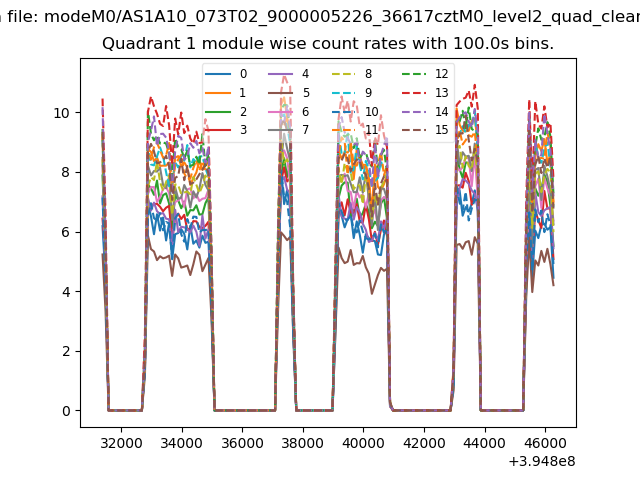
| Module-wise count rates for Quadrant A Data is divided into 100 sec bins |
 |
 |
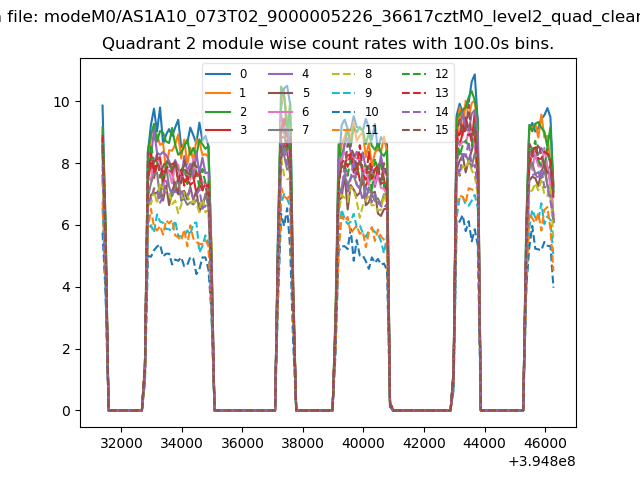
| Module-wise count rates for Quadrant B Data is divided into 100 sec bins |
 |
 |
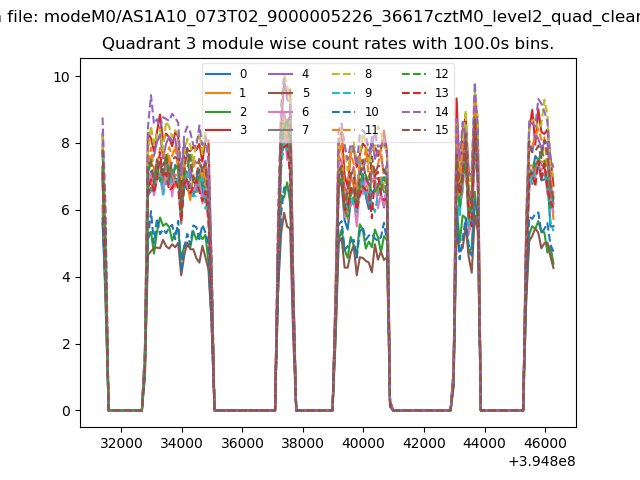
| Module-wise count rates for Quadrant C Data is divided into 100 sec bins |
 |
 |
| Module-wise count rates for Quadrant D Data is divided into 100 sec bins |
 |
 |
| Parameter | Plot |
|---|---|
| CZT HV Monitor | 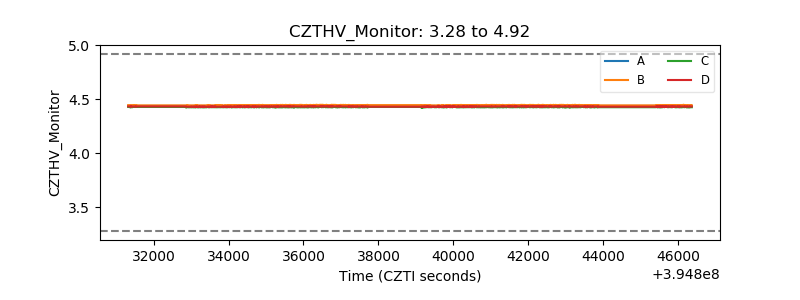 |
| D_VDD | 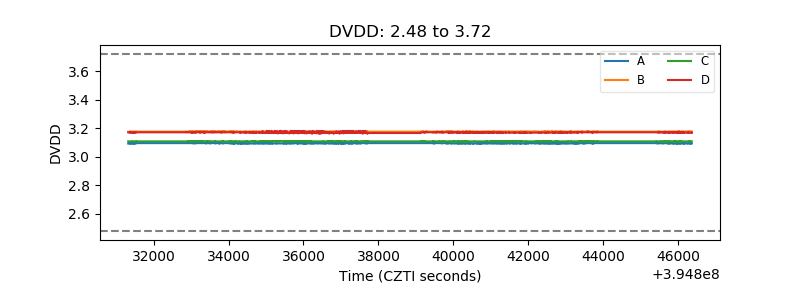 |
| Temperature 1 |  |
| Veto HV Monitor | 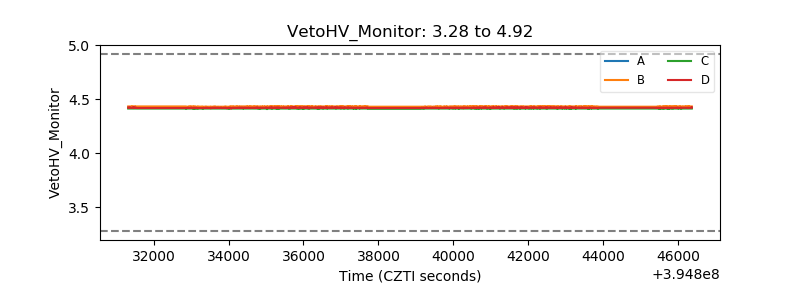 |
| Veto LLD | 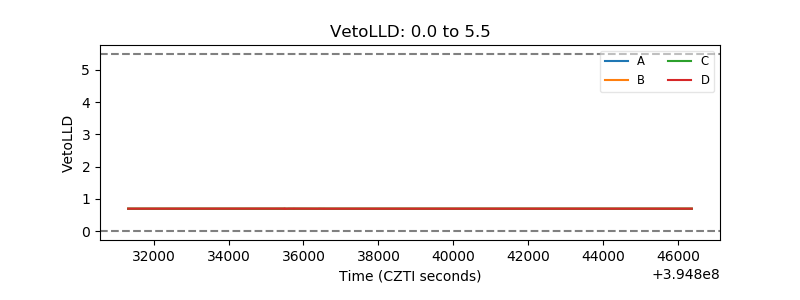 |
| Alpha Counter | 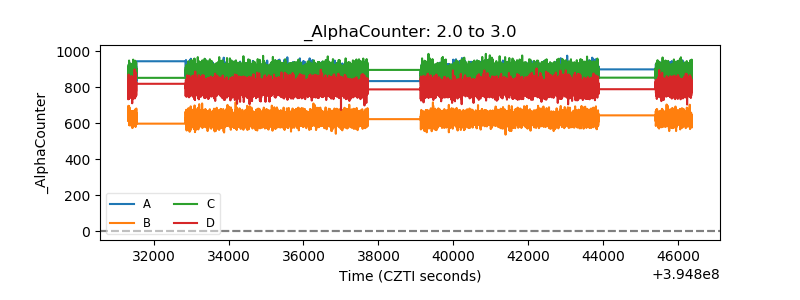 |
| _CPM_Rate | 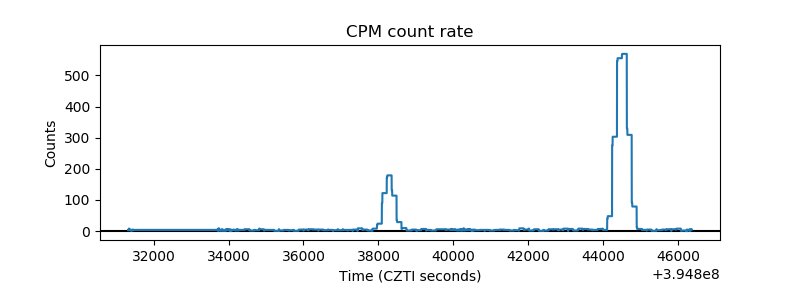 |
| CZT Counter |  |
| +2.5 Volts monitor |  |
| +5 Volts monitor |  |
| _ROLL_ROT | 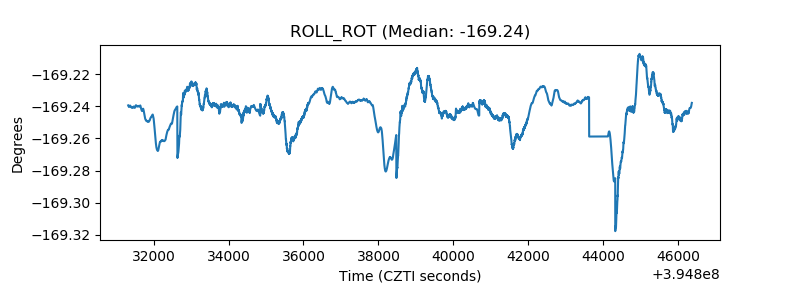 |
| _Roll_DEC | 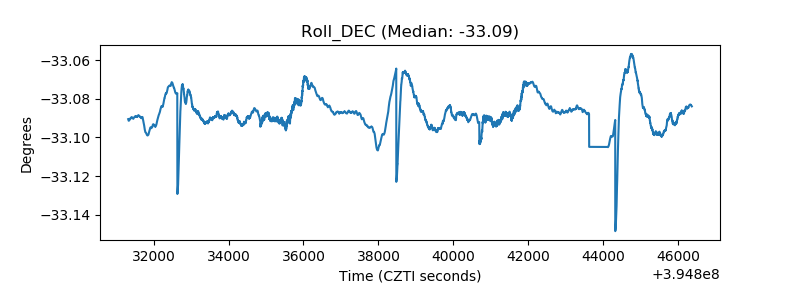 |
| _Roll_RA | 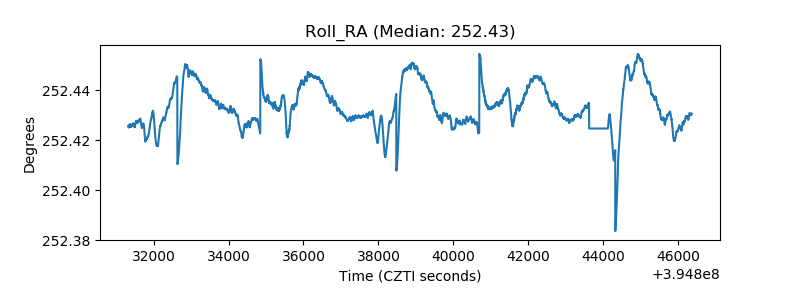 |
| Veto Counter | 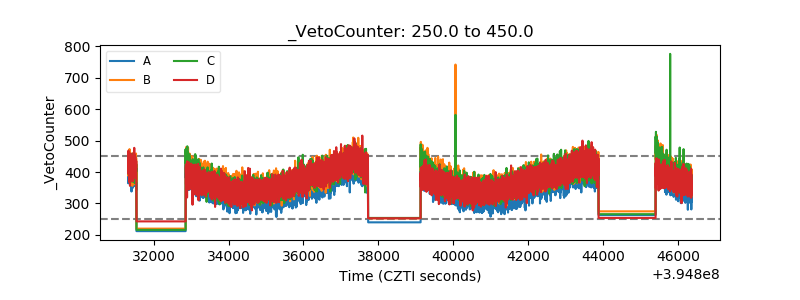 |