| Param | Original file | Final file |
|---|---|---|
| Filename | modeM0/AS1A10_073T02_9000005226_36618cztM0_level2.evt | modeM0/AS1A10_073T02_9000005226_36618cztM0_level2_quad_clean.evt |
| Size (bytes) | 535,213,440 | 67,014,720 |
| Size | 510.4 MB | 63.9 MB |
| Events in quadrant A | 2,705,073 | 429,110 |
| Events in quadrant B | 3,914,157 | 424,654 |
| Events in quadrant C | 3,148,713 | 414,934 |
| Events in quadrant D | 6,068,436 | 375,229 |
| Mode SS | |||
|---|---|---|---|
| Quadrant | BADHDUFLAG | Total packets | Discarded packets |
| A | 0 | 114 | 0 |
| B | 0 | 114 | 0 |
| C | 0 | 114 | 0 |
| D | 0 | 114 | 0 |
| Mode M0 | |||
|---|---|---|---|
| Quadrant | BADHDUFLAG | Total packets | Discarded packets |
| A | 0 | 11502 | 3 |
| B | 0 | 15305 | 2 |
| C | 0 | 12667 | 2 |
| D | 0 | 21884 | 2 |
| Mode M9 | |||
|---|---|---|---|
| Quadrant | BADHDUFLAG | Total packets | Discarded packets |
| A | 0 | 31 | 0 |
| B | 0 | 31 | 0 |
| C | 0 | 31 | 0 |
| D | 0 | 31 | 0 |
| Quadrant | Total seconds | Saturated seconds | Saturation percentage |
|---|---|---|---|
| A | 5502 | 9 | 0.163577% |
| B | 5502 | 238 | 4.325700% |
| C | 5502 | 138 | 2.508179% |
| D | 5502 | 596 | 10.832425% |
Noise dominated data is calculated using 1-second bins in cleaned event files. If a bin has >2000 counts, and if more than 50% of those come from <1% of pixels, then it is considered to be noise-dominated and hence unusable.
| Quadrant | # 1 sec bins | Bins with >0 counts | Bins with >2000 counts | High rate bins dominated by noise | Noise dominated (total time) | Noise dominated (detector-on time) | Marked lightcurve |
|---|---|---|---|---|---|---|---|
| A | 8668 | 5504 | 1 | 1 | 0.01% | 0.02% | 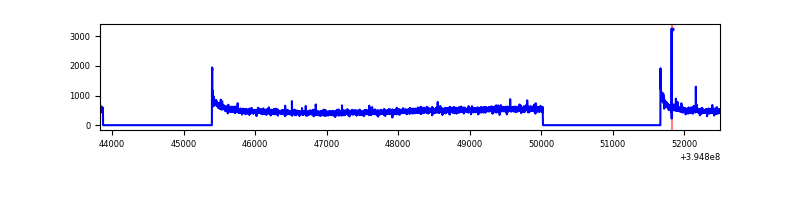 |
| B | 8668 | 5504 | 154 | 154 | 1.78% | 2.80% | 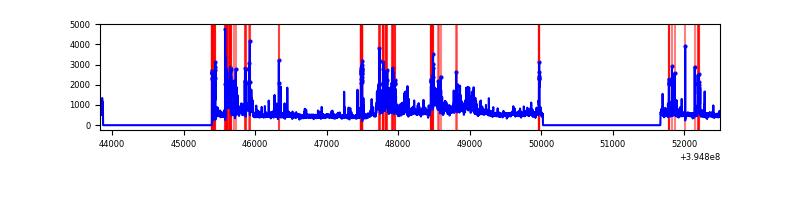 |
| C | 8668 | 5504 | 98 | 98 | 1.13% | 1.78% | 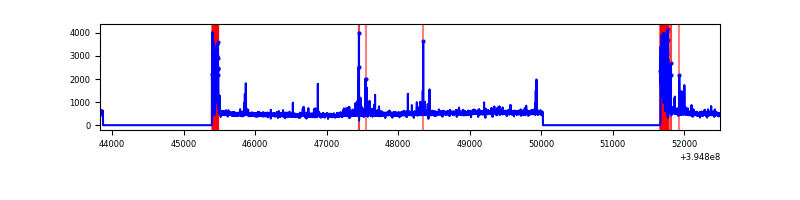 |
| D | 8668 | 5504 | 520 | 520 | 6.00% | 9.45% | 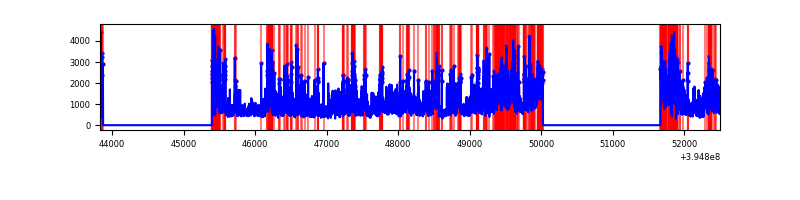 |
Top three noisy pixels from each quadrant. If the there are fewer than three noisy pixels in the level2.evt file, extra rows are filled as -1
| Pixel properties | Quadrant properties | ||||||
|---|---|---|---|---|---|---|---|
| Quadrant | DetID | PixID | Counts | Sigma | Mean | Median | Sigma |
| A | 10 | 83 | 205164 | 1603.0 | 634 | 622 | 127.6 |
| A | 13 | 6 | 21866 | 166.49 | 634 | 622 | 127.6 |
| A | 15 | 223 | 13914 | 104.17 | 634 | 622 | 127.6 |
| B | 5 | 200 | 1166231 | 9727.06 | 625 | 609 | 119.8 |
| B | 5 | 255 | 106523 | 883.85 | 625 | 609 | 119.8 |
| B | 0 | 219 | 44538 | 366.59 | 625 | 609 | 119.8 |
| C | 0 | 10 | 389053 | 2717.49 | 612 | 617 | 142.9 |
| C | 15 | 214 | 233750 | 1630.99 | 612 | 617 | 142.9 |
| C | 12 | 249 | 82982 | 576.22 | 612 | 617 | 142.9 |
| D | 12 | 235 | 3325195 | 22767.89 | 594 | 578 | 146.0 |
| D | 2 | 153 | 126086 | 859.51 | 594 | 578 | 146.0 |
| D | 2 | 249 | 74452 | 505.91 | 594 | 578 | 146.0 |
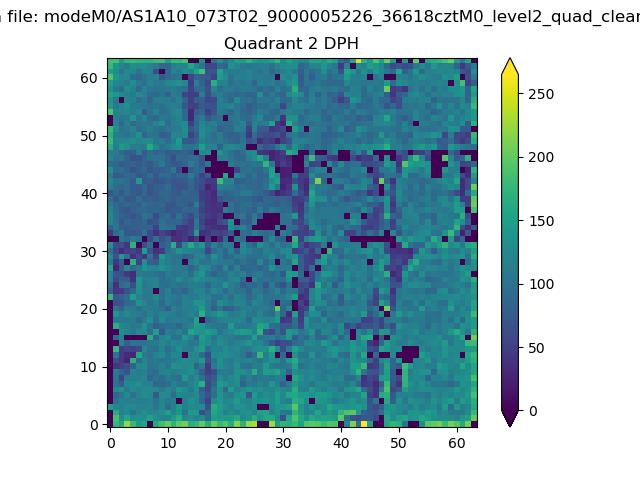
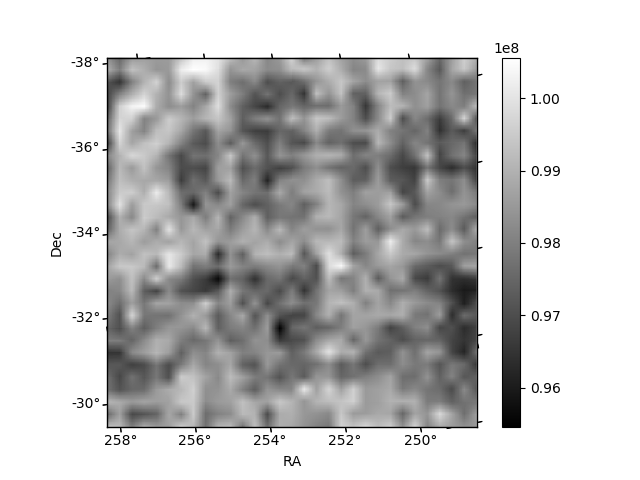
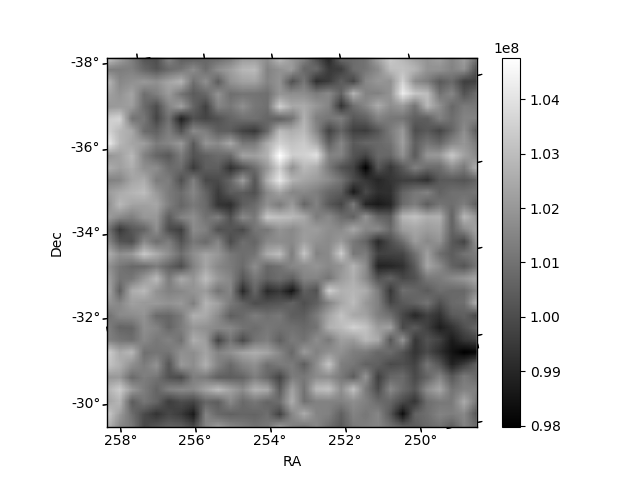
Histogram calculated using DETX and DETY for each event in the final _common_clean file
| Quadrant A |  |
 |
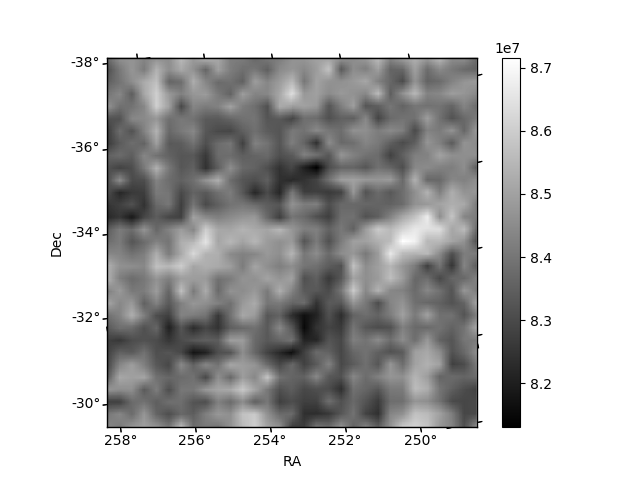
Quadrant B |
|---|---|---|---|
| Quadrant D |  |
 |
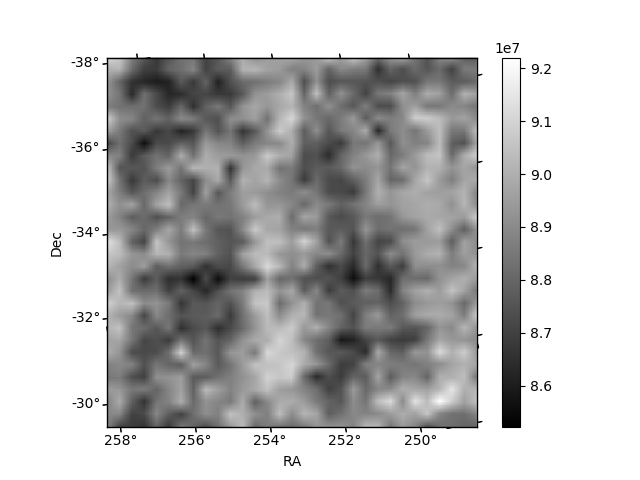
Quadrant C |
| Plot type | Count rate plots | Images |
|---|---|---|
| Comparison with Poisson distribution Blue bars denote a histogram of data divided into 1 sec bins. Red curve is a Poisson curve with rate = median count rate of data. |
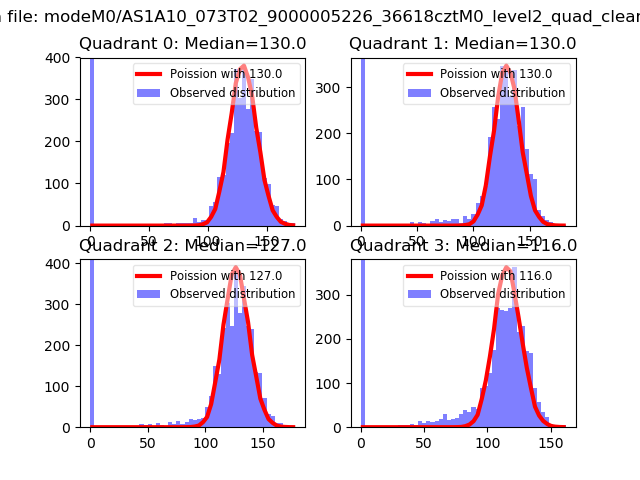 |
 |
| Quadrant-wise count rates Data is divided into 100 sec bins |
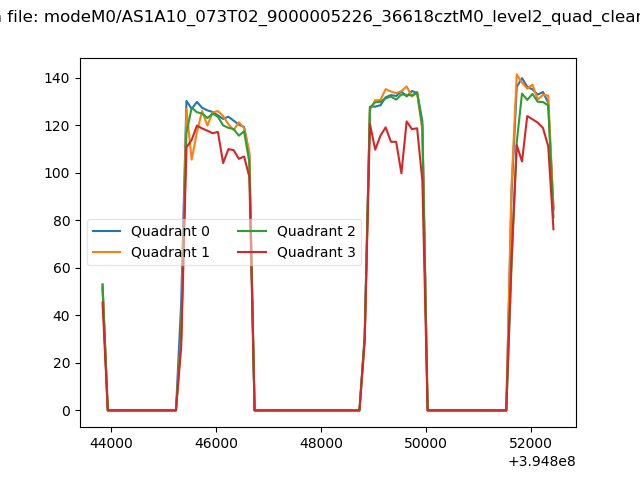 |
|
| Module-wise count rates for Quadrant A Data is divided into 100 sec bins |
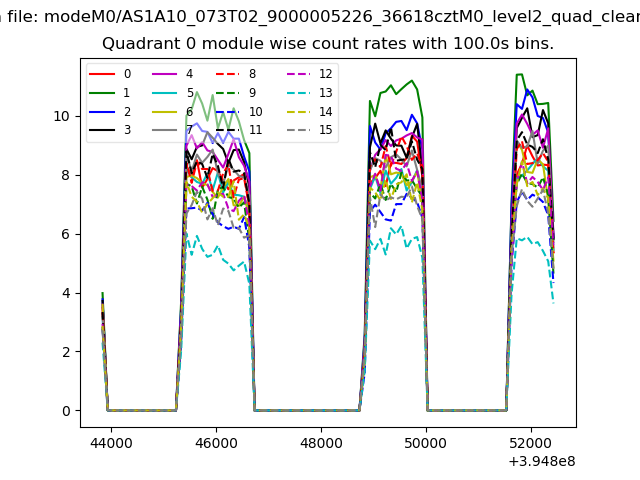 |
 |
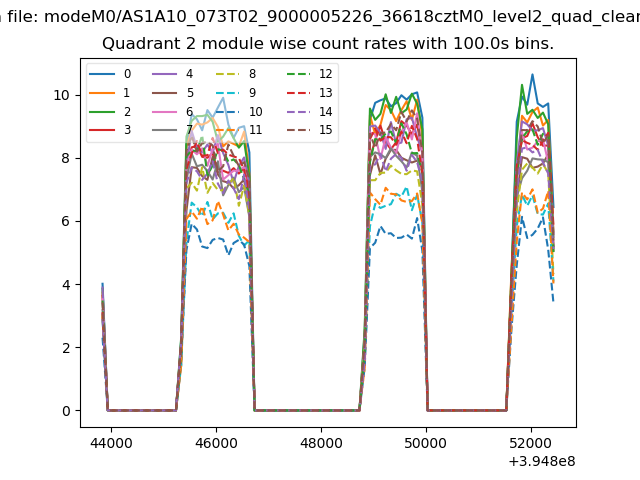
| Module-wise count rates for Quadrant B Data is divided into 100 sec bins |
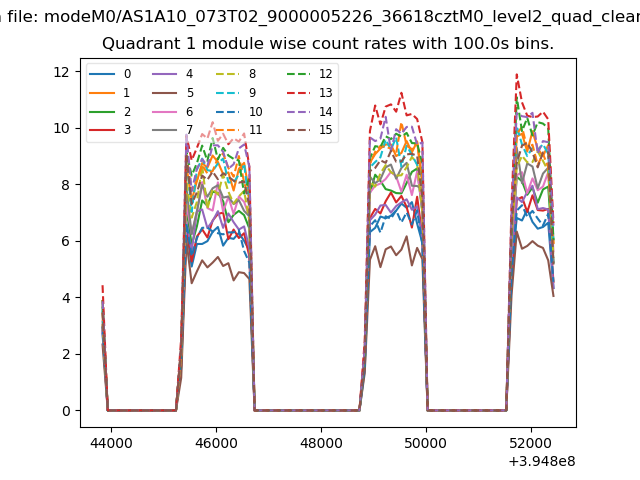 |
 |
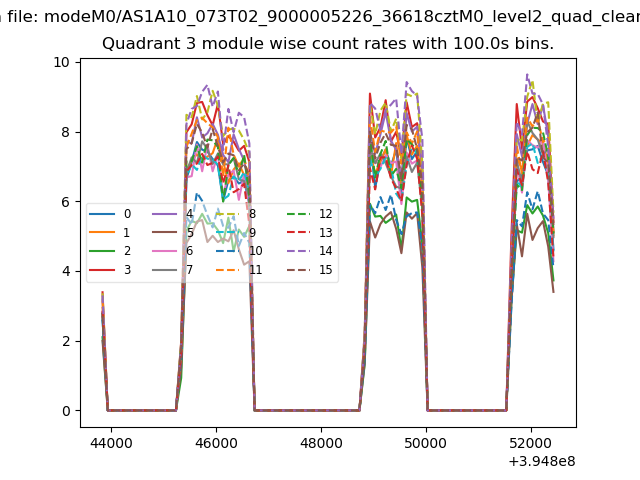
| Module-wise count rates for Quadrant C Data is divided into 100 sec bins |
 |
 |
| Module-wise count rates for Quadrant D Data is divided into 100 sec bins |
 |
 |
| Parameter | Plot |
|---|---|
| CZT HV Monitor |  |
| D_VDD | 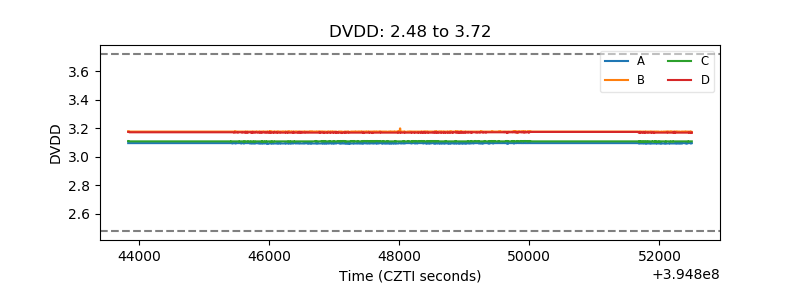 |
| Temperature 1 | 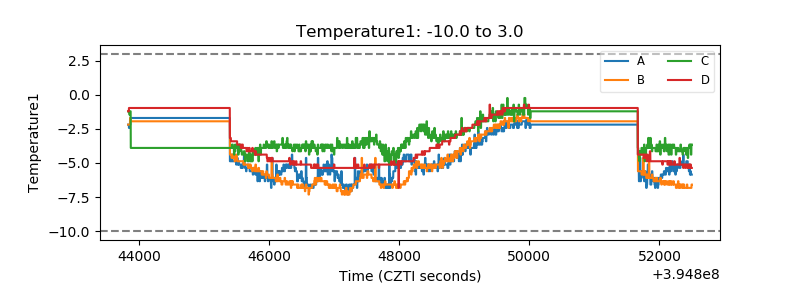 |
| Veto HV Monitor | 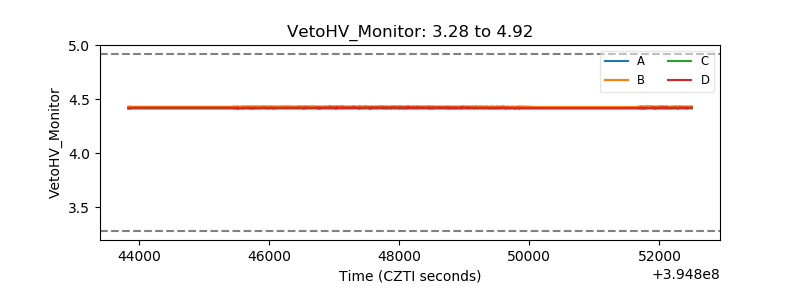 |
| Veto LLD | 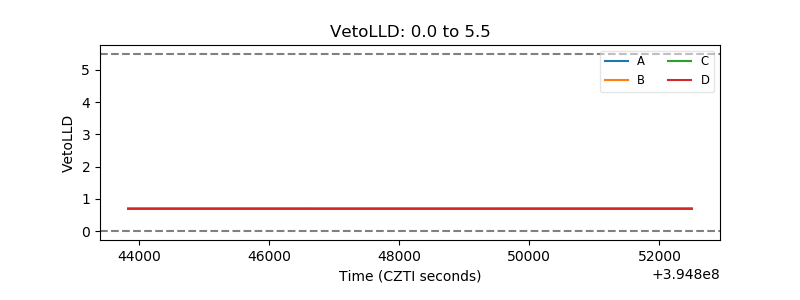 |
| Alpha Counter | 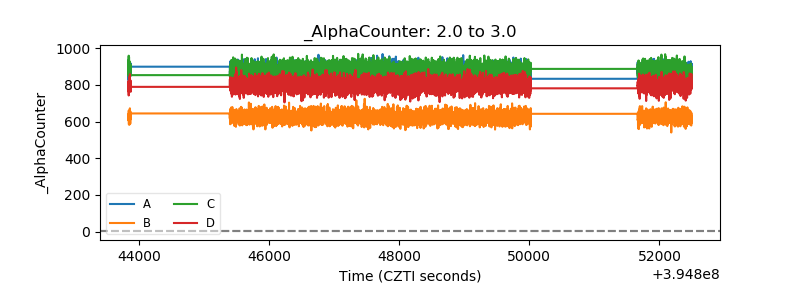 |
| _CPM_Rate | 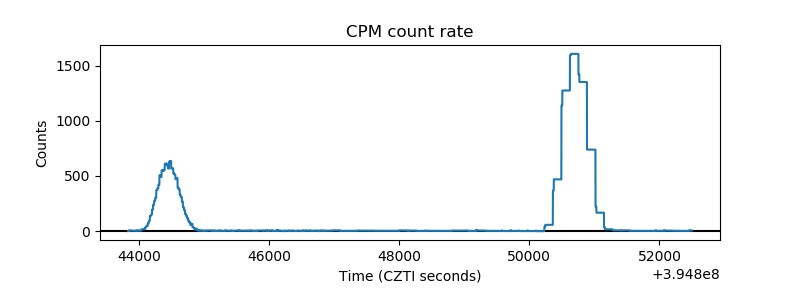 |
| CZT Counter | 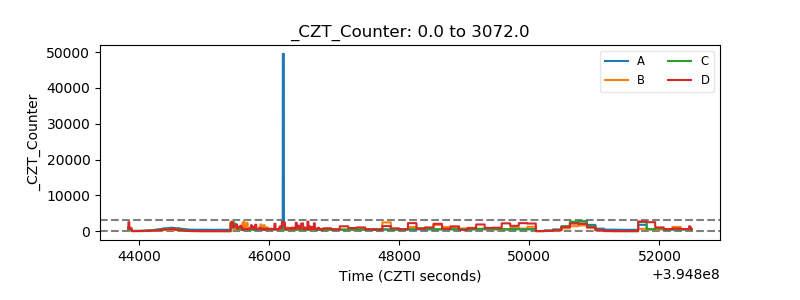 |
| +2.5 Volts monitor |  |
| +5 Volts monitor | 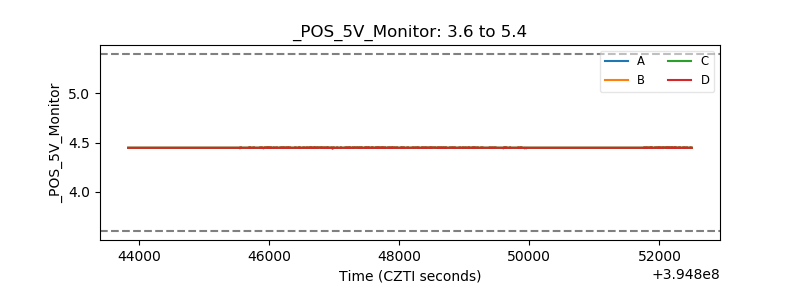 |
| _ROLL_ROT | 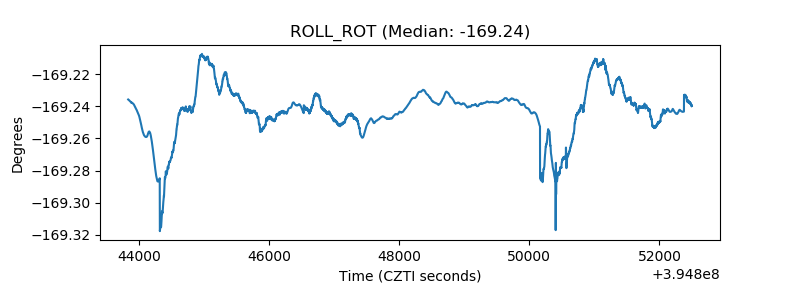 |
| _Roll_DEC | 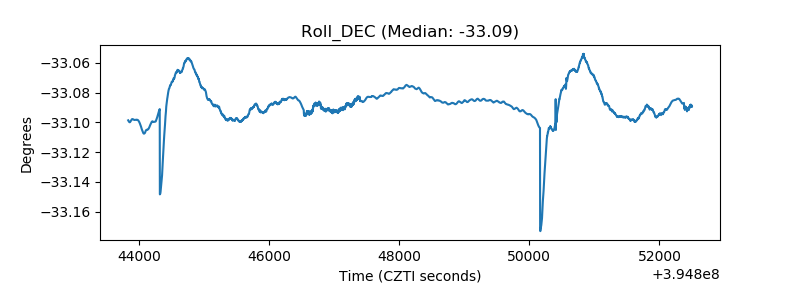 |
| _Roll_RA | 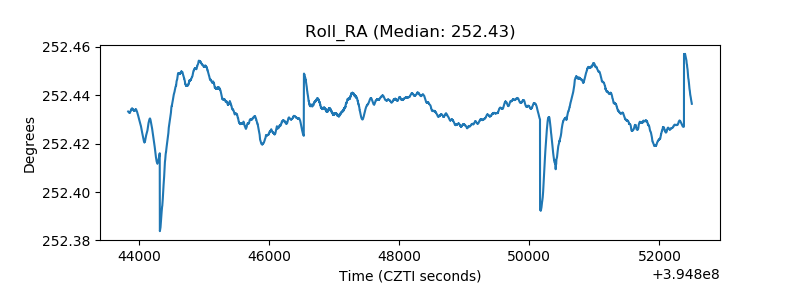 |
| Veto Counter | 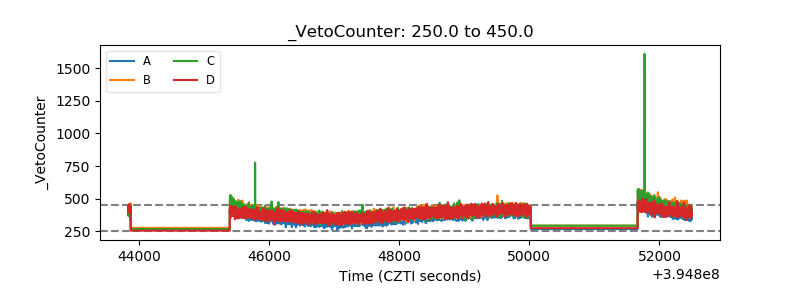 |