| Param | Original file | Final file |
|---|---|---|
| Filename | modeM0/AS1A10_073T02_9000005226_36620cztM0_level2.evt | modeM0/AS1A10_073T02_9000005226_36620cztM0_level2_quad_clean.evt |
| Size (bytes) | 517,671,360 | 60,151,680 |
| Size | 493.7 MB | 57.4 MB |
| Events in quadrant A | 2,984,405 | 372,026 |
| Events in quadrant B | 3,492,805 | 359,945 |
| Events in quadrant C | 3,321,672 | 361,571 |
| Events in quadrant D | 5,498,037 | 334,258 |
| Mode SS | |||
|---|---|---|---|
| Quadrant | BADHDUFLAG | Total packets | Discarded packets |
| A | 0 | 114 | 0 |
| B | 0 | 114 | 0 |
| C | 0 | 114 | 0 |
| D | 0 | 114 | 0 |
| Mode M0 | |||
|---|---|---|---|
| Quadrant | BADHDUFLAG | Total packets | Discarded packets |
| A | 0 | 12371 | 3 |
| B | 0 | 13941 | 2 |
| C | 0 | 13195 | 2 |
| D | 0 | 20222 | 2 |
| Mode M9 | |||
|---|---|---|---|
| Quadrant | BADHDUFLAG | Total packets | Discarded packets |
| A | 0 | 32 | 0 |
| B | 0 | 32 | 0 |
| C | 0 | 32 | 0 |
| D | 0 | 33 | 0 |
| Quadrant | Total seconds | Saturated seconds | Saturation percentage |
|---|---|---|---|
| A | 5620 | 54 | 0.960854% |
| B | 5620 | 293 | 5.213523% |
| C | 5620 | 155 | 2.758007% |
| D | 5620 | 469 | 8.345196% |
Noise dominated data is calculated using 1-second bins in cleaned event files. If a bin has >2000 counts, and if more than 50% of those come from <1% of pixels, then it is considered to be noise-dominated and hence unusable.
| Quadrant | # 1 sec bins | Bins with >0 counts | Bins with >2000 counts | High rate bins dominated by noise | Noise dominated (total time) | Noise dominated (detector-on time) | Marked lightcurve |
|---|---|---|---|---|---|---|---|
| A | 7414 | 5621 | 28 | 28 | 0.38% | 0.50% | 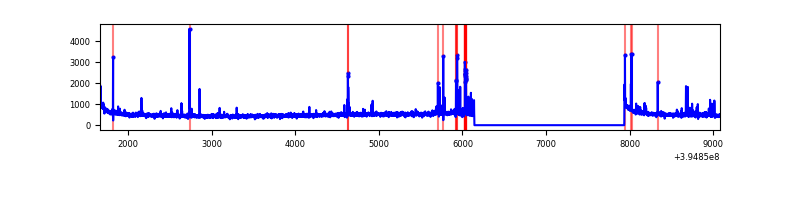 |
| B | 7414 | 5621 | 243 | 243 | 3.28% | 4.32% | 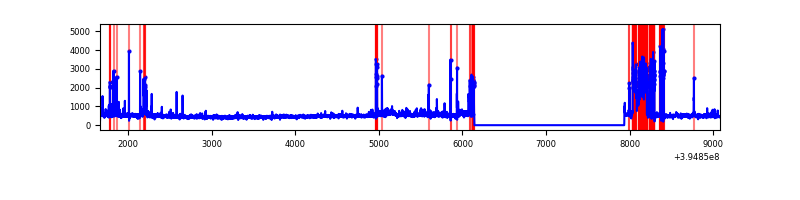 |
| C | 7414 | 5621 | 114 | 114 | 1.54% | 2.03% | 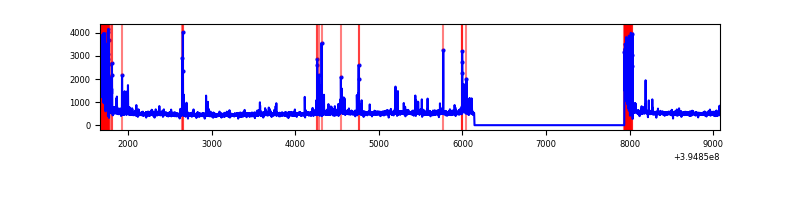 |
| D | 7414 | 5621 | 450 | 450 | 6.07% | 8.01% | 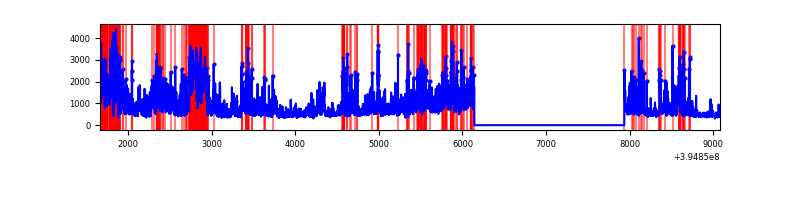 |
Top three noisy pixels from each quadrant. If the there are fewer than three noisy pixels in the level2.evt file, extra rows are filled as -1
| Pixel properties | Quadrant properties | ||||||
|---|---|---|---|---|---|---|---|
| Quadrant | DetID | PixID | Counts | Sigma | Mean | Median | Sigma |
| A | 10 | 83 | 204362 | 1526.98 | 661 | 649 | 133.4 |
| A | 15 | 223 | 178070 | 1329.9 | 661 | 649 | 133.4 |
| A | 9 | 143 | 28319 | 207.41 | 661 | 649 | 133.4 |
| B | 5 | 200 | 649925 | 5194.19 | 649 | 631 | 125.0 |
| B | 5 | 255 | 87507 | 694.99 | 649 | 631 | 125.0 |
| B | 0 | 219 | 63425 | 502.34 | 649 | 631 | 125.0 |
| C | 0 | 10 | 396368 | 2662.13 | 641 | 646 | 148.6 |
| C | 15 | 214 | 238235 | 1598.33 | 641 | 646 | 148.6 |
| C | 12 | 249 | 113252 | 757.53 | 641 | 646 | 148.6 |
| D | 12 | 235 | 2176495 | 14330.14 | 621 | 602 | 151.8 |
| D | 2 | 250 | 349566 | 2298.23 | 621 | 602 | 151.8 |
| D | 13 | 249 | 314318 | 2066.09 | 621 | 602 | 151.8 |
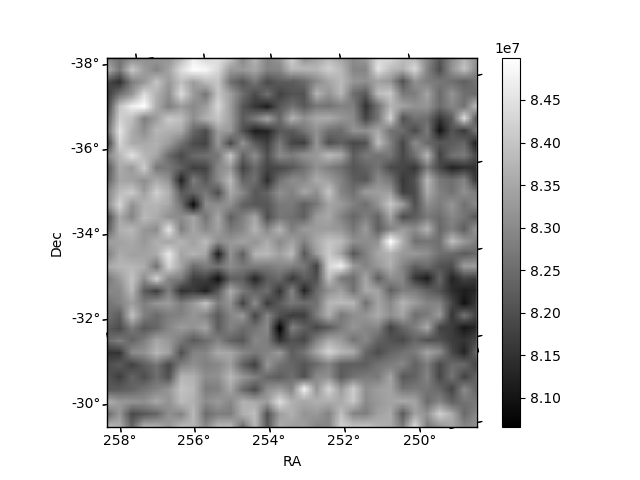
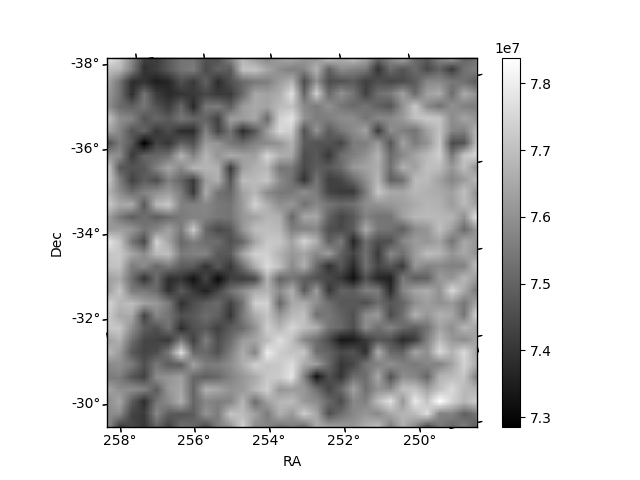
Histogram calculated using DETX and DETY for each event in the final _common_clean file
| Quadrant A |  |
 |
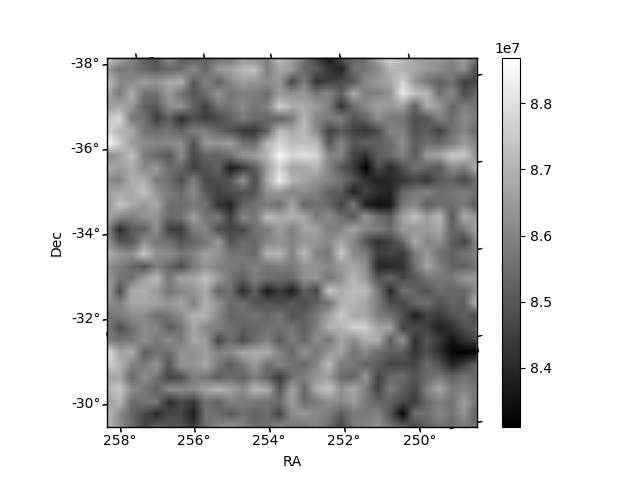
Quadrant B |
|---|---|---|---|
| Quadrant D | 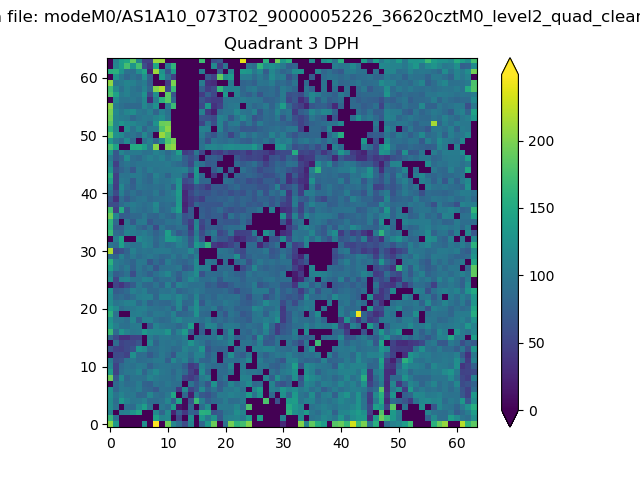 |
 |
Quadrant C |
| Plot type | Count rate plots | Images |
|---|---|---|
| Comparison with Poisson distribution Blue bars denote a histogram of data divided into 1 sec bins. Red curve is a Poisson curve with rate = median count rate of data. |
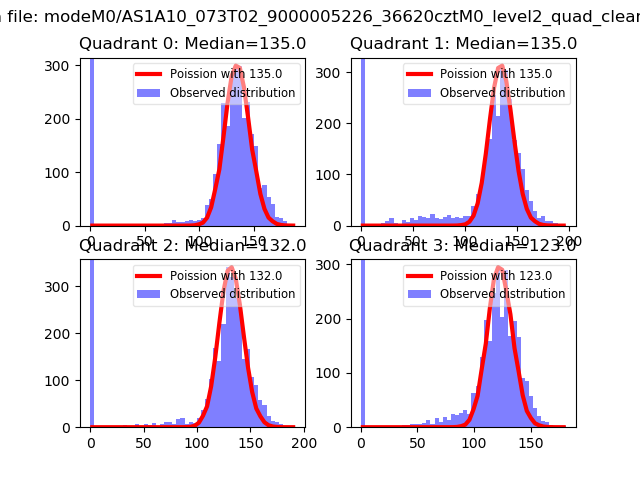 |
 |
| Quadrant-wise count rates Data is divided into 100 sec bins |
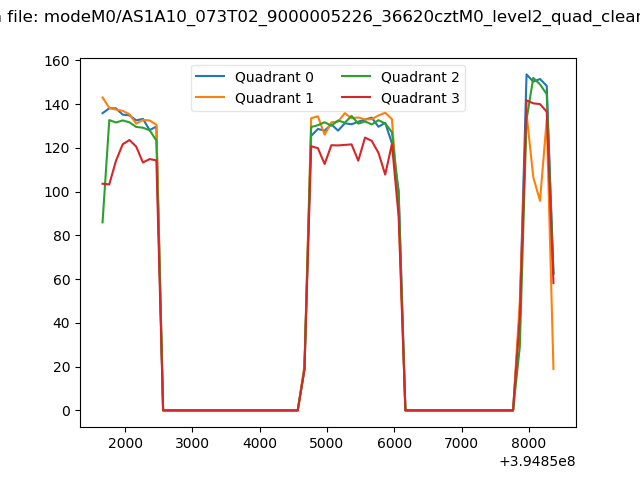 |
|
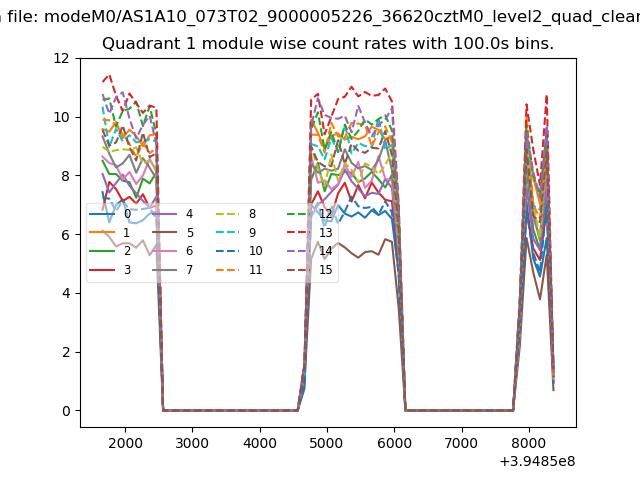
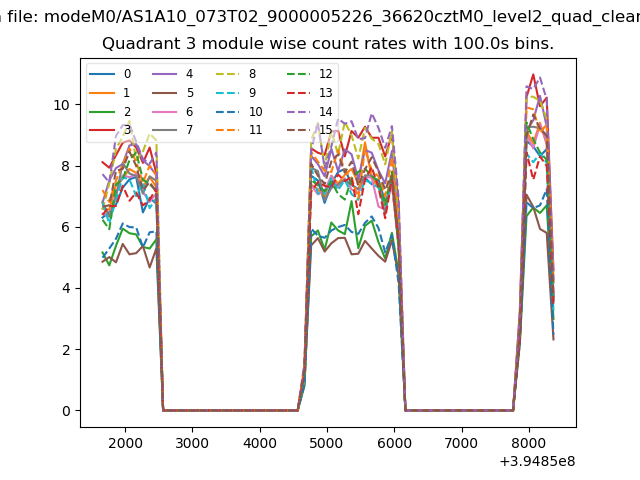
| Module-wise count rates for Quadrant A Data is divided into 100 sec bins |
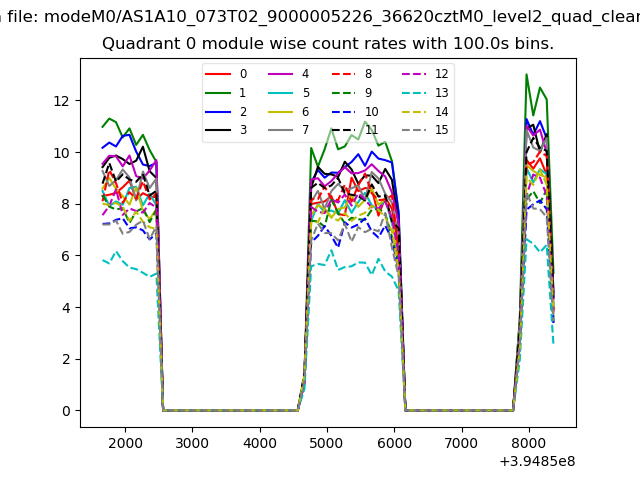 |
 |
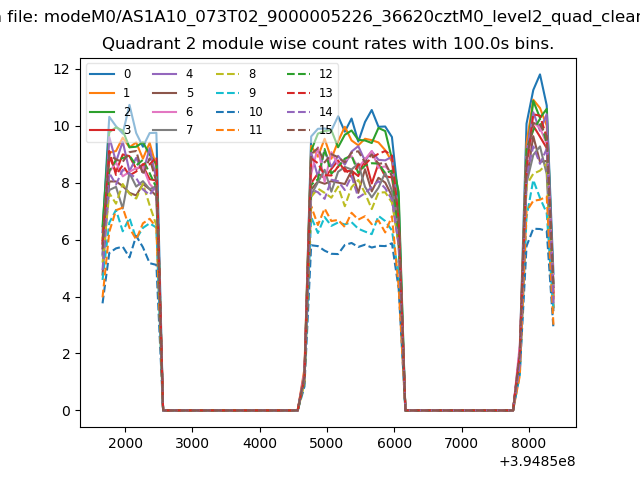
| Module-wise count rates for Quadrant B Data is divided into 100 sec bins |
 |
 |
| Module-wise count rates for Quadrant C Data is divided into 100 sec bins |
 |
 |
| Module-wise count rates for Quadrant D Data is divided into 100 sec bins |
 |
 |
| Parameter | Plot |
|---|---|
| CZT HV Monitor | 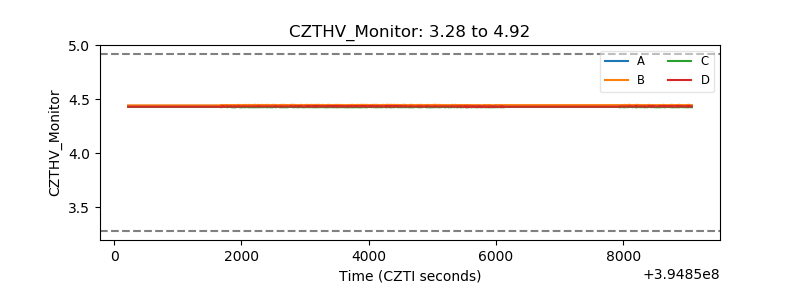 |
| D_VDD | 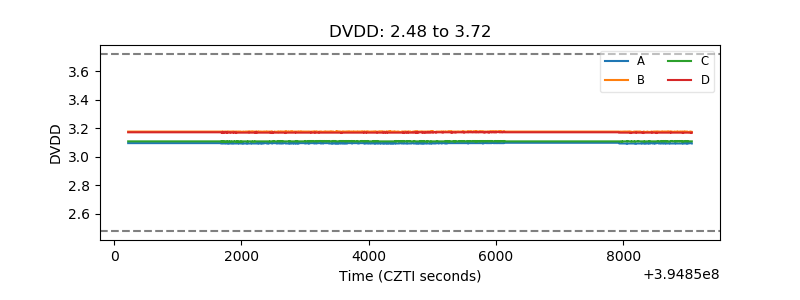 |
| Temperature 1 | 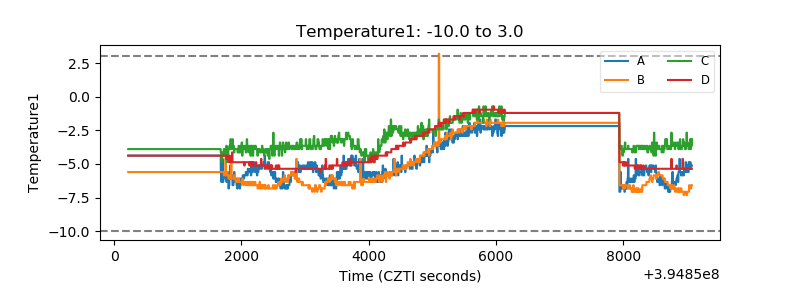 |
| Veto HV Monitor | 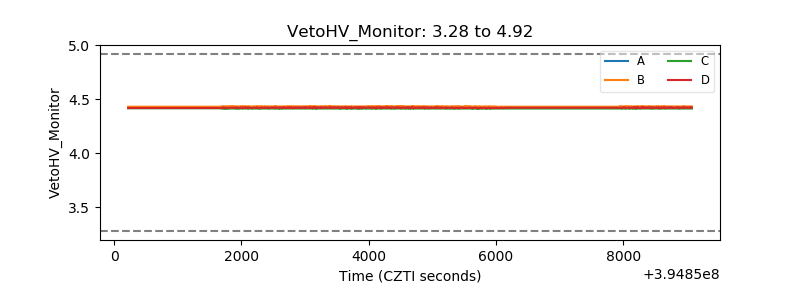 |
| Veto LLD |  |
| Alpha Counter | 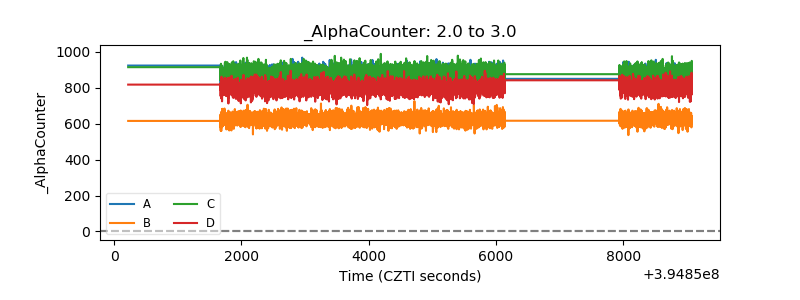 |
| _CPM_Rate | 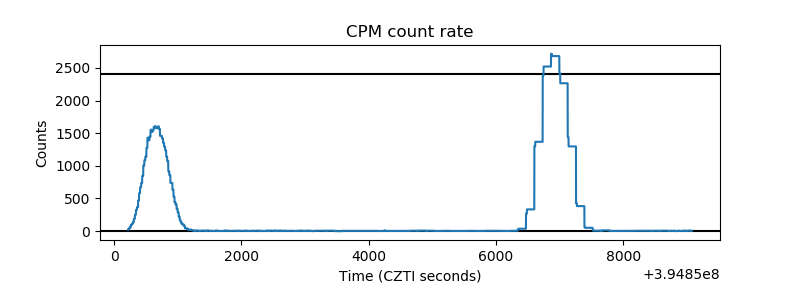 |
| CZT Counter | 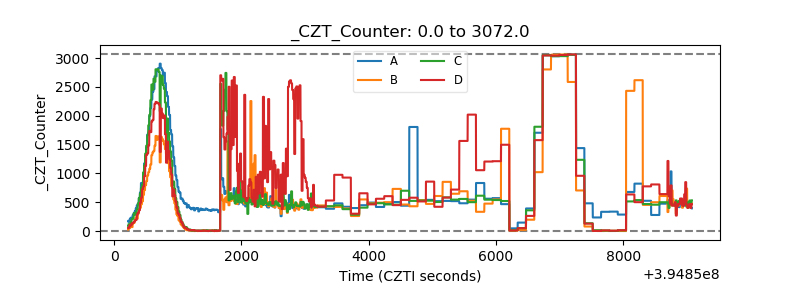 |
| +2.5 Volts monitor |  |
| +5 Volts monitor |  |
| _ROLL_ROT | 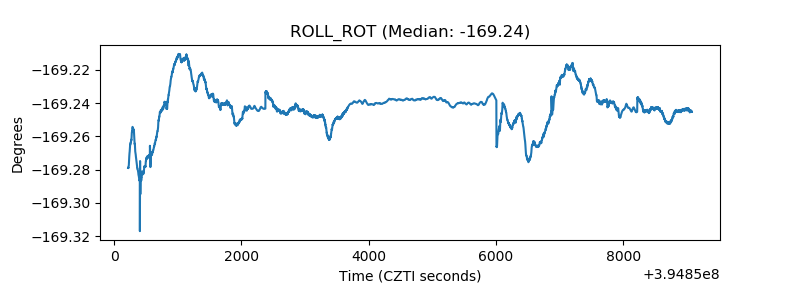 |
| _Roll_DEC | 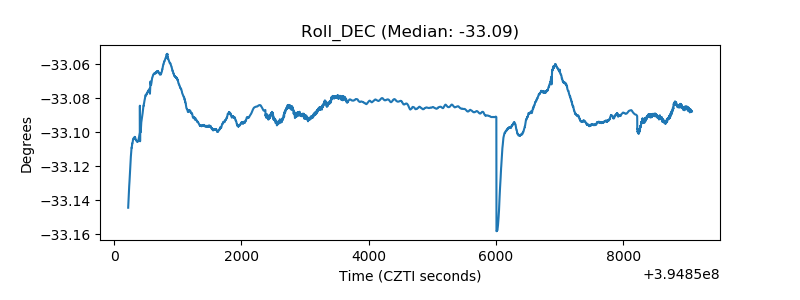 |
| _Roll_RA | 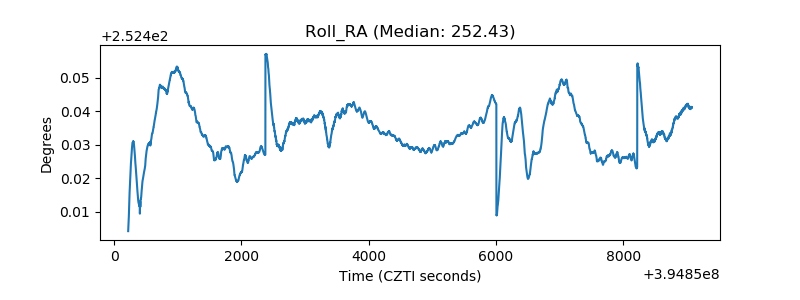 |
| Veto Counter | 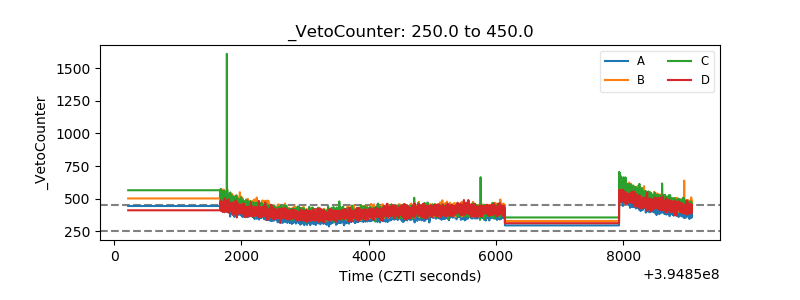 |