| Param | Original file | Final file |
|---|---|---|
| Filename | modeM0/AS1A10_073T02_9000005226_36622cztM0_level2.evt | modeM0/AS1A10_073T02_9000005226_36622cztM0_level2_quad_clean.evt |
| Size (bytes) | 475,470,720 | 49,495,680 |
| Size | 453.4 MB | 47.2 MB |
| Events in quadrant A | 2,896,965 | 289,607 |
| Events in quadrant B | 3,304,378 | 290,947 |
| Events in quadrant C | 3,369,199 | 288,620 |
| Events in quadrant D | 4,475,751 | 263,881 |
| Mode SS | |||
|---|---|---|---|
| Quadrant | BADHDUFLAG | Total packets | Discarded packets |
| A | 0 | 108 | 0 |
| B | 0 | 108 | 0 |
| C | 0 | 108 | 0 |
| D | 0 | 108 | 0 |
| Mode M0 | |||
|---|---|---|---|
| Quadrant | BADHDUFLAG | Total packets | Discarded packets |
| A | 0 | 11570 | 3 |
| B | 0 | 12950 | 2 |
| C | 0 | 12990 | 2 |
| D | 0 | 16919 | 2 |
| Mode M9 | |||
|---|---|---|---|
| Quadrant | BADHDUFLAG | Total packets | Discarded packets |
| A | 0 | 27 | 0 |
| B | 0 | 27 | 0 |
| C | 0 | 27 | 0 |
| D | 0 | 28 | 0 |
| Quadrant | Total seconds | Saturated seconds | Saturation percentage |
|---|---|---|---|
| A | 5207 | 20 | 0.384098% |
| B | 5207 | 164 | 3.149606% |
| C | 5207 | 166 | 3.188016% |
| D | 5207 | 282 | 5.415786% |
Noise dominated data is calculated using 1-second bins in cleaned event files. If a bin has >2000 counts, and if more than 50% of those come from <1% of pixels, then it is considered to be noise-dominated and hence unusable.
| Quadrant | # 1 sec bins | Bins with >0 counts | Bins with >2000 counts | High rate bins dominated by noise | Noise dominated (total time) | Noise dominated (detector-on time) | Marked lightcurve |
|---|---|---|---|---|---|---|---|
| A | 7240 | 5208 | 5 | 5 | 0.07% | 0.10% | 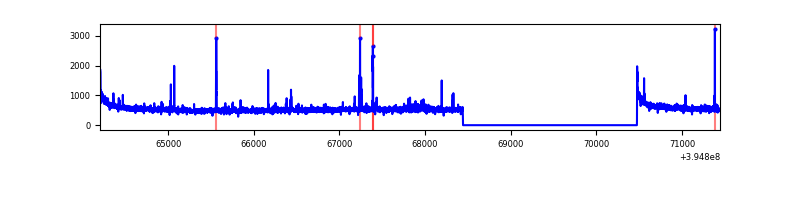 |
| B | 7240 | 5208 | 114 | 114 | 1.57% | 2.19% | 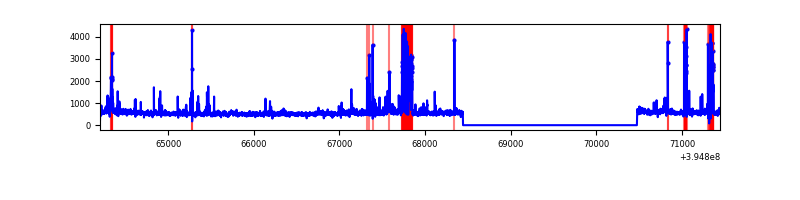 |
| C | 7240 | 5208 | 113 | 113 | 1.56% | 2.17% | 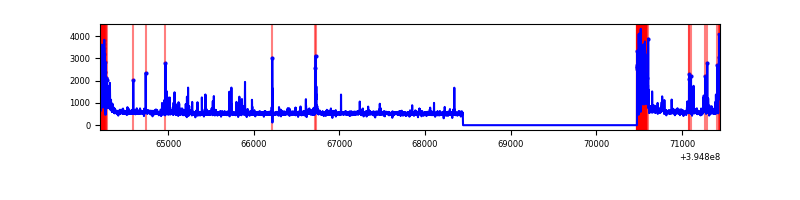 |
| D | 7239 | 5207 | 226 | 226 | 3.12% | 4.34% | 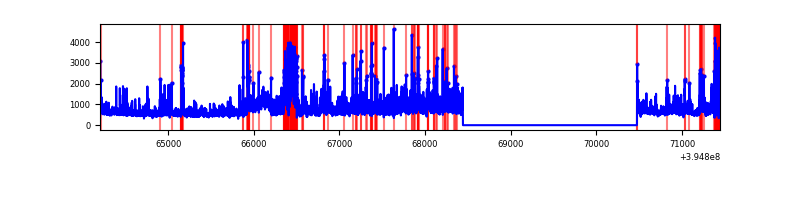 |
Top three noisy pixels from each quadrant. If the there are fewer than three noisy pixels in the level2.evt file, extra rows are filled as -1
| Pixel properties | Quadrant properties | ||||||
|---|---|---|---|---|---|---|---|
| Quadrant | DetID | PixID | Counts | Sigma | Mean | Median | Sigma |
| A | 10 | 83 | 200345 | 1499.81 | 670 | 659 | 133.1 |
| A | 15 | 223 | 87225 | 650.18 | 670 | 659 | 133.1 |
| A | 9 | 143 | 13685 | 97.84 | 670 | 659 | 133.1 |
| B | 5 | 200 | 267885 | 2169.81 | 663 | 647 | 123.2 |
| B | 5 | 255 | 226930 | 1837.28 | 663 | 647 | 123.2 |
| B | 0 | 213 | 85357 | 687.79 | 663 | 647 | 123.2 |
| C | 0 | 10 | 413799 | 2774.36 | 651 | 657 | 148.9 |
| C | 15 | 214 | 220605 | 1477.01 | 651 | 657 | 148.9 |
| C | 14 | 254 | 116841 | 780.21 | 651 | 657 | 148.9 |
| D | 12 | 235 | 968139 | 6289.74 | 639 | 624 | 153.8 |
| D | 2 | 249 | 371621 | 2411.82 | 639 | 624 | 153.8 |
| D | 13 | 249 | 207709 | 1346.24 | 639 | 624 | 153.8 |
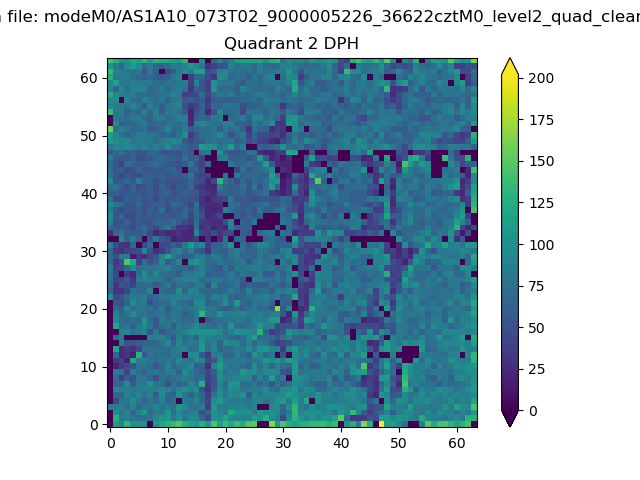
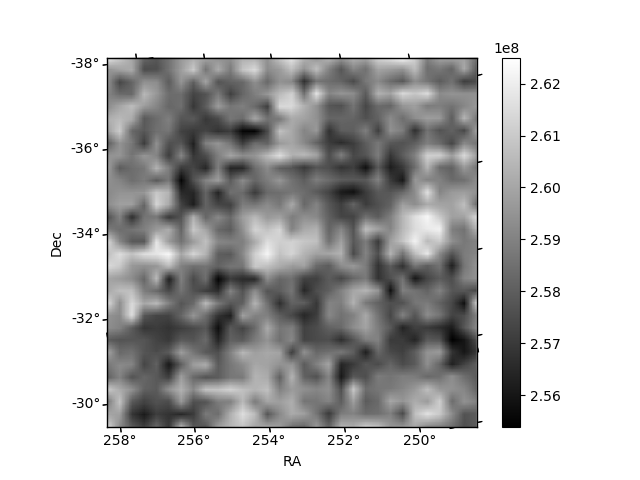
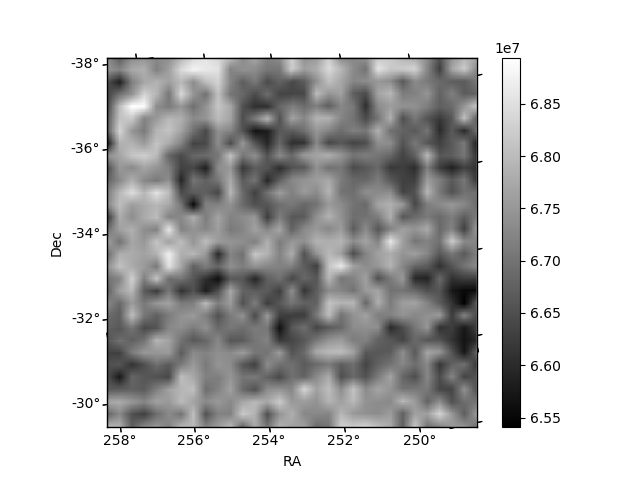
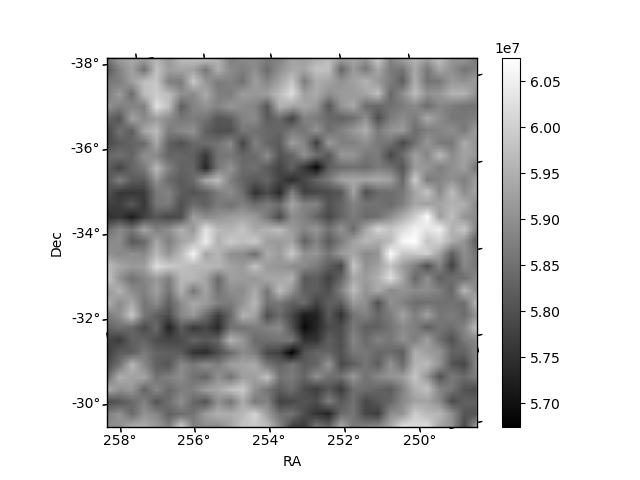
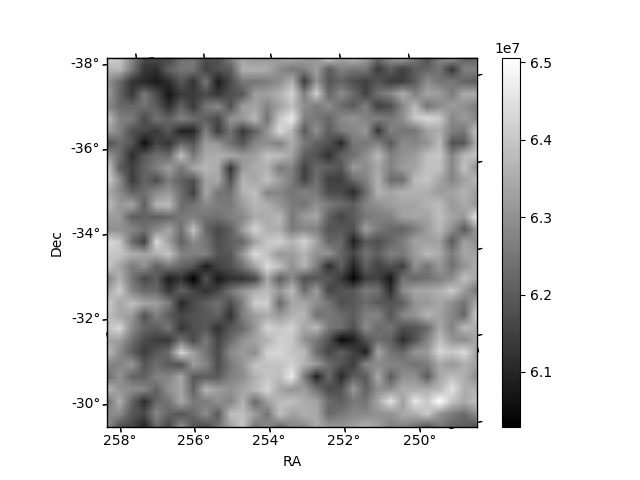
Histogram calculated using DETX and DETY for each event in the final _common_clean file
| Quadrant A | 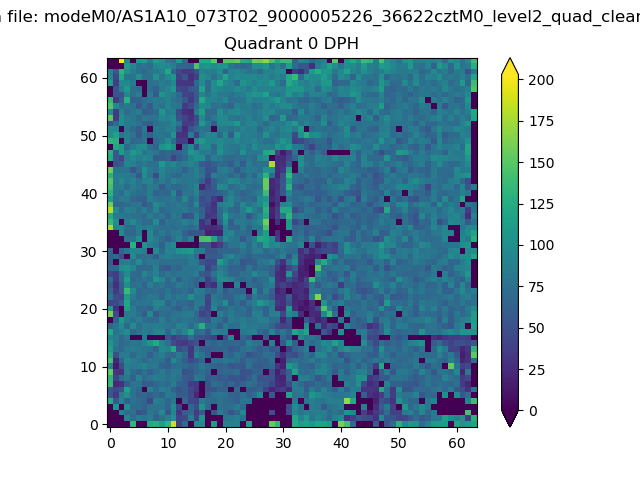 |
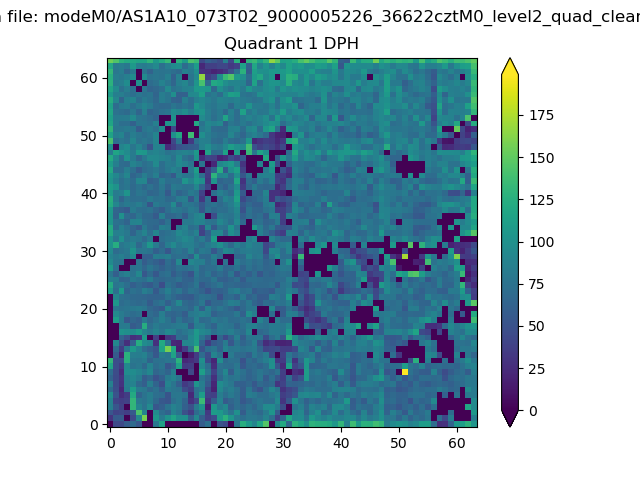 |
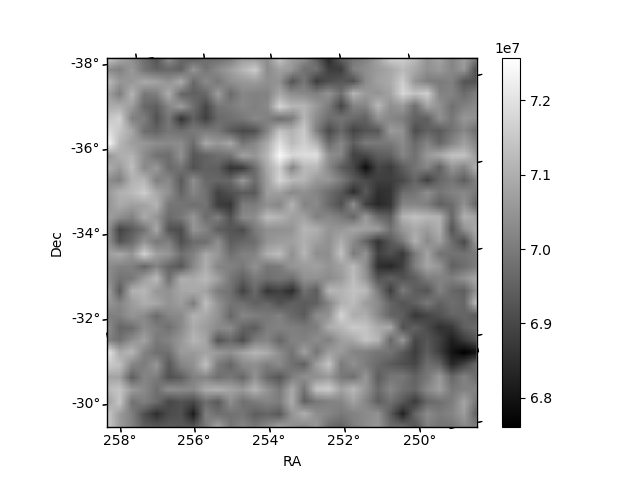
Quadrant B |
|---|---|---|---|
| Quadrant D | 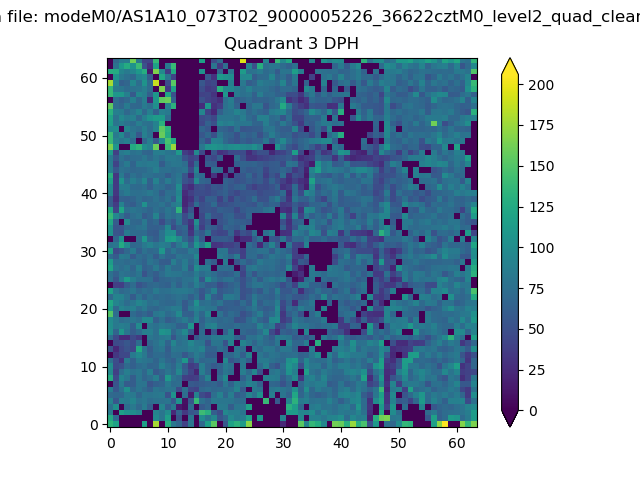 |
 |
Quadrant C |
| Plot type | Count rate plots | Images |
|---|---|---|
| Comparison with Poisson distribution Blue bars denote a histogram of data divided into 1 sec bins. Red curve is a Poisson curve with rate = median count rate of data. |
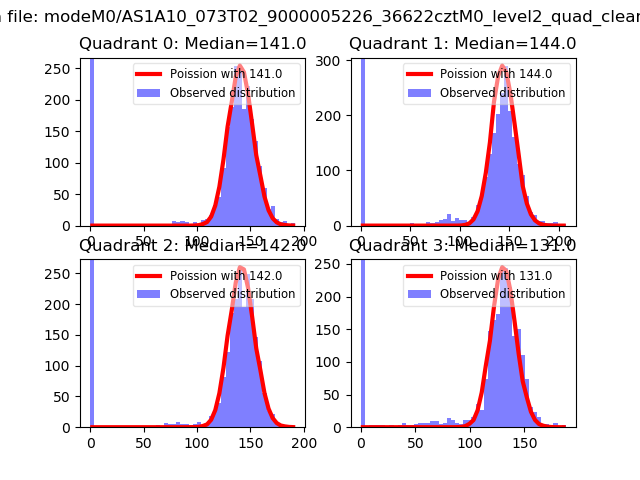 |
 |
| Quadrant-wise count rates Data is divided into 100 sec bins |
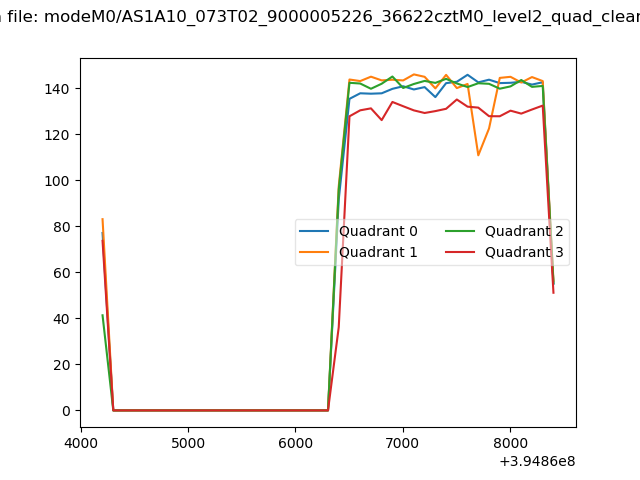 |
|
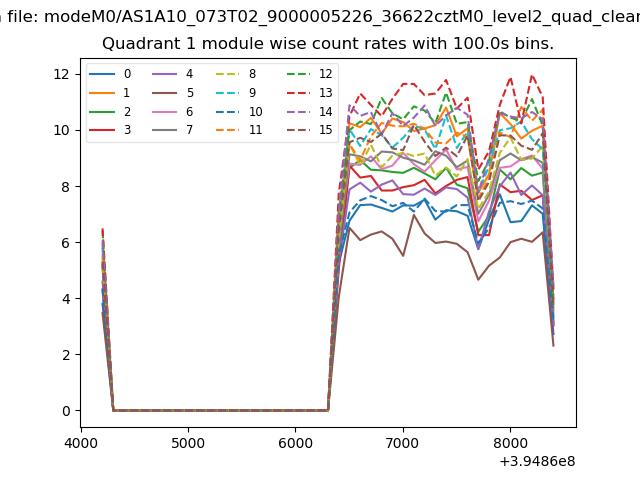
| Module-wise count rates for Quadrant A Data is divided into 100 sec bins |
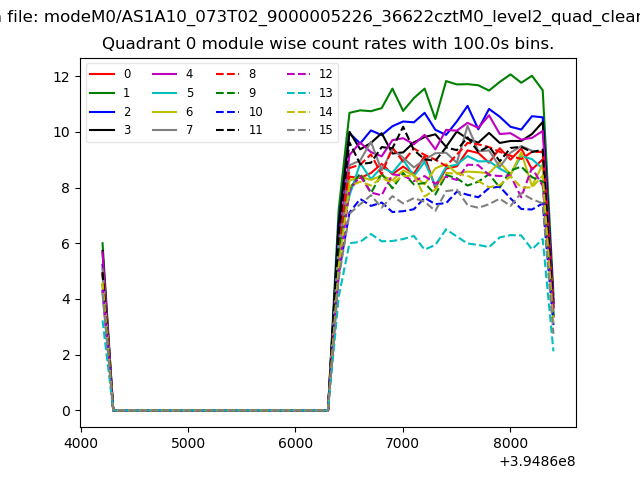 |
 |
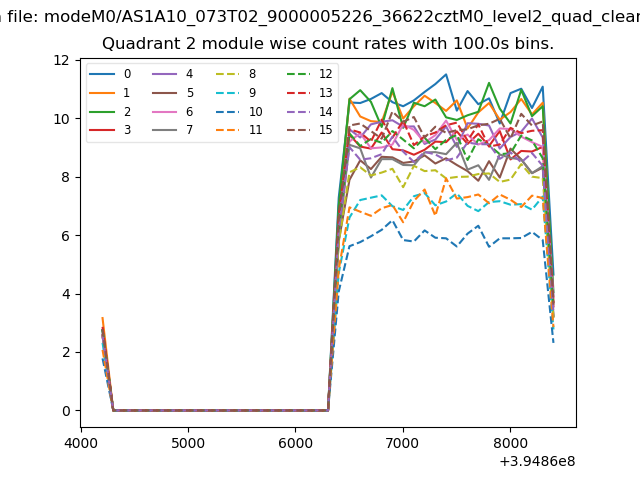
| Module-wise count rates for Quadrant B Data is divided into 100 sec bins |
 |
 |
| Module-wise count rates for Quadrant C Data is divided into 100 sec bins |
 |
 |
| Module-wise count rates for Quadrant D Data is divided into 100 sec bins |
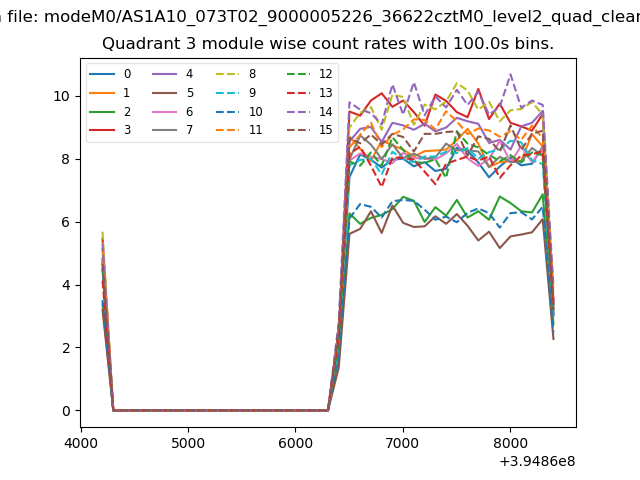 |
 |
| Parameter | Plot |
|---|---|
| CZT HV Monitor | 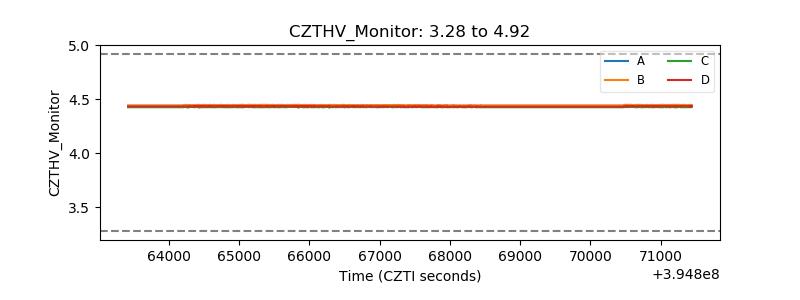 |
| D_VDD | 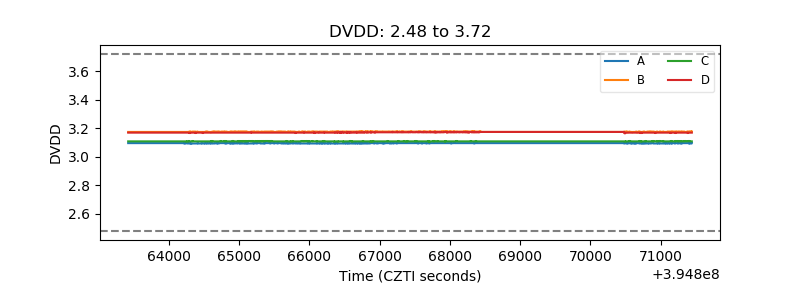 |
| Temperature 1 | 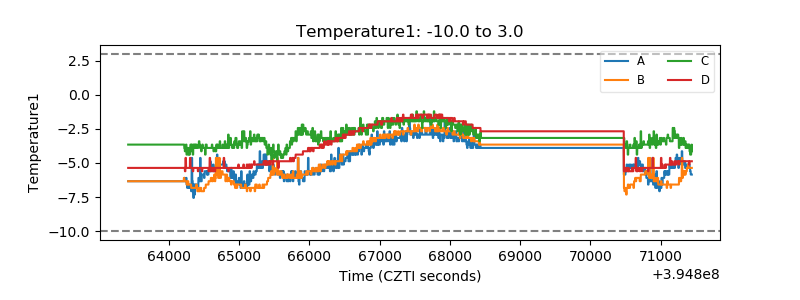 |
| Veto HV Monitor | 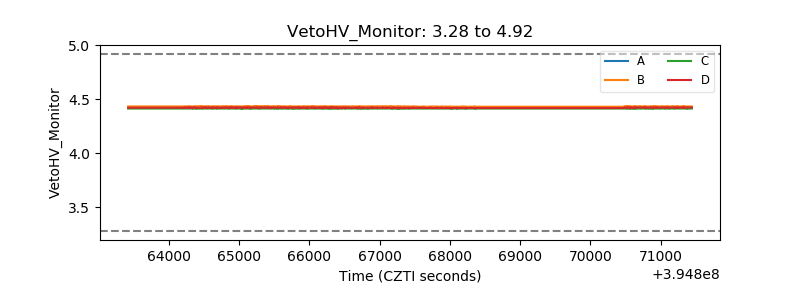 |
| Veto LLD | 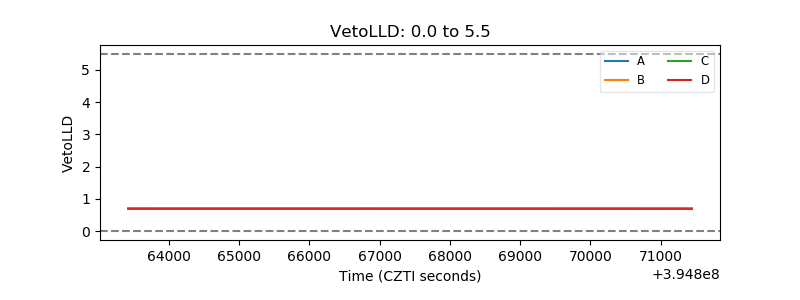 |
| Alpha Counter | 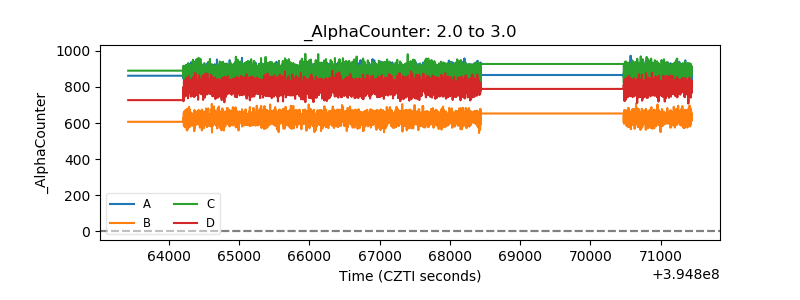 |
| _CPM_Rate | 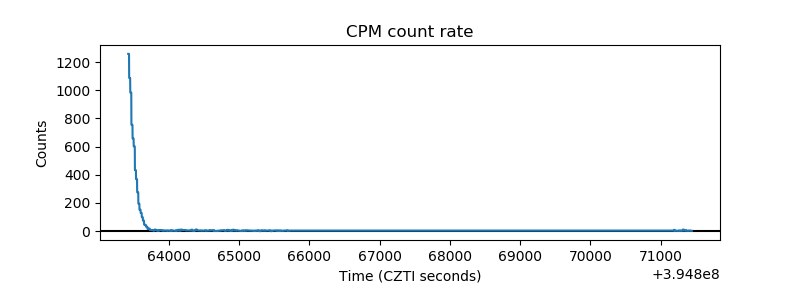 |
| CZT Counter | 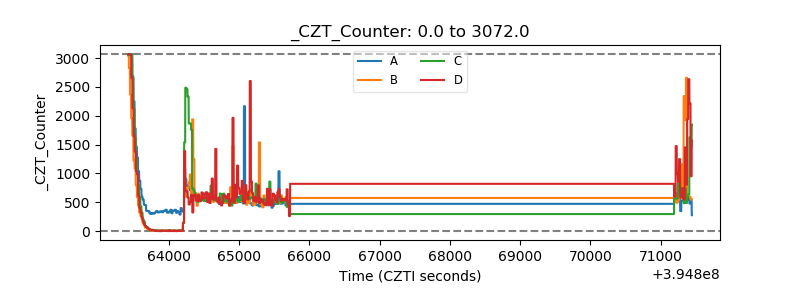 |
| +2.5 Volts monitor |  |
| +5 Volts monitor |  |
| _ROLL_ROT | 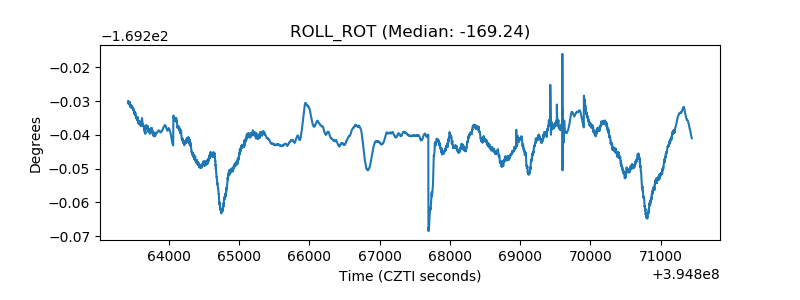 |
| _Roll_DEC | 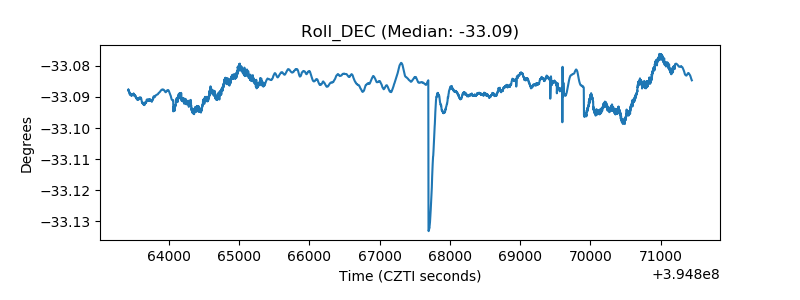 |
| _Roll_RA |  |
| Veto Counter | 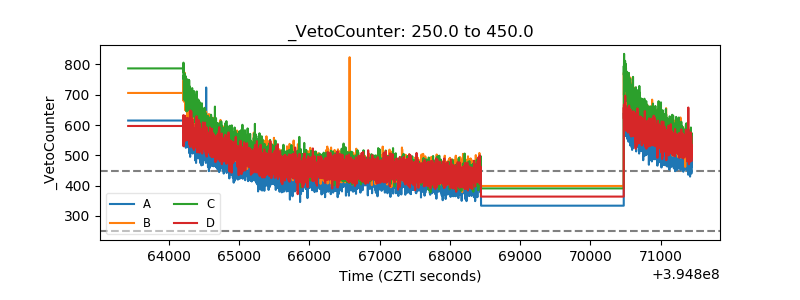 |