| Param | Original file | Final file |
|---|---|---|
| Filename | modeM0/AS1A10_073T02_9000005226_36623cztM0_level2.evt | modeM0/AS1A10_073T02_9000005226_36623cztM0_level2_quad_clean.evt |
| Size (bytes) | 485,357,760 | 55,321,920 |
| Size | 462.9 MB | 52.8 MB |
| Events in quadrant A | 2,894,484 | 335,413 |
| Events in quadrant B | 2,959,746 | 343,561 |
| Events in quadrant C | 3,617,262 | 340,865 |
| Events in quadrant D | 4,888,571 | 303,860 |
| Mode SS | |||
|---|---|---|---|
| Quadrant | BADHDUFLAG | Total packets | Discarded packets |
| A | 0 | 102 | 0 |
| B | 0 | 102 | 0 |
| C | 0 | 102 | 0 |
| D | 0 | 102 | 0 |
| Mode M0 | |||
|---|---|---|---|
| Quadrant | BADHDUFLAG | Total packets | Discarded packets |
| A | 0 | 11486 | 4 |
| B | 0 | 11817 | 2 |
| C | 0 | 13813 | 2 |
| D | 0 | 18034 | 2 |
| Mode M9 | |||
|---|---|---|---|
| Quadrant | BADHDUFLAG | Total packets | Discarded packets |
| A | 0 | 29 | 0 |
| B | 0 | 29 | 0 |
| C | 0 | 29 | 0 |
| D | 0 | 29 | 0 |
| Quadrant | Total seconds | Saturated seconds | Saturation percentage |
|---|---|---|---|
| A | 5006 | 24 | 0.479425% |
| B | 5006 | 61 | 1.218538% |
| C | 5006 | 269 | 5.373552% |
| D | 5006 | 399 | 7.970435% |
Noise dominated data is calculated using 1-second bins in cleaned event files. If a bin has >2000 counts, and if more than 50% of those come from <1% of pixels, then it is considered to be noise-dominated and hence unusable.
| Quadrant | # 1 sec bins | Bins with >0 counts | Bins with >2000 counts | High rate bins dominated by noise | Noise dominated (total time) | Noise dominated (detector-on time) | Marked lightcurve |
|---|---|---|---|---|---|---|---|
| A | 7130 | 5008 | 9 | 9 | 0.13% | 0.18% | 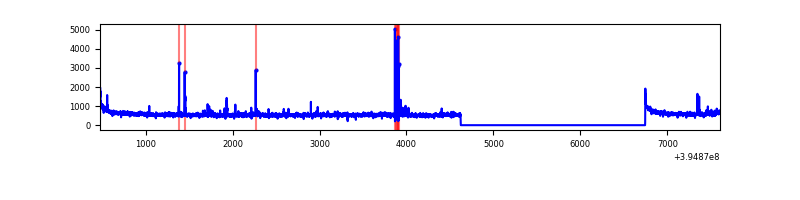 |
| B | 7130 | 5008 | 37 | 37 | 0.52% | 0.74% | 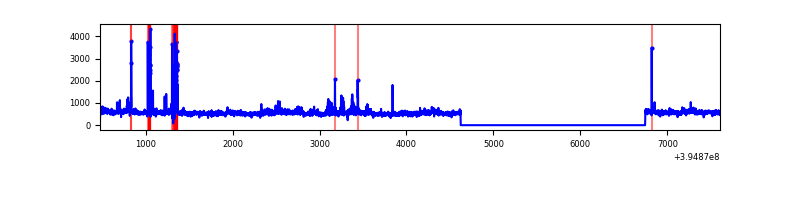 |
| C | 7130 | 5008 | 198 | 198 | 2.78% | 3.95% | 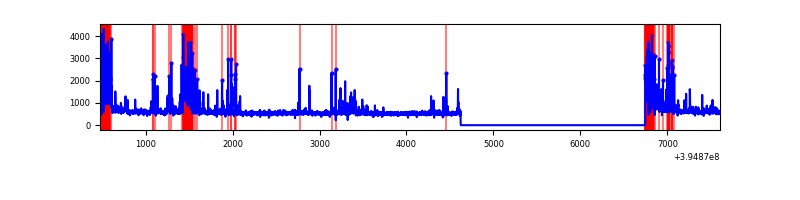 |
| D | 7130 | 5008 | 355 | 355 | 4.98% | 7.09% | 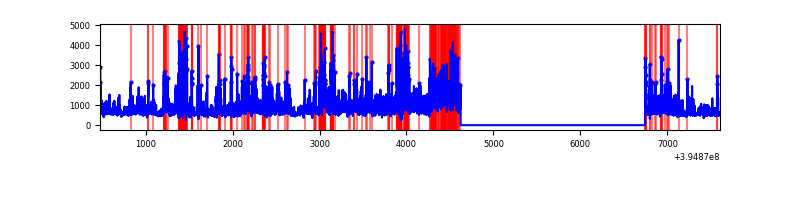 |
Top three noisy pixels from each quadrant. If the there are fewer than three noisy pixels in the level2.evt file, extra rows are filled as -1
| Pixel properties | Quadrant properties | ||||||
|---|---|---|---|---|---|---|---|
| Quadrant | DetID | PixID | Counts | Sigma | Mean | Median | Sigma |
| A | 10 | 83 | 196661 | 1509.77 | 654 | 642 | 129.8 |
| A | 15 | 223 | 127621 | 978.01 | 654 | 642 | 129.8 |
| A | 7 | 192 | 37260 | 282.04 | 654 | 642 | 129.8 |
| B | 5 | 255 | 126022 | 1040.09 | 649 | 634 | 120.6 |
| B | 0 | 213 | 91385 | 752.78 | 649 | 634 | 120.6 |
| B | 5 | 200 | 78209 | 643.49 | 649 | 634 | 120.6 |
| C | 0 | 10 | 490719 | 3419.68 | 629 | 635 | 143.3 |
| C | 14 | 254 | 389604 | 2714.12 | 629 | 635 | 143.3 |
| C | 15 | 214 | 211615 | 1472.16 | 629 | 635 | 143.3 |
| D | 12 | 235 | 1710769 | 11290.62 | 623 | 607 | 151.5 |
| D | 2 | 249 | 484481 | 3194.57 | 623 | 607 | 151.5 |
| D | 12 | 6 | 46600 | 303.65 | 623 | 607 | 151.5 |
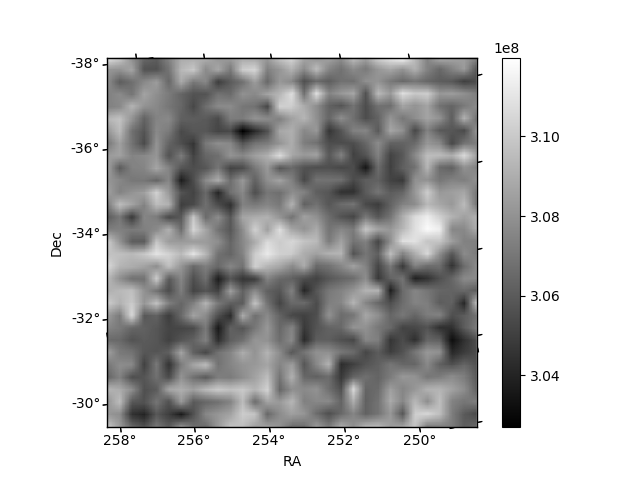
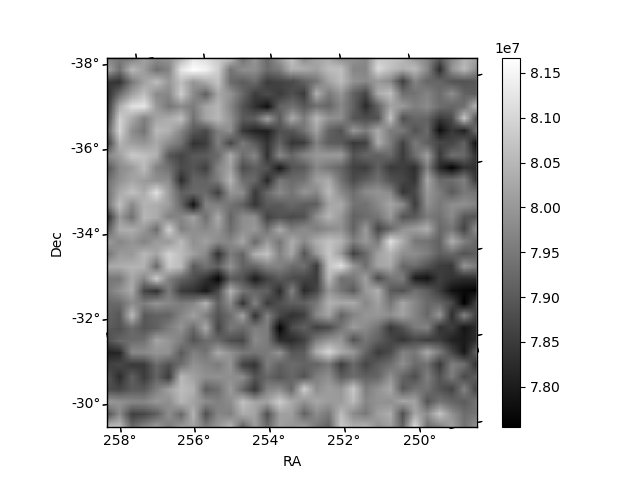
Histogram calculated using DETX and DETY for each event in the final _common_clean file
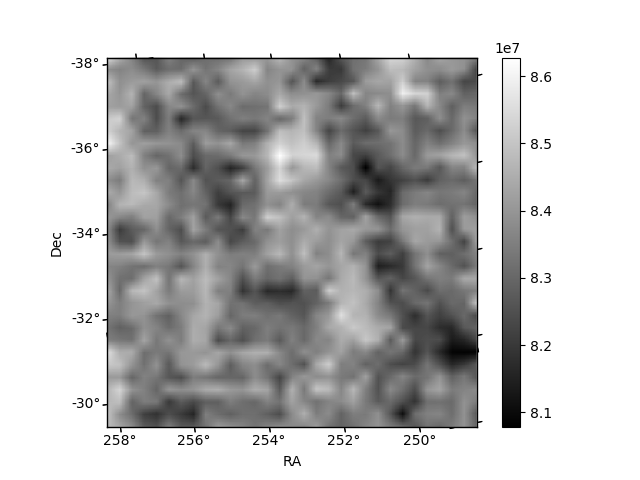
| Quadrant A | 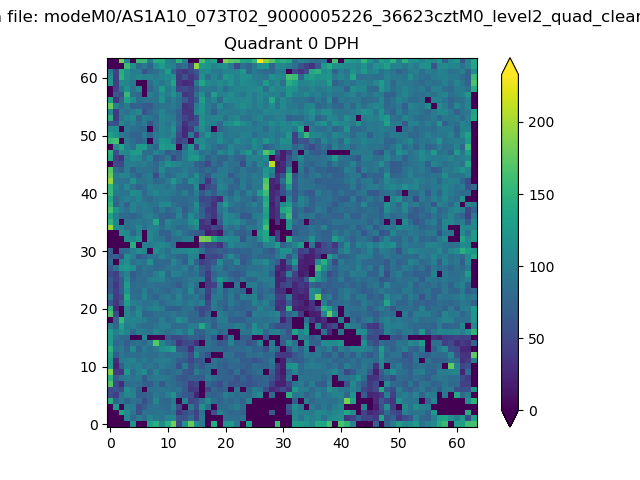 |
 |
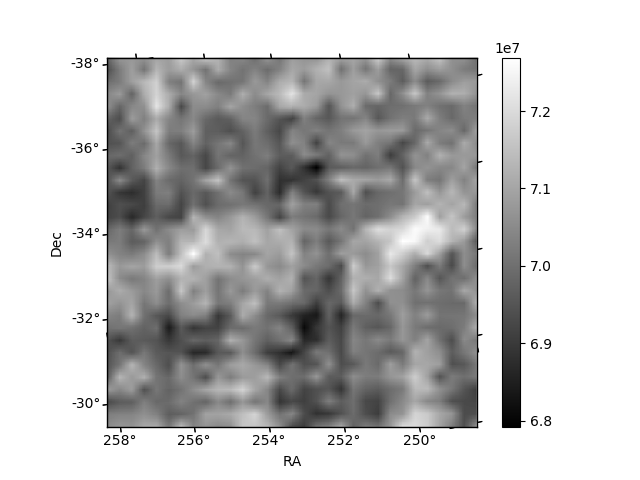
Quadrant B |
|---|---|---|---|
| Quadrant D | 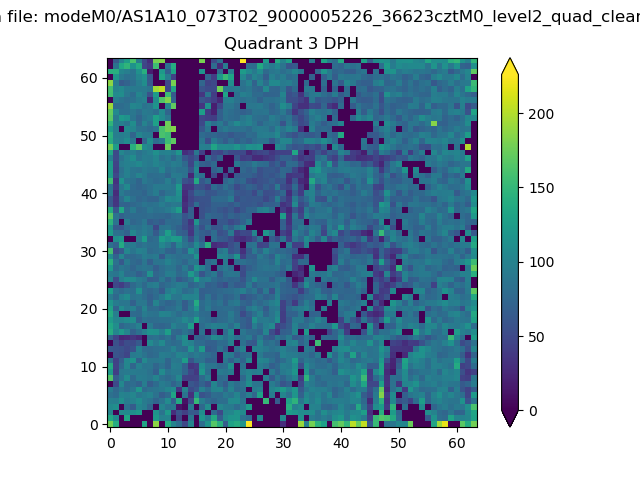 |
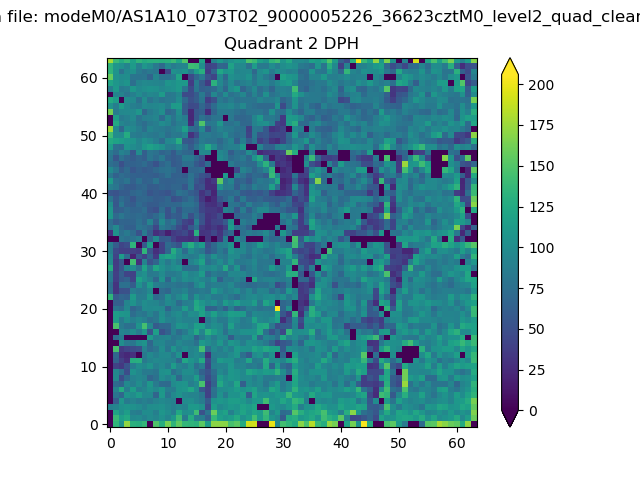 |
Quadrant C |
| Plot type | Count rate plots | Images |
|---|---|---|
| Comparison with Poisson distribution Blue bars denote a histogram of data divided into 1 sec bins. Red curve is a Poisson curve with rate = median count rate of data. |
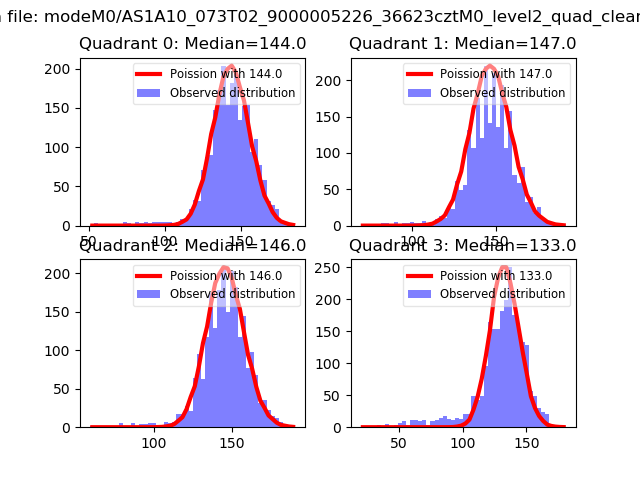 |
 |
| Quadrant-wise count rates Data is divided into 100 sec bins |
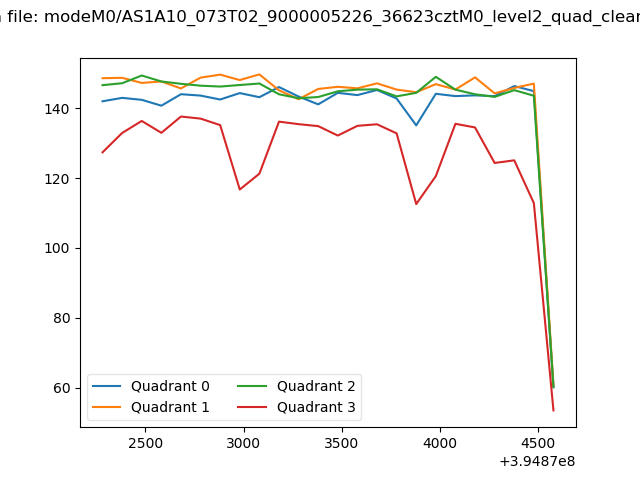 |
|
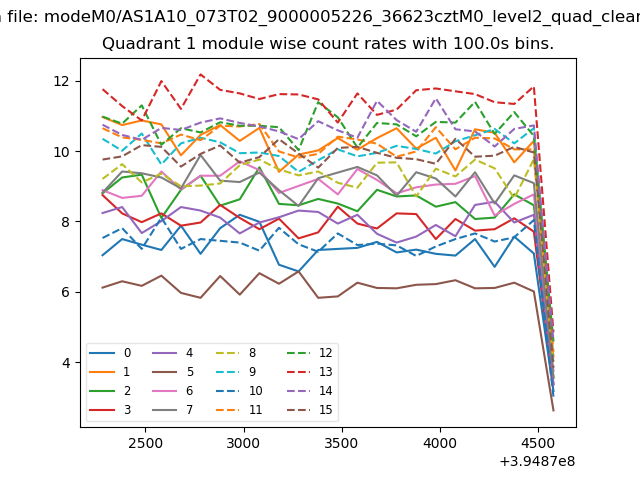
| Module-wise count rates for Quadrant A Data is divided into 100 sec bins |
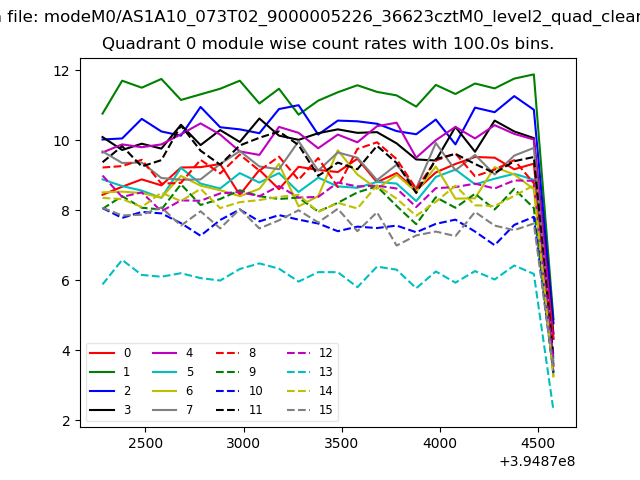 |
 |
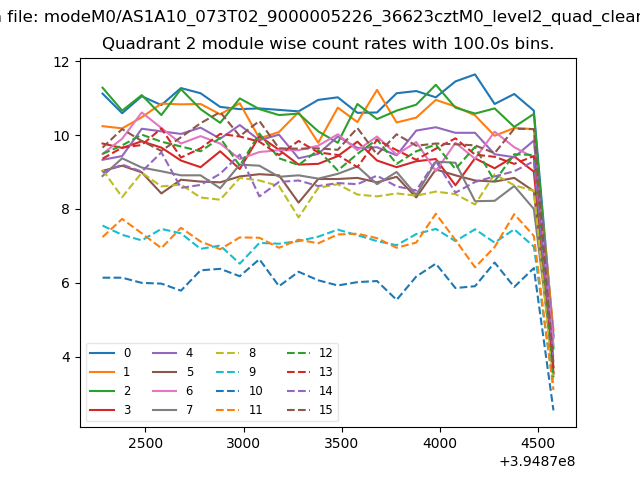
| Module-wise count rates for Quadrant B Data is divided into 100 sec bins |
 |
 |
| Module-wise count rates for Quadrant C Data is divided into 100 sec bins |
 |
 |
| Module-wise count rates for Quadrant D Data is divided into 100 sec bins |
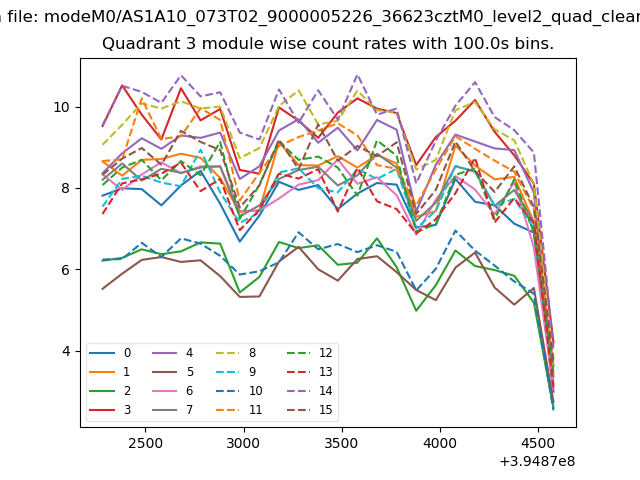 |
 |
| Parameter | Plot |
|---|---|
| CZT HV Monitor | 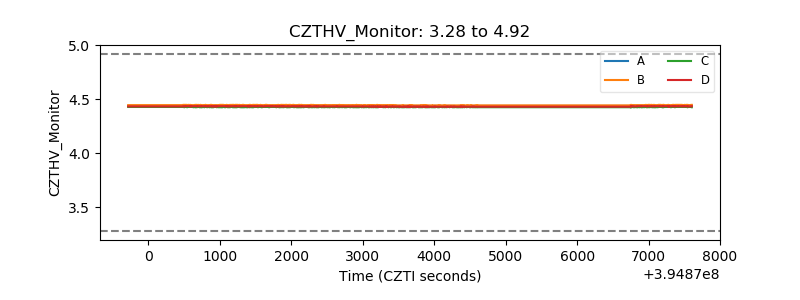 |
| D_VDD | 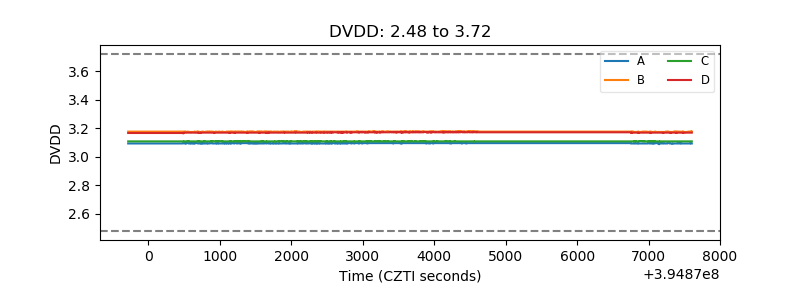 |
| Temperature 1 | 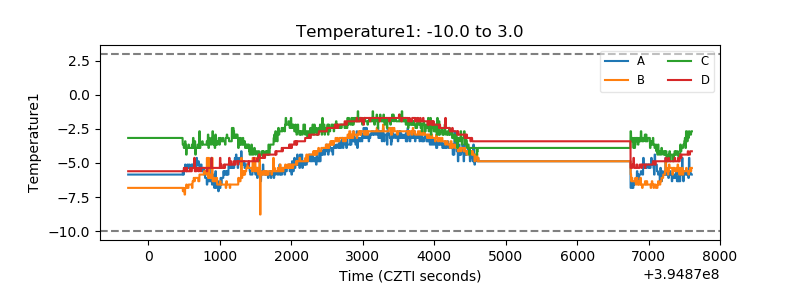 |
| Veto HV Monitor |  |
| Veto LLD | 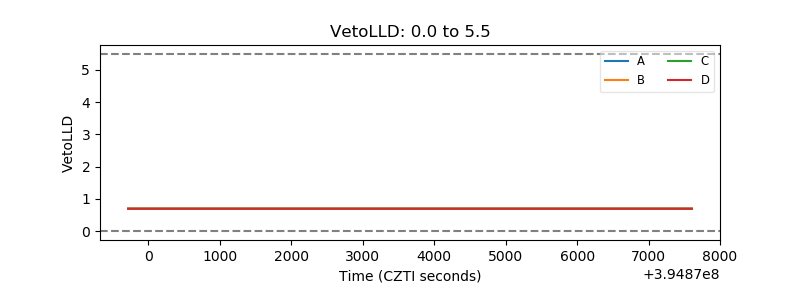 |
| Alpha Counter | 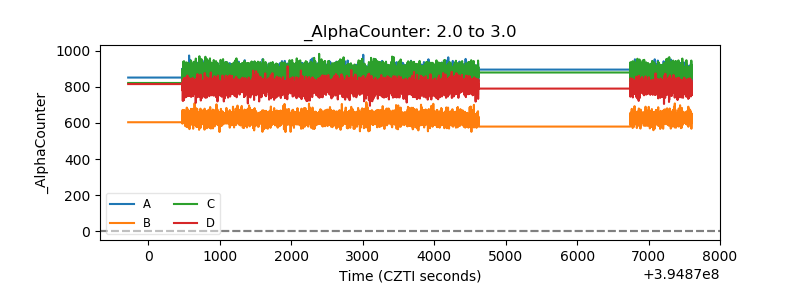 |
| _CPM_Rate | 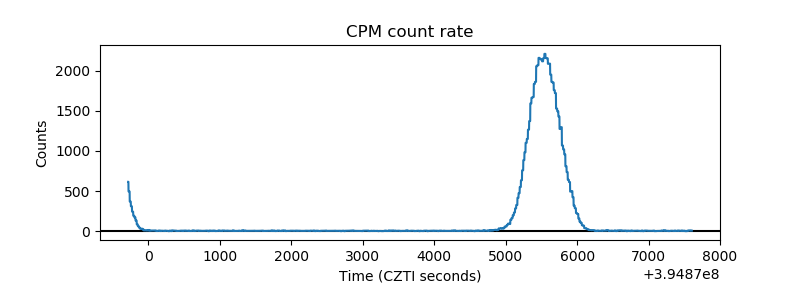 |
| CZT Counter | 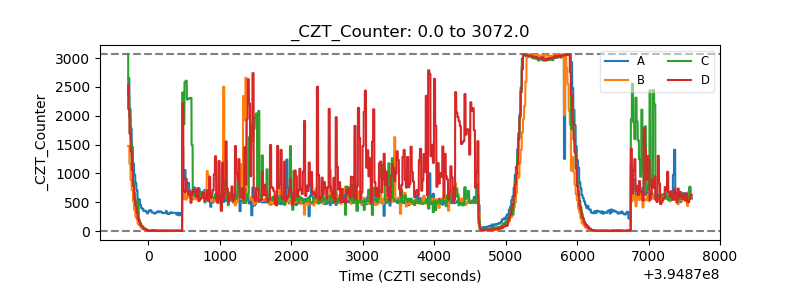 |
| +2.5 Volts monitor |  |
| +5 Volts monitor |  |
| _ROLL_ROT | 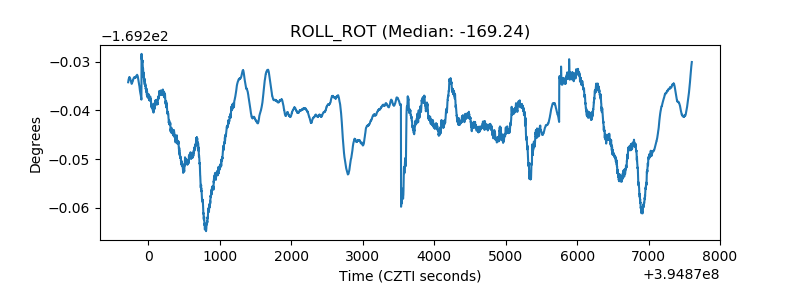 |
| _Roll_DEC | 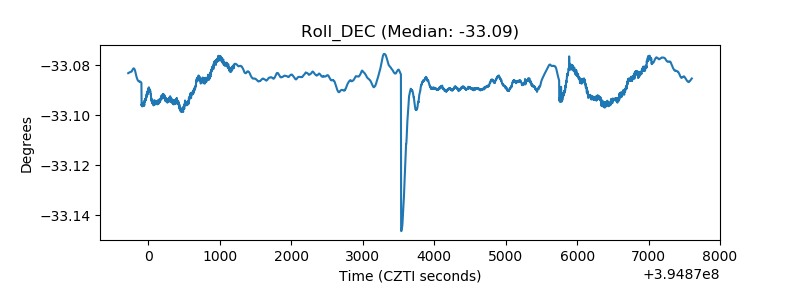 |
| _Roll_RA | 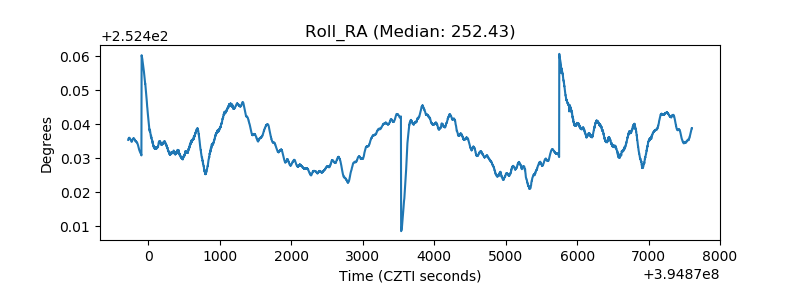 |
| Veto Counter | 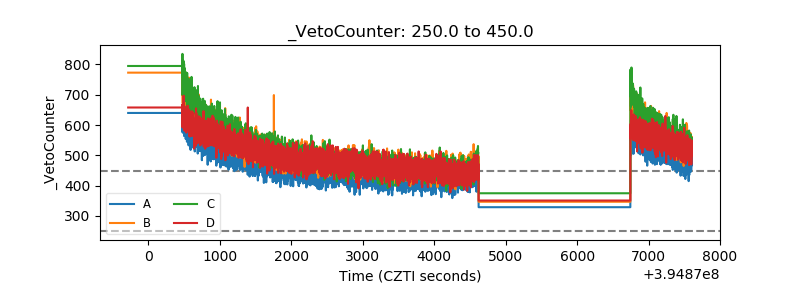 |