| Param | Original file | Final file |
|---|---|---|
| Filename | modeM0/AS1A10_073T02_9000005226_36625cztM0_level2.evt | modeM0/AS1A10_073T02_9000005226_36625cztM0_level2_quad_clean.evt |
| Size (bytes) | 619,758,720 | 76,075,200 |
| Size | 591.0 MB | 72.6 MB |
| Events in quadrant A | 2,854,109 | 521,824 |
| Events in quadrant B | 4,483,775 | 453,725 |
| Events in quadrant C | 3,439,426 | 518,145 |
| Events in quadrant D | 7,633,930 | 437,947 |
| Mode SS | |||
|---|---|---|---|
| Quadrant | BADHDUFLAG | Total packets | Discarded packets |
| A | 0 | 112 | 0 |
| B | 0 | 112 | 0 |
| C | 0 | 112 | 0 |
| D | 0 | 112 | 0 |
| Mode M0 | |||
|---|---|---|---|
| Quadrant | BADHDUFLAG | Total packets | Discarded packets |
| A | 0 | 11558 | 3 |
| B | 0 | 16418 | 2 |
| C | 0 | 13308 | 2 |
| D | 0 | 26413 | 2 |
| Mode M9 | |||
|---|---|---|---|
| Quadrant | BADHDUFLAG | Total packets | Discarded packets |
| A | 0 | 41 | 0 |
| B | 0 | 41 | 0 |
| C | 0 | 41 | 0 |
| D | 0 | 41 | 0 |
| Quadrant | Total seconds | Saturated seconds | Saturation percentage |
|---|---|---|---|
| A | 5291 | 24 | 0.453600% |
| B | 5291 | 881 | 16.650917% |
| C | 5291 | 172 | 3.250803% |
| D | 5291 | 1121 | 21.186921% |
Noise dominated data is calculated using 1-second bins in cleaned event files. If a bin has >2000 counts, and if more than 50% of those come from <1% of pixels, then it is considered to be noise-dominated and hence unusable.
| Quadrant | # 1 sec bins | Bins with >0 counts | Bins with >2000 counts | High rate bins dominated by noise | Noise dominated (total time) | Noise dominated (detector-on time) | Marked lightcurve |
|---|---|---|---|---|---|---|---|
| A | 9477 | 5293 | 9 | 9 | 0.09% | 0.17% | 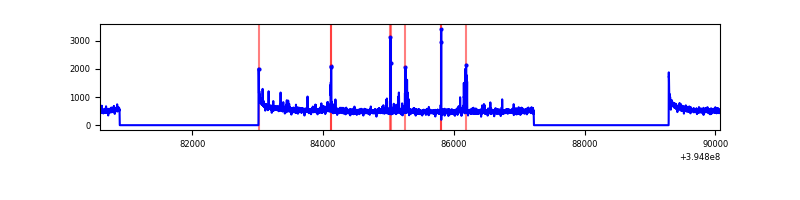 |
| B | 9477 | 5293 | 720 | 720 | 7.60% | 13.60% | 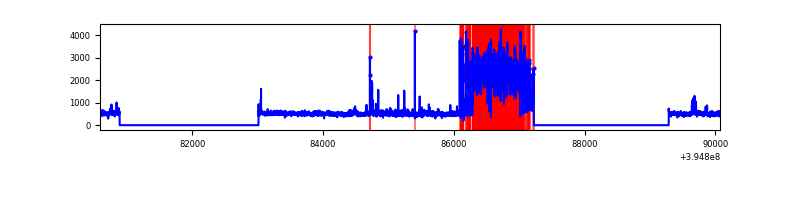 |
| C | 9477 | 5293 | 138 | 138 | 1.46% | 2.61% | 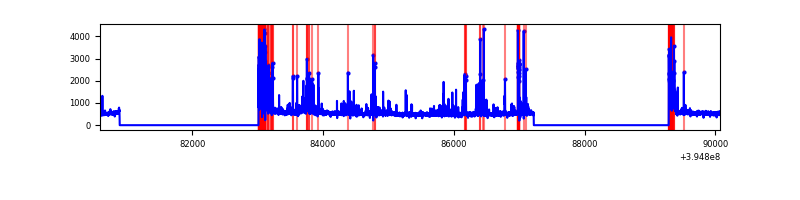 |
| D | 9477 | 5293 | 1114 | 1114 | 11.75% | 21.05% | 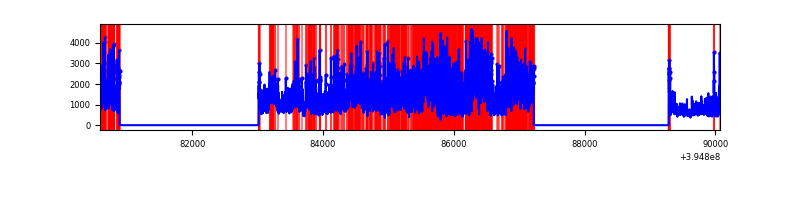 |
Top three noisy pixels from each quadrant. If the there are fewer than three noisy pixels in the level2.evt file, extra rows are filled as -1
| Pixel properties | Quadrant properties | ||||||
|---|---|---|---|---|---|---|---|
| Quadrant | DetID | PixID | Counts | Sigma | Mean | Median | Sigma |
| A | 10 | 83 | 205338 | 1554.3 | 652 | 641 | 131.7 |
| A | 15 | 223 | 107950 | 814.82 | 652 | 641 | 131.7 |
| A | 9 | 143 | 14639 | 106.29 | 652 | 641 | 131.7 |
| B | 5 | 200 | 1974670 | 17585.29 | 588 | 575 | 112.3 |
| B | 0 | 219 | 59502 | 524.92 | 588 | 575 | 112.3 |
| B | 0 | 213 | 41436 | 363.99 | 588 | 575 | 112.3 |
| C | 0 | 10 | 399135 | 2771.52 | 620 | 627 | 143.8 |
| C | 0 | 207 | 235404 | 1632.82 | 620 | 627 | 143.8 |
| C | 15 | 214 | 224465 | 1556.74 | 620 | 627 | 143.8 |
| D | 12 | 235 | 4617406 | 31574.34 | 596 | 579 | 146.2 |
| D | 13 | 171 | 192145 | 1310.11 | 596 | 579 | 146.2 |
| D | 12 | 17 | 138666 | 944.37 | 596 | 579 | 146.2 |
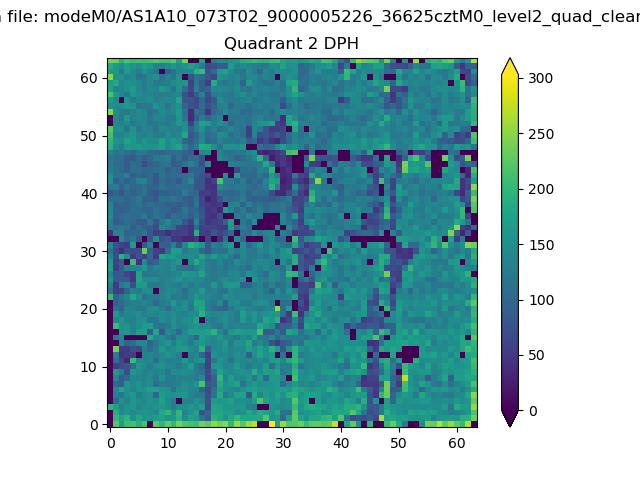
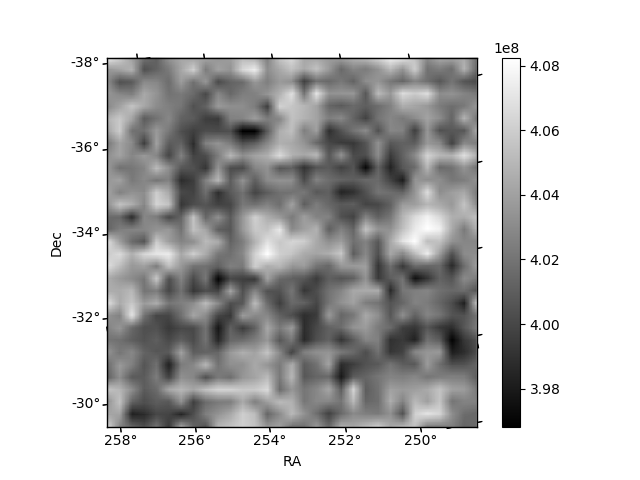
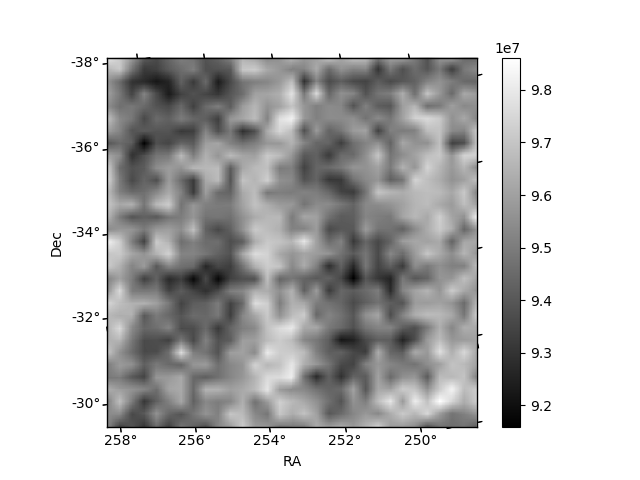
Histogram calculated using DETX and DETY for each event in the final _common_clean file
| Quadrant A | 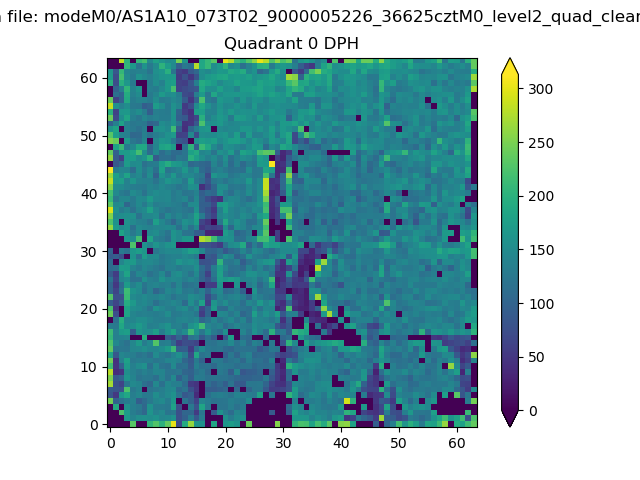 |
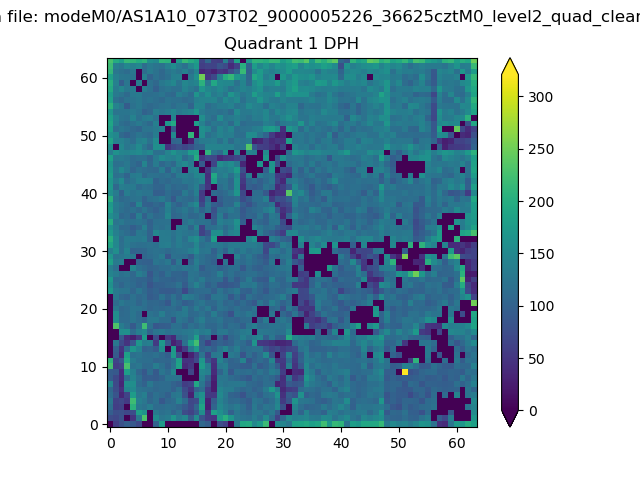 |
Quadrant B |
|---|---|---|---|
| Quadrant D | 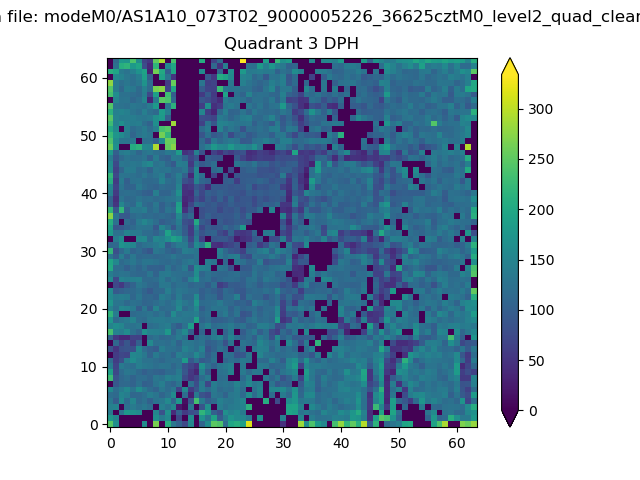 |
 |
Quadrant C |
| Plot type | Count rate plots | Images |
|---|---|---|
| Comparison with Poisson distribution Blue bars denote a histogram of data divided into 1 sec bins. Red curve is a Poisson curve with rate = median count rate of data. |
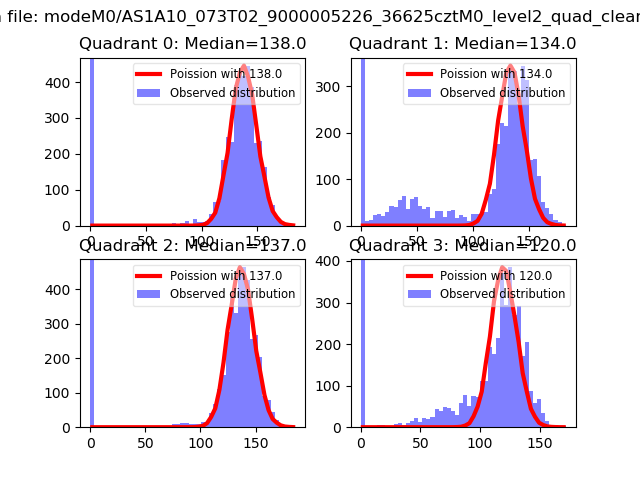 |
 |
| Quadrant-wise count rates Data is divided into 100 sec bins |
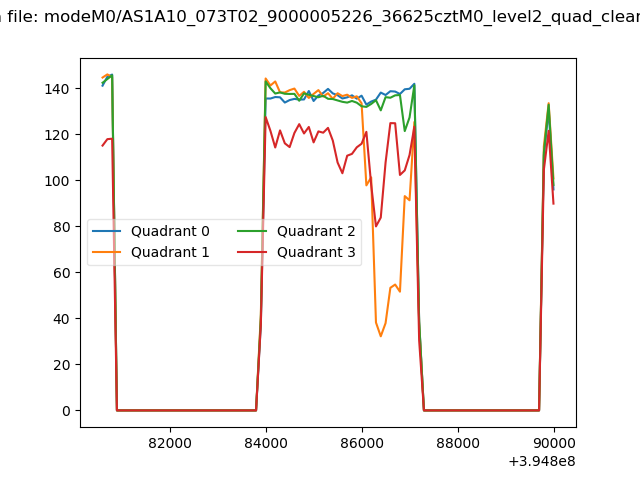 |
|
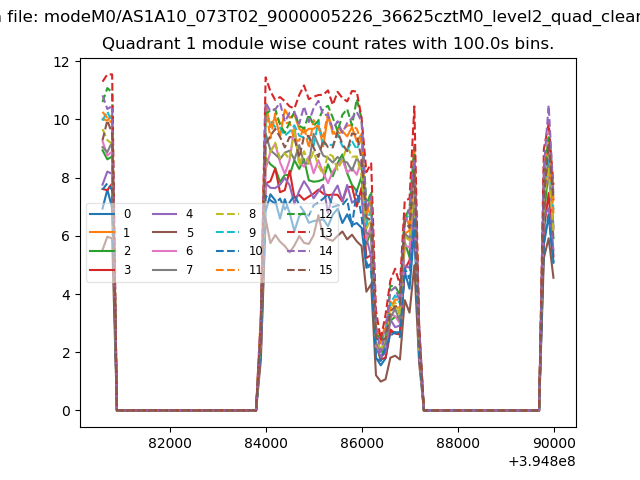
| Module-wise count rates for Quadrant A Data is divided into 100 sec bins |
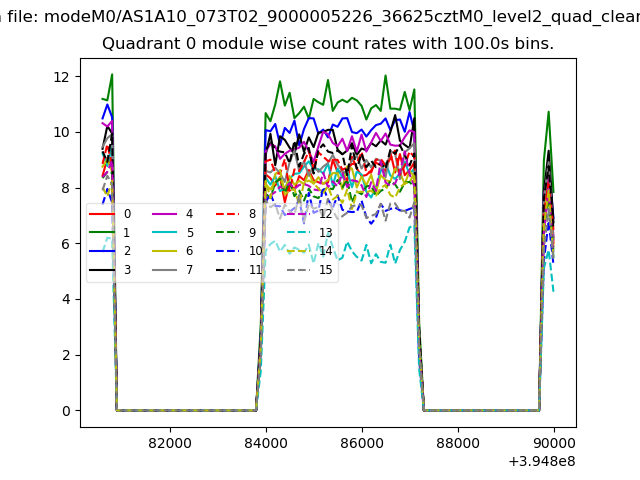 |
 |
| Module-wise count rates for Quadrant B Data is divided into 100 sec bins |
 |
 |
| Module-wise count rates for Quadrant C Data is divided into 100 sec bins |
 |
 |
| Module-wise count rates for Quadrant D Data is divided into 100 sec bins |
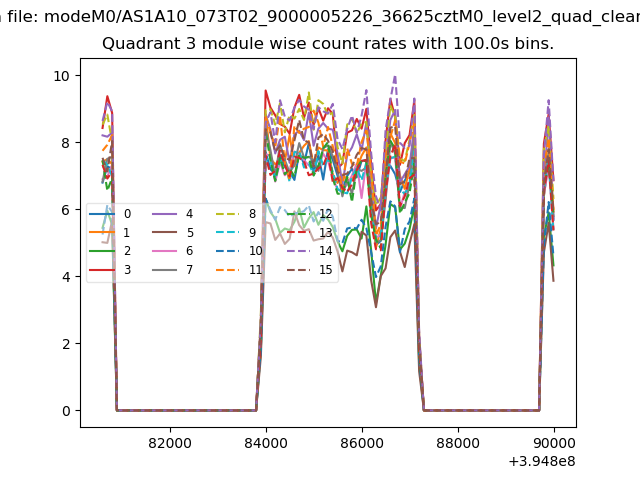 |
 |
| Parameter | Plot |
|---|---|
| CZT HV Monitor | 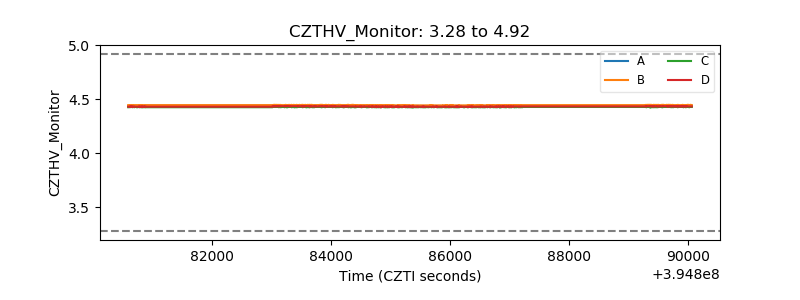 |
| D_VDD | 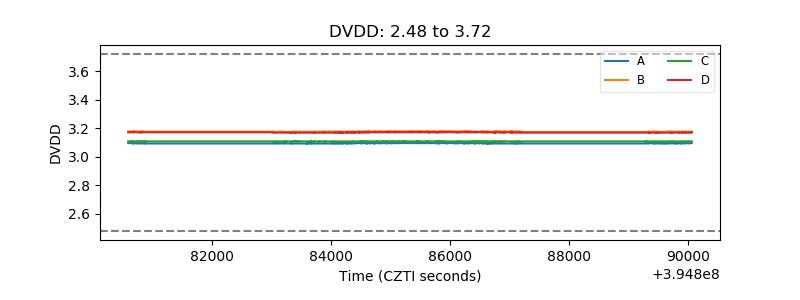 |
| Temperature 1 | 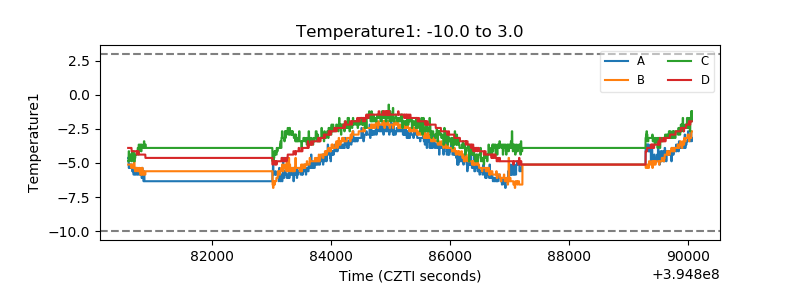 |
| Veto HV Monitor | 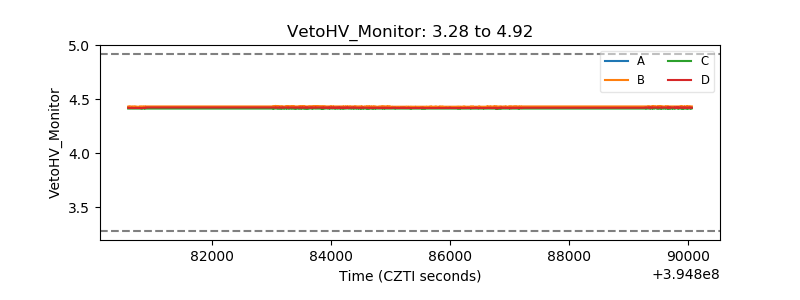 |
| Veto LLD | 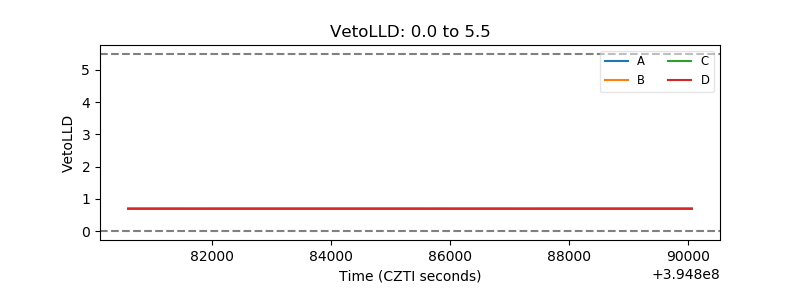 |
| Alpha Counter | 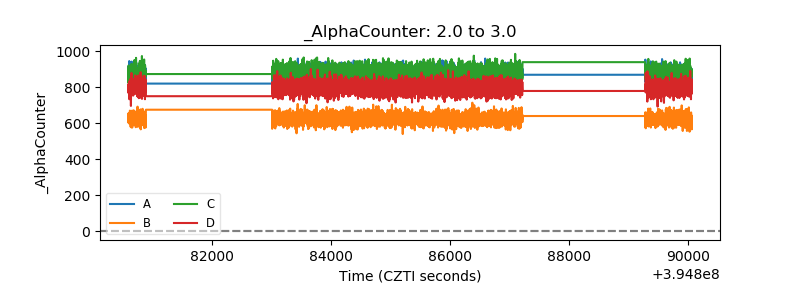 |
| _CPM_Rate | 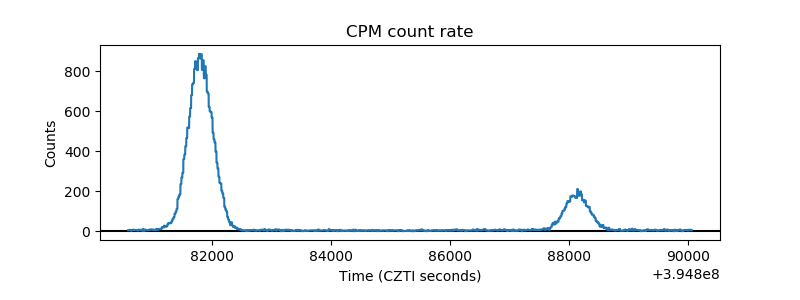 |
| CZT Counter | 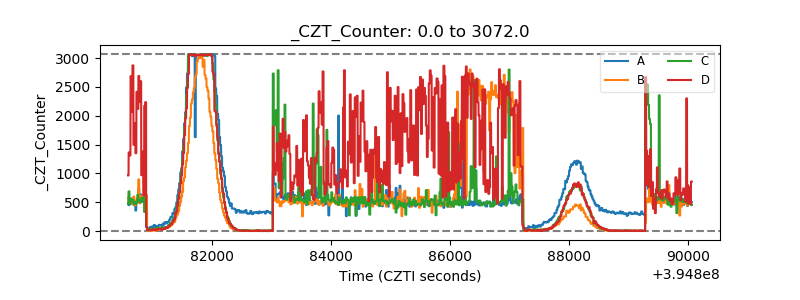 |
| +2.5 Volts monitor |  |
| +5 Volts monitor |  |
| _ROLL_ROT | 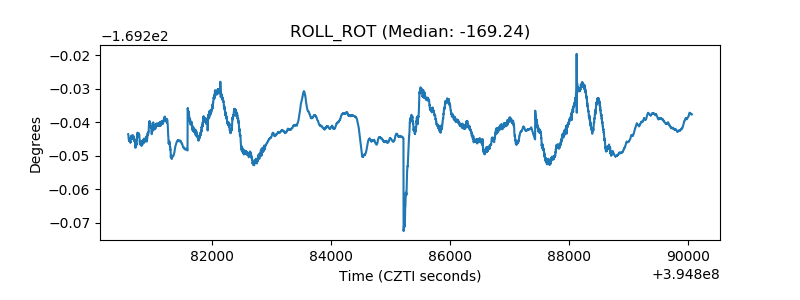 |
| _Roll_DEC | 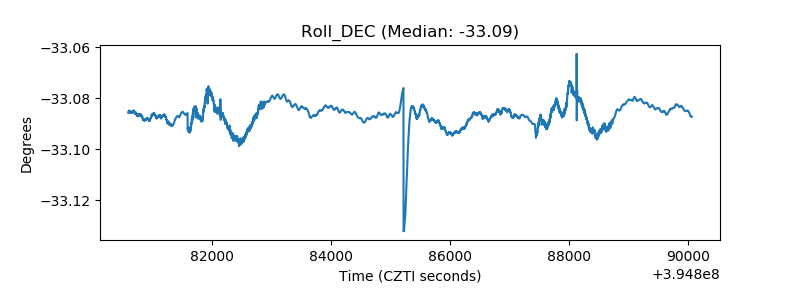 |
| _Roll_RA | 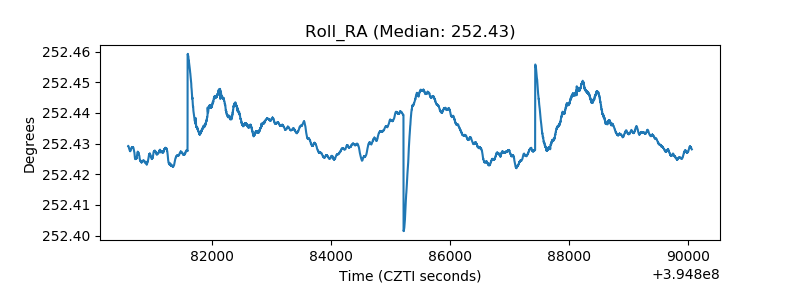 |
| Veto Counter |  |