| Param | Original file | Final file |
|---|---|---|
| Filename | modeM0/AS1A10_073T02_9000005226_36626cztM0_level2.evt | modeM0/AS1A10_073T02_9000005226_36626cztM0_level2_quad_clean.evt |
| Size (bytes) | 622,123,200 | 90,167,040 |
| Size | 593.3 MB | 86.0 MB |
| Events in quadrant A | 3,241,324 | 608,572 |
| Events in quadrant B | 4,013,092 | 600,304 |
| Events in quadrant C | 3,536,913 | 602,756 |
| Events in quadrant D | 7,668,855 | 524,090 |
| Mode SS | |||
|---|---|---|---|
| Quadrant | BADHDUFLAG | Total packets | Discarded packets |
| A | 0 | 118 | 0 |
| B | 0 | 118 | 0 |
| C | 0 | 118 | 0 |
| D | 0 | 118 | 0 |
| Mode M0 | |||
|---|---|---|---|
| Quadrant | BADHDUFLAG | Total packets | Discarded packets |
| A | 0 | 13087 | 3 |
| B | 0 | 15544 | 2 |
| C | 0 | 13860 | 2 |
| D | 0 | 26710 | 2 |
| Mode M9 | |||
|---|---|---|---|
| Quadrant | BADHDUFLAG | Total packets | Discarded packets |
| A | 0 | 38 | 0 |
| B | 0 | 38 | 0 |
| C | 0 | 38 | 0 |
| D | 0 | 38 | 0 |
| Quadrant | Total seconds | Saturated seconds | Saturation percentage |
|---|---|---|---|
| A | 5631 | 117 | 2.077784% |
| B | 5631 | 322 | 5.718345% |
| C | 5631 | 228 | 4.049014% |
| D | 5631 | 1129 | 20.049725% |
Noise dominated data is calculated using 1-second bins in cleaned event files. If a bin has >2000 counts, and if more than 50% of those come from <1% of pixels, then it is considered to be noise-dominated and hence unusable.
| Quadrant | # 1 sec bins | Bins with >0 counts | Bins with >2000 counts | High rate bins dominated by noise | Noise dominated (total time) | Noise dominated (detector-on time) | Marked lightcurve |
|---|---|---|---|---|---|---|---|
| A | 9487 | 5633 | 95 | 95 | 1.00% | 1.69% | 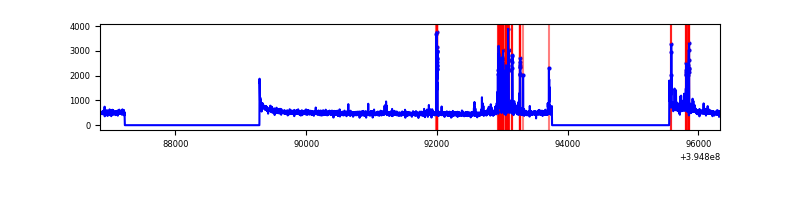 |
| B | 9487 | 5633 | 236 | 236 | 2.49% | 4.19% |  |
| C | 9487 | 5633 | 170 | 170 | 1.79% | 3.02% | 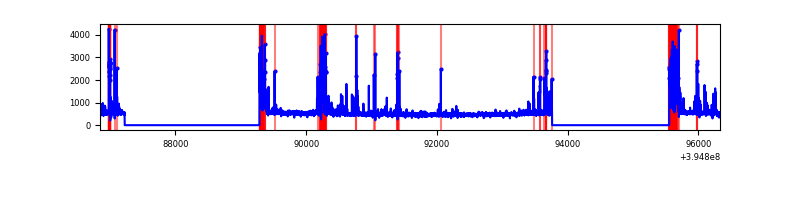 |
| D | 9487 | 5633 | 1148 | 1148 | 12.10% | 20.38% | 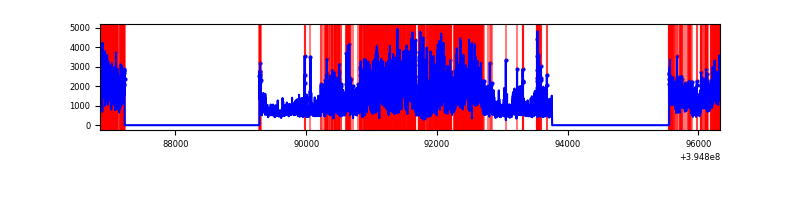 |
Top three noisy pixels from each quadrant. If the there are fewer than three noisy pixels in the level2.evt file, extra rows are filled as -1
| Pixel properties | Quadrant properties | ||||||
|---|---|---|---|---|---|---|---|
| Quadrant | DetID | PixID | Counts | Sigma | Mean | Median | Sigma |
| A | 15 | 223 | 415721 | 3089.69 | 665 | 652 | 134.3 |
| A | 10 | 83 | 213659 | 1585.58 | 665 | 652 | 134.3 |
| A | 9 | 143 | 35410 | 258.73 | 665 | 652 | 134.3 |
| B | 5 | 200 | 1166518 | 9429.75 | 647 | 631 | 123.6 |
| B | 0 | 219 | 79608 | 638.77 | 647 | 631 | 123.6 |
| B | 15 | 35 | 72518 | 581.43 | 647 | 631 | 123.6 |
| C | 0 | 10 | 398680 | 2706.53 | 632 | 636 | 147.1 |
| C | 15 | 214 | 234574 | 1590.68 | 632 | 636 | 147.1 |
| C | 12 | 249 | 155243 | 1051.26 | 632 | 636 | 147.1 |
| D | 12 | 235 | 4423586 | 29812.45 | 610 | 595 | 148.4 |
| D | 12 | 17 | 395944 | 2664.79 | 610 | 595 | 148.4 |
| D | 2 | 153 | 173795 | 1167.43 | 610 | 595 | 148.4 |
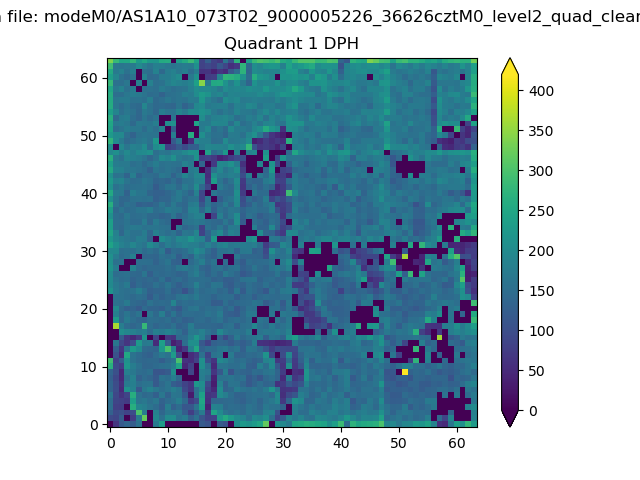
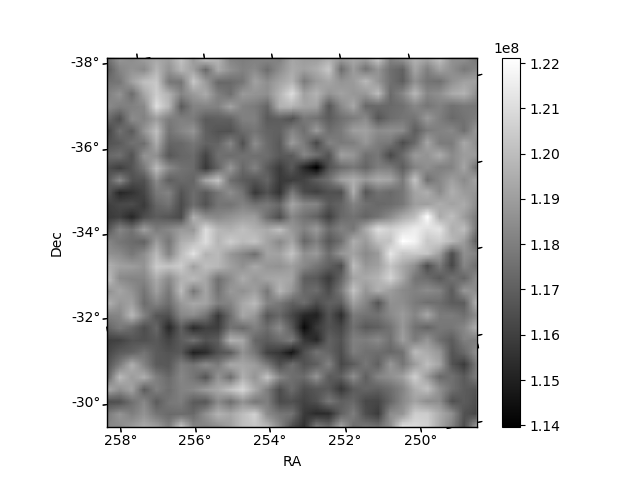
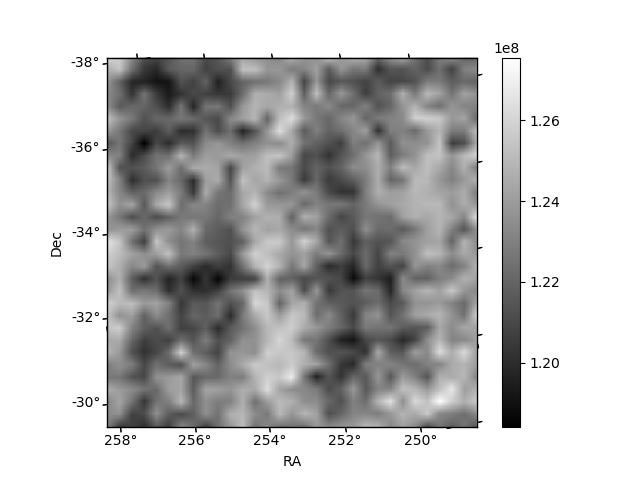
Histogram calculated using DETX and DETY for each event in the final _common_clean file
| Quadrant A | 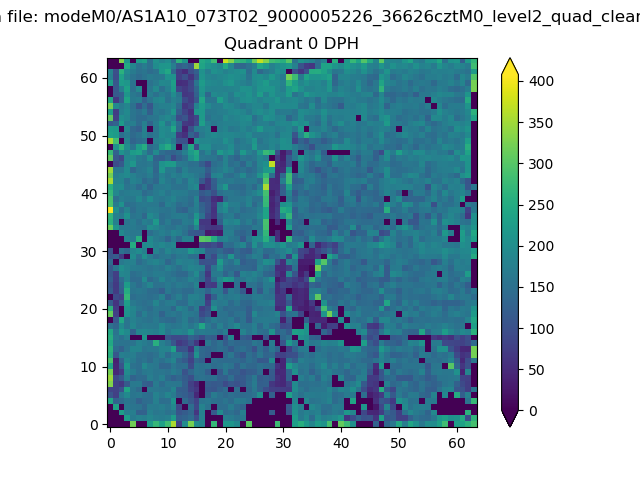 |
 |
Quadrant B |
|---|---|---|---|
| Quadrant D | 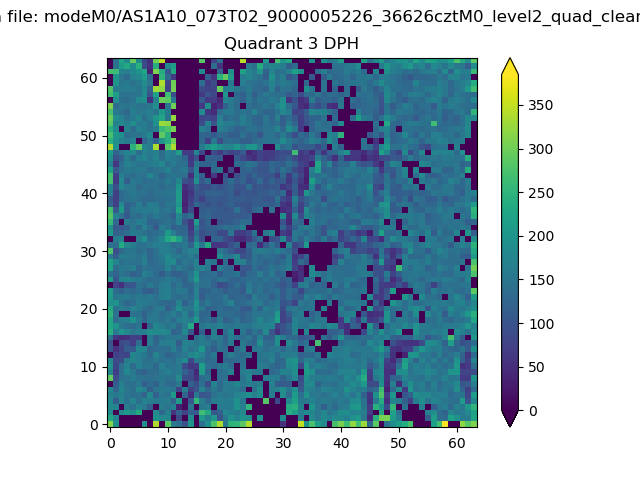 |
 |
Quadrant C |
| Plot type | Count rate plots | Images |
|---|---|---|
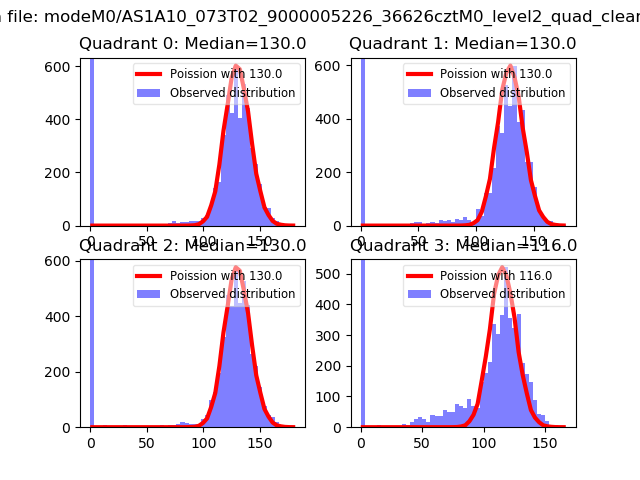
| Comparison with Poisson distribution Blue bars denote a histogram of data divided into 1 sec bins. Red curve is a Poisson curve with rate = median count rate of data. |
 |
 |
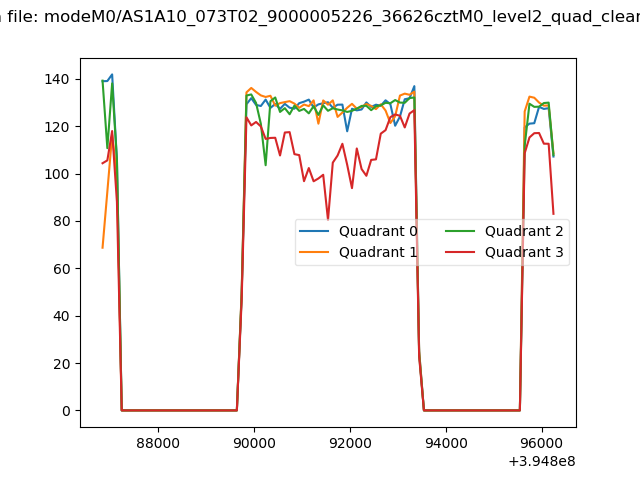
| Quadrant-wise count rates Data is divided into 100 sec bins |
 |
|
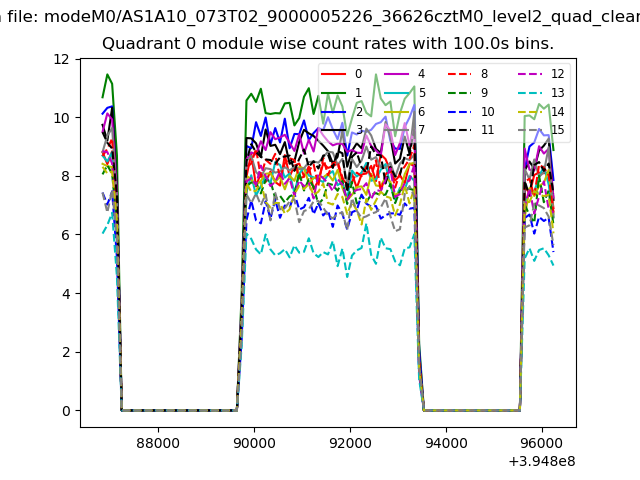
| Module-wise count rates for Quadrant A Data is divided into 100 sec bins |
 |
 |
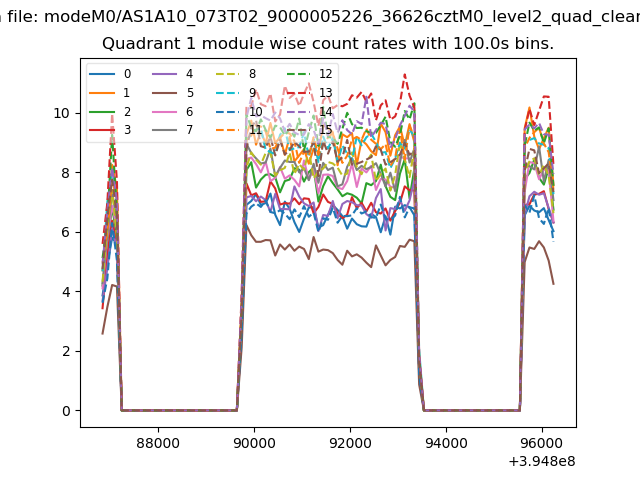
| Module-wise count rates for Quadrant B Data is divided into 100 sec bins |
 |
 |
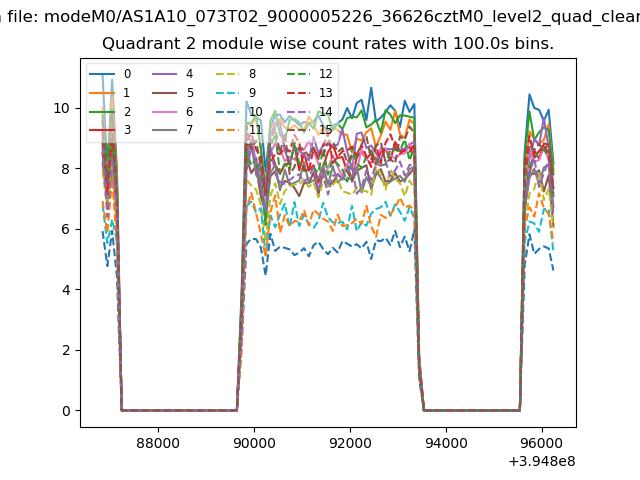
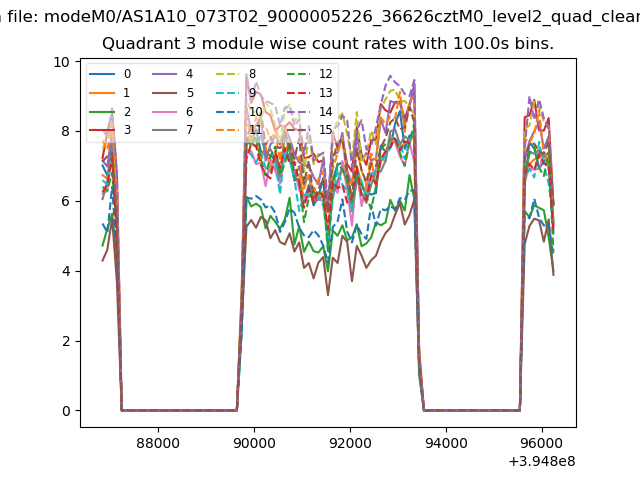
| Module-wise count rates for Quadrant C Data is divided into 100 sec bins |
 |
 |
| Module-wise count rates for Quadrant D Data is divided into 100 sec bins |
 |
 |
| Parameter | Plot |
|---|---|
| CZT HV Monitor | 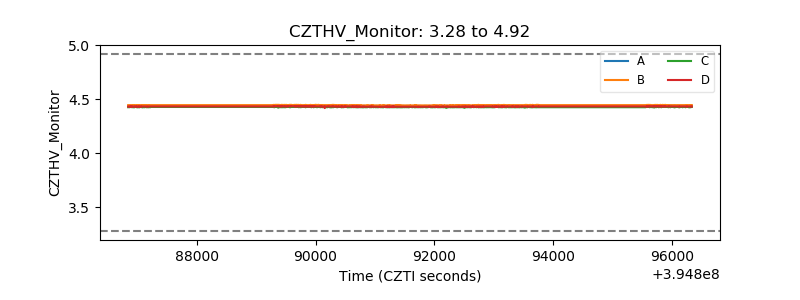 |
| D_VDD | 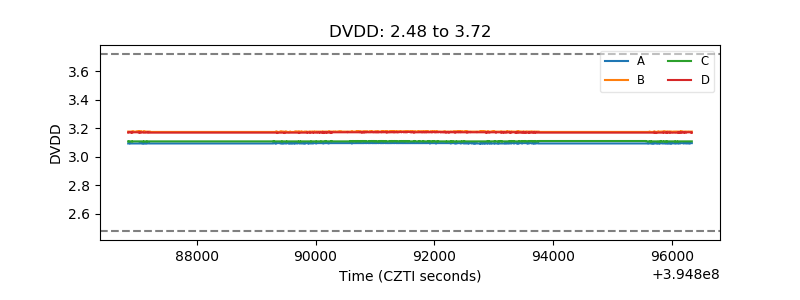 |
| Temperature 1 |  |
| Veto HV Monitor | 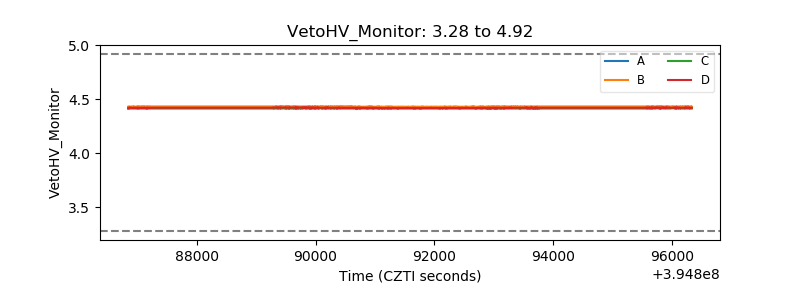 |
| Veto LLD | 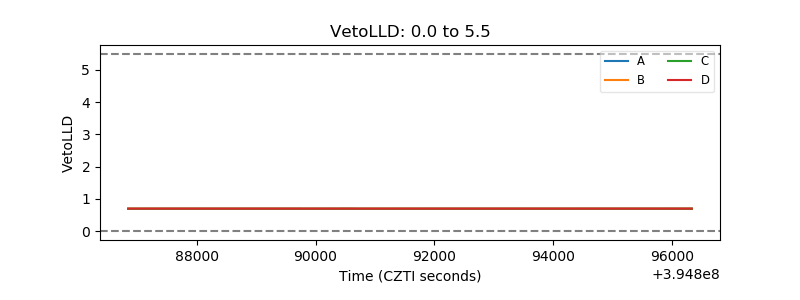 |
| Alpha Counter | 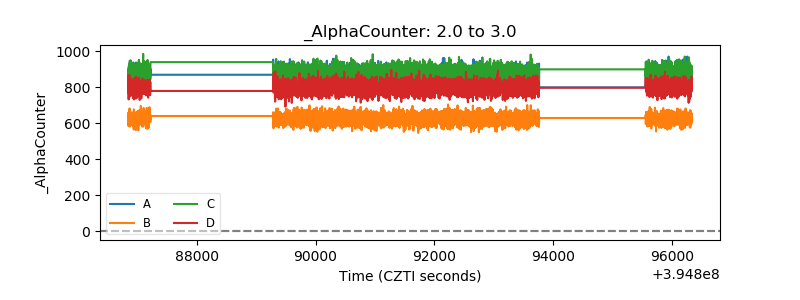 |
| _CPM_Rate | 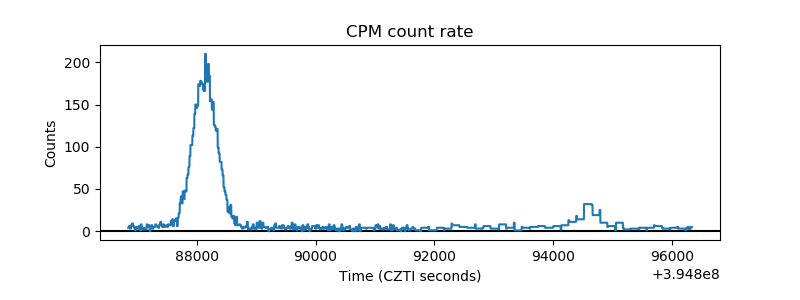 |
| CZT Counter |  |
| +2.5 Volts monitor |  |
| +5 Volts monitor |  |
| _ROLL_ROT | 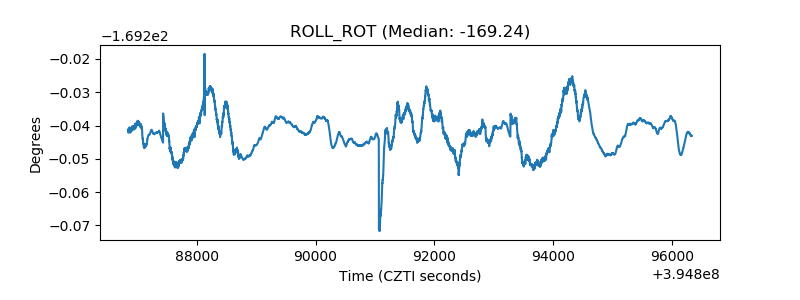 |
| _Roll_DEC | 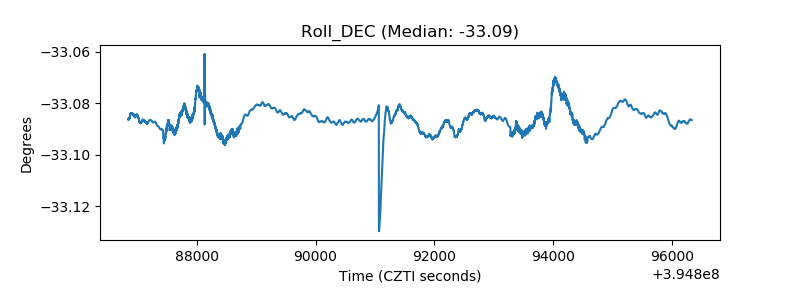 |
| _Roll_RA |  |
| Veto Counter | 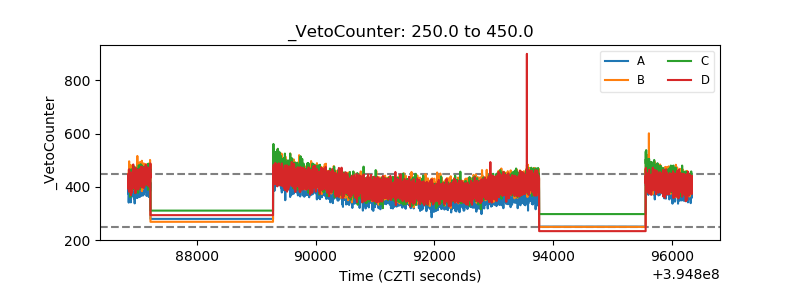 |