| Param | Original file | Final file |
|---|---|---|
| Filename | modeM0/AS1A10_073T02_9000005226_36627cztM0_level2.evt | modeM0/AS1A10_073T02_9000005226_36627cztM0_level2_quad_clean.evt |
| Size (bytes) | 380,957,760 | 47,900,160 |
| Size | 363.3 MB | 45.7 MB |
| Events in quadrant A | 1,454,608 | 347,883 |
| Events in quadrant B | 3,588,754 | 277,365 |
| Events in quadrant C | 1,514,777 | 345,986 |
| Events in quadrant D | 4,788,524 | 278,115 |
| Mode SS | |||
|---|---|---|---|
| Quadrant | BADHDUFLAG | Total packets | Discarded packets |
| A | 0 | 56 | 0 |
| B | 0 | 56 | 0 |
| C | 0 | 56 | 0 |
| D | 0 | 56 | 0 |
| Mode M0 | |||
|---|---|---|---|
| Quadrant | BADHDUFLAG | Total packets | Discarded packets |
| A | 0 | 6115 | 0 |
| B | 0 | 12639 | 0 |
| C | 0 | 6224 | 0 |
| D | 0 | 16141 | 0 |
| Quadrant | Total seconds | Saturated seconds | Saturation percentage |
|---|---|---|---|
| A | 2798 | 25 | 0.893495% |
| B | 2798 | 809 | 28.913510% |
| C | 2798 | 28 | 1.000715% |
| D | 2798 | 1067 | 38.134382% |
Noise dominated data is calculated using 1-second bins in cleaned event files. If a bin has >2000 counts, and if more than 50% of those come from <1% of pixels, then it is considered to be noise-dominated and hence unusable.
| Quadrant | # 1 sec bins | Bins with >0 counts | Bins with >2000 counts | High rate bins dominated by noise | Noise dominated (total time) | Noise dominated (detector-on time) | Marked lightcurve |
|---|---|---|---|---|---|---|---|
| A | 2798 | 2798 | 16 | 16 | 0.57% | 0.57% |  |
| B | 2798 | 2798 | 600 | 600 | 21.44% | 21.44% | 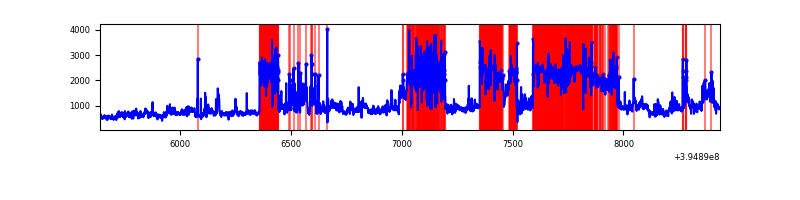 |
| C | 2798 | 2798 | 18 | 18 | 0.64% | 0.64% | 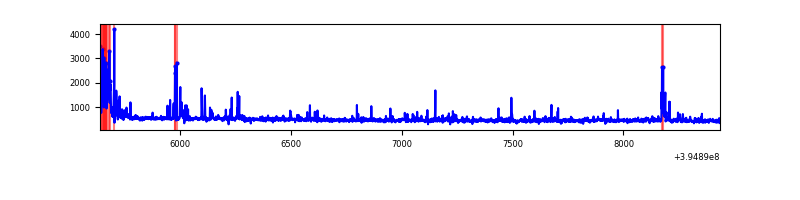 |
| D | 2798 | 2798 | 1001 | 1001 | 35.78% | 35.78% | 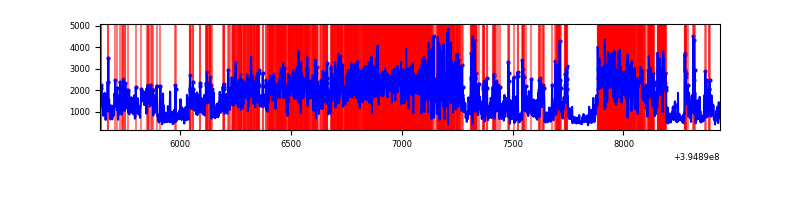 |
Top three noisy pixels from each quadrant. If the there are fewer than three noisy pixels in the level2.evt file, extra rows are filled as -1
| Pixel properties | Quadrant properties | ||||||
|---|---|---|---|---|---|---|---|
| Quadrant | DetID | PixID | Counts | Sigma | Mean | Median | Sigma |
| A | 15 | 223 | 111294 | 1671.59 | 320 | 314 | 66.4 |
| A | 10 | 83 | 83619 | 1254.74 | 320 | 314 | 66.4 |
| A | 9 | 143 | 8332 | 120.77 | 320 | 314 | 66.4 |
| B | 5 | 200 | 2335526 | 45675.16 | 257 | 250 | 51.1 |
| B | 5 | 255 | 77114 | 1503.37 | 257 | 250 | 51.1 |
| B | 15 | 85 | 63838 | 1243.7 | 257 | 250 | 51.1 |
| C | 0 | 10 | 151072 | 2092.46 | 304 | 306 | 72.1 |
| C | 15 | 214 | 118749 | 1643.85 | 304 | 306 | 72.1 |
| C | 14 | 254 | 34211 | 470.56 | 304 | 306 | 72.1 |
| D | 12 | 235 | 3008525 | 44168.88 | 273 | 265 | 68.1 |
| D | 12 | 17 | 385355 | 5654.1 | 273 | 265 | 68.1 |
| D | 13 | 249 | 148225 | 2172.43 | 273 | 265 | 68.1 |
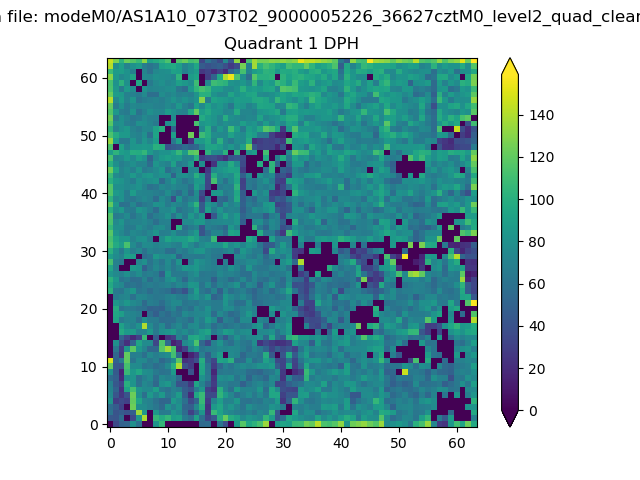
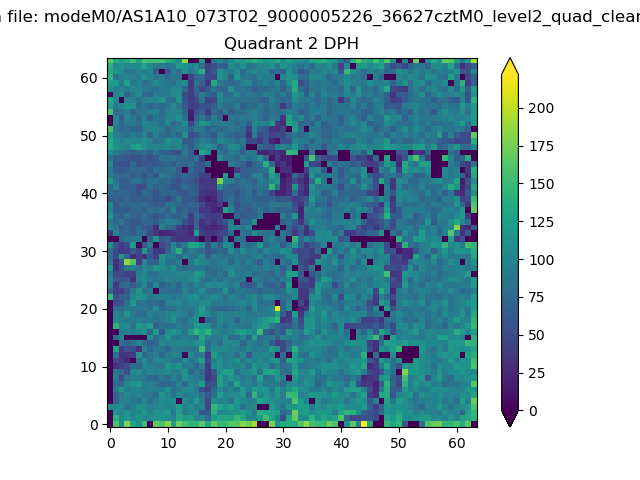
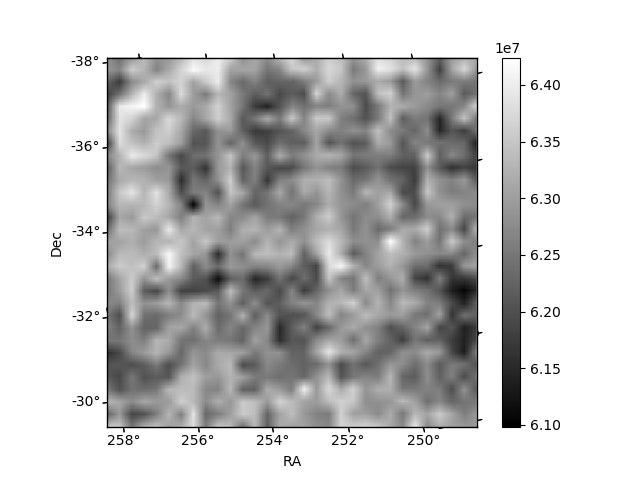
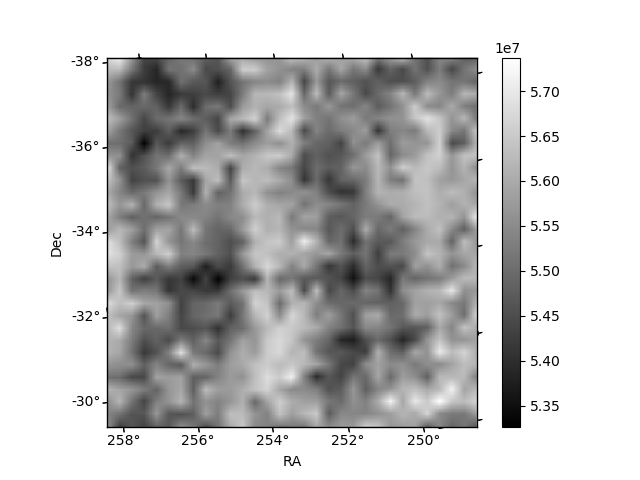
Histogram calculated using DETX and DETY for each event in the final _common_clean file
| Quadrant A |  |
 |
Quadrant B |
|---|---|---|---|
| Quadrant D | 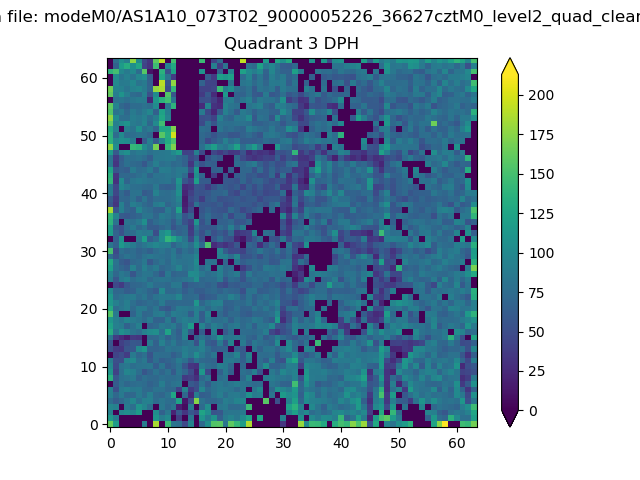 |
 |
Quadrant C |
| Plot type | Count rate plots | Images |
|---|---|---|
| Comparison with Poisson distribution Blue bars denote a histogram of data divided into 1 sec bins. Red curve is a Poisson curve with rate = median count rate of data. |
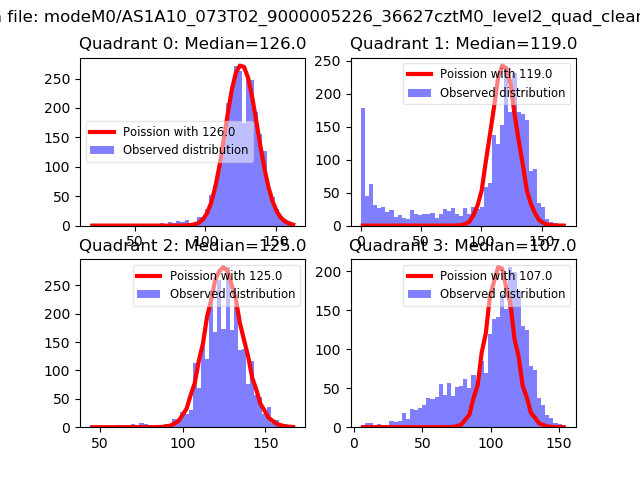 |
 |
| Quadrant-wise count rates Data is divided into 100 sec bins |
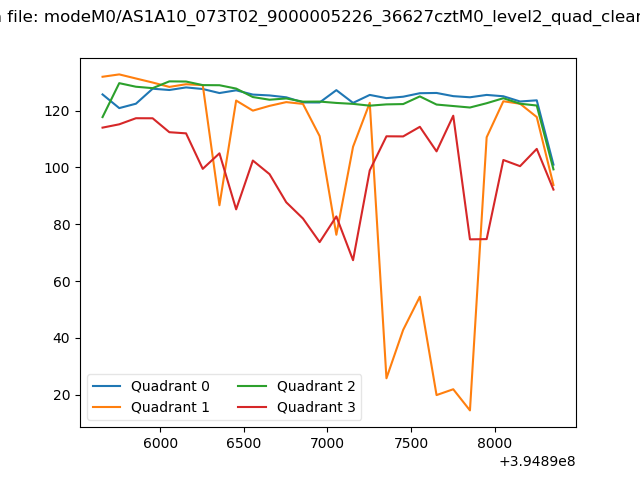 |
|
| Module-wise count rates for Quadrant A Data is divided into 100 sec bins |
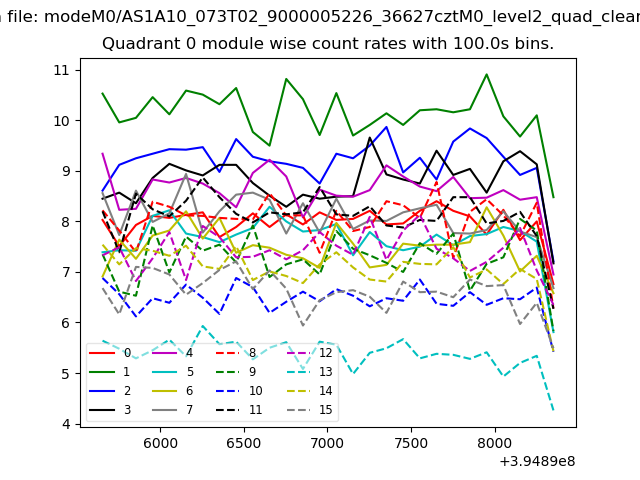 |
 |
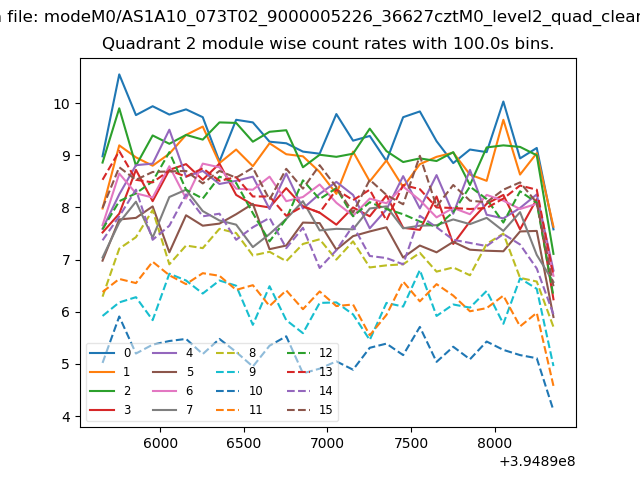
| Module-wise count rates for Quadrant B Data is divided into 100 sec bins |
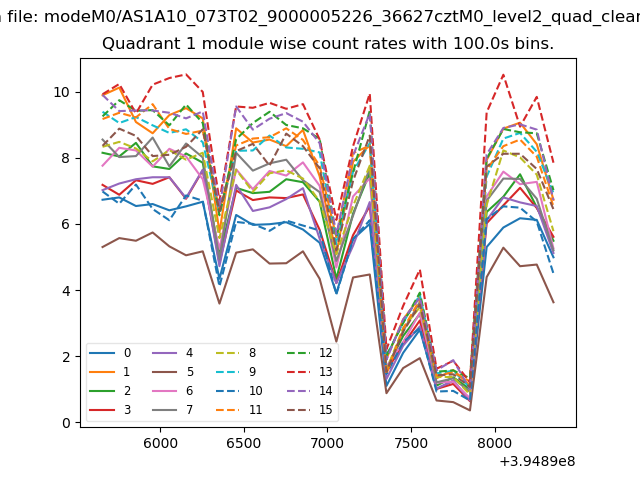 |
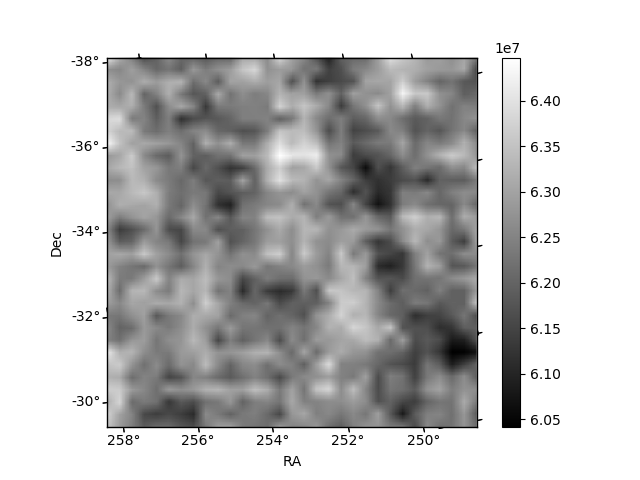 |
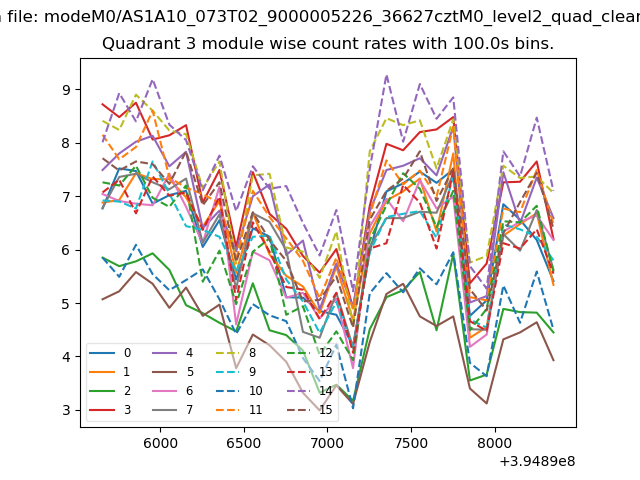
| Module-wise count rates for Quadrant C Data is divided into 100 sec bins |
 |
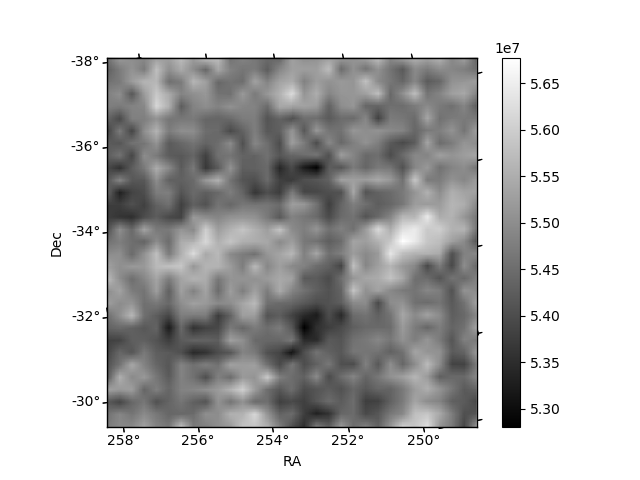 |
| Module-wise count rates for Quadrant D Data is divided into 100 sec bins |
 |
 |
| Parameter | Plot |
|---|---|
| CZT HV Monitor | 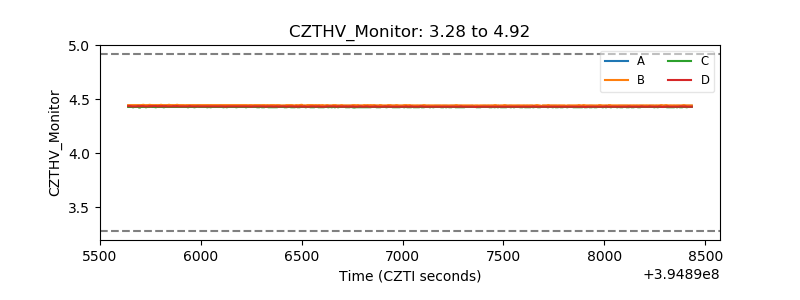 |
| D_VDD | 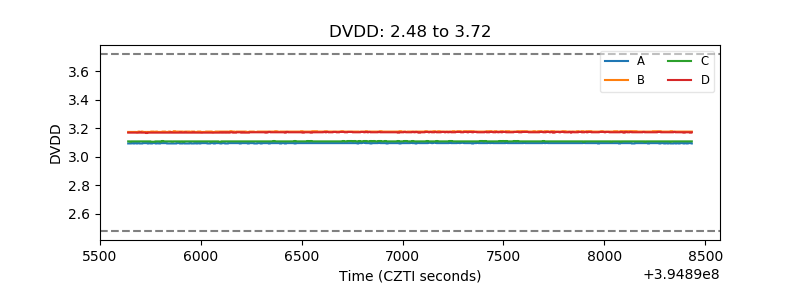 |
| Temperature 1 | 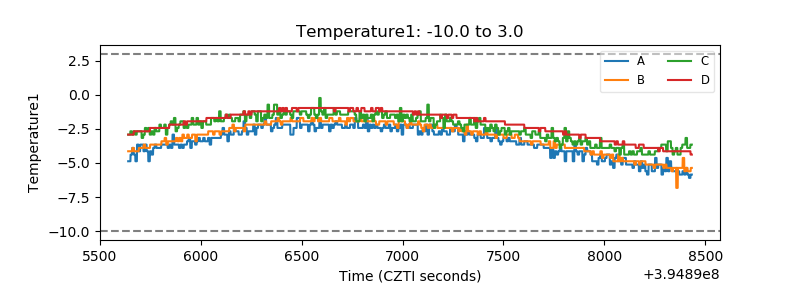 |
| Veto HV Monitor | 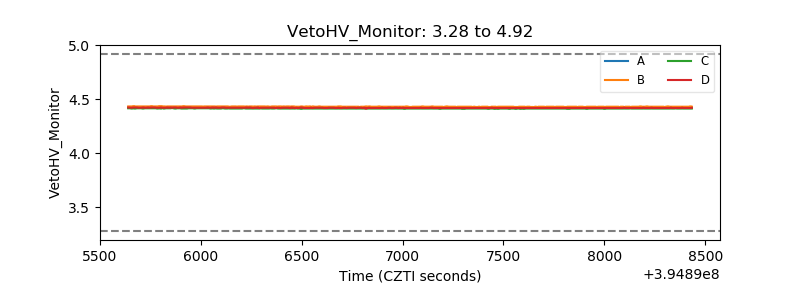 |
| Veto LLD | 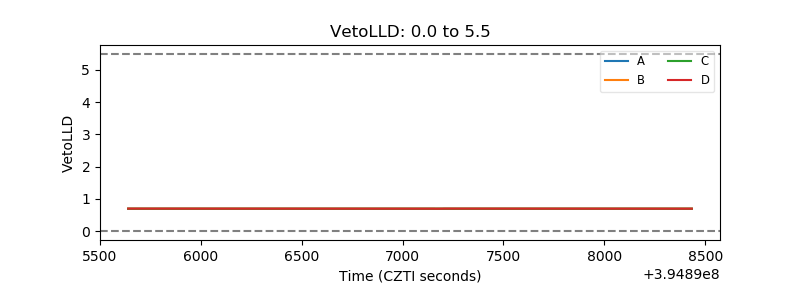 |
| Alpha Counter | 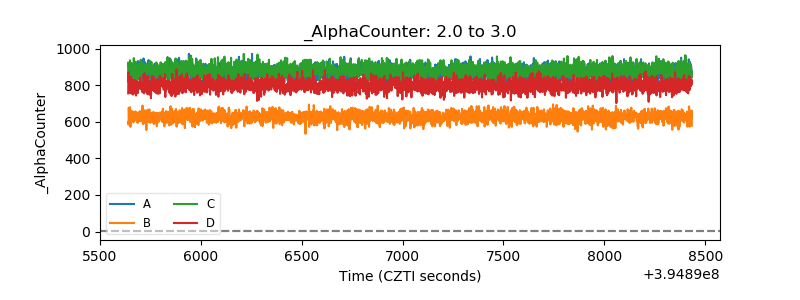 |
| _CPM_Rate | 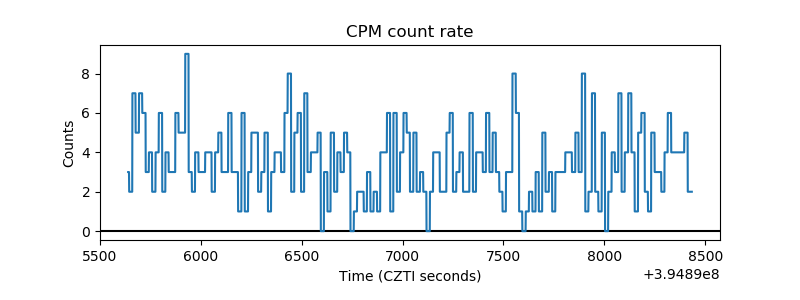 |
| CZT Counter | 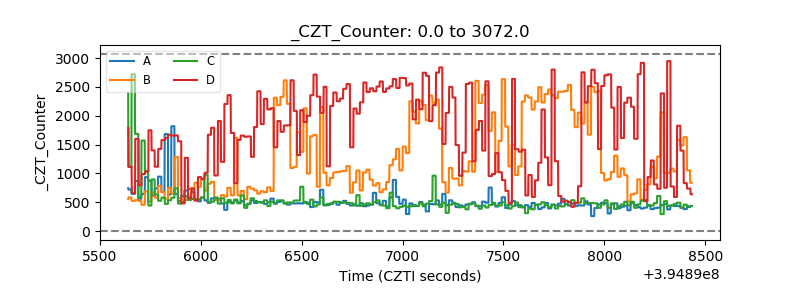 |
| +2.5 Volts monitor |  |
| +5 Volts monitor |  |
| _ROLL_ROT | 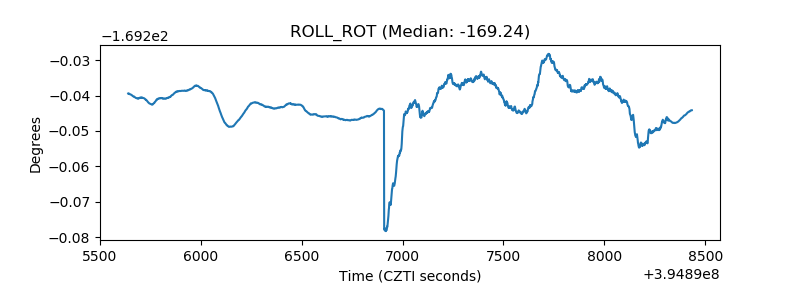 |
| _Roll_DEC | 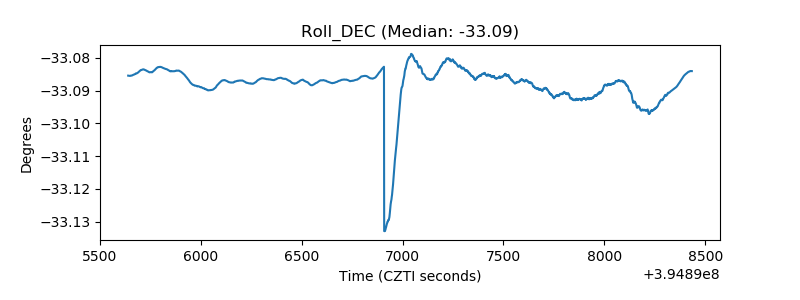 |
| _Roll_RA | 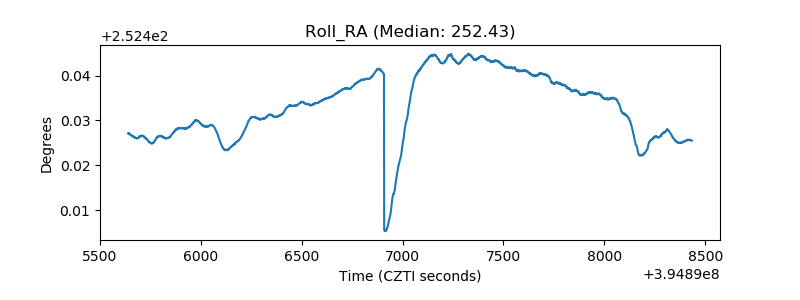 |
| Veto Counter | 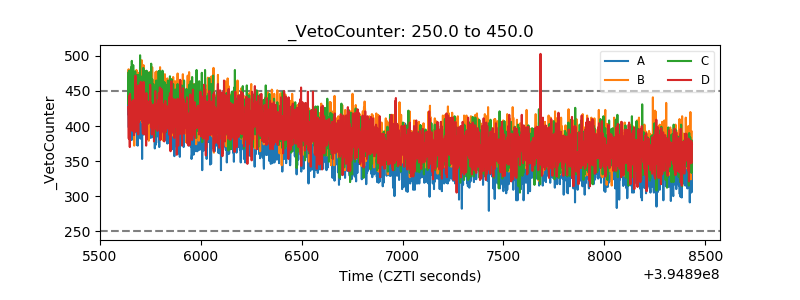 |