| Param | Original file | Final file |
|---|---|---|
| Filename | modeM0/AS1A11_049T03_9000005228_36627cztM0_level2.evt | modeM0/AS1A11_049T03_9000005228_36627cztM0_level2_quad_clean.evt |
| Size (bytes) | 310,331,520 | 19,172,160 |
| Size | 296.0 MB | 18.3 MB |
| Events in quadrant A | 1,454,507 | 120,579 |
| Events in quadrant B | 2,898,516 | 73,378 |
| Events in quadrant C | 1,496,175 | 114,655 |
| Events in quadrant D | 3,394,243 | 107,483 |
| Mode SS | |||
|---|---|---|---|
| Quadrant | BADHDUFLAG | Total packets | Discarded packets |
| A | 0 | 46 | 0 |
| B | 0 | 46 | 0 |
| C | 0 | 46 | 0 |
| D | 0 | 46 | 0 |
| Mode M9 | |||
|---|---|---|---|
| Quadrant | BADHDUFLAG | Total packets | Discarded packets |
| A | 0 | 15 | 0 |
| B | 0 | 15 | 0 |
| C | 0 | 15 | 0 |
| D | 0 | 15 | 0 |
| Mode M0 | |||
|---|---|---|---|
| Quadrant | BADHDUFLAG | Total packets | Discarded packets |
| A | 0 | 5789 | 2 |
| B | 0 | 10263 | 1 |
| C | 0 | 5932 | 1 |
| D | 0 | 11678 | 1 |
| Quadrant | Total seconds | Saturated seconds | Saturation percentage |
|---|---|---|---|
| A | 2269 | 28 | 1.234024% |
| B | 2269 | 727 | 32.040546% |
| C | 2269 | 70 | 3.085059% |
| D | 2269 | 665 | 29.308065% |
Noise dominated data is calculated using 1-second bins in cleaned event files. If a bin has >2000 counts, and if more than 50% of those come from <1% of pixels, then it is considered to be noise-dominated and hence unusable.
| Quadrant | # 1 sec bins | Bins with >0 counts | Bins with >2000 counts | High rate bins dominated by noise | Noise dominated (total time) | Noise dominated (detector-on time) | Marked lightcurve |
|---|---|---|---|---|---|---|---|
| A | 3732 | 2270 | 16 | 16 | 0.43% | 0.70% | 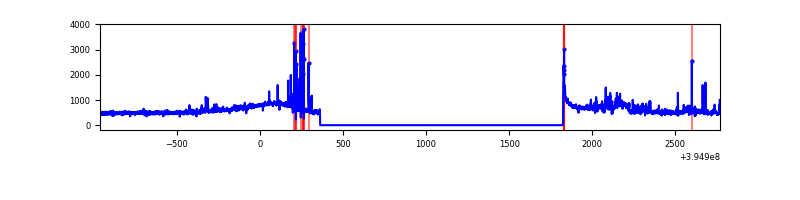 |
| B | 3731 | 2269 | 294 | 294 | 7.88% | 12.96% | 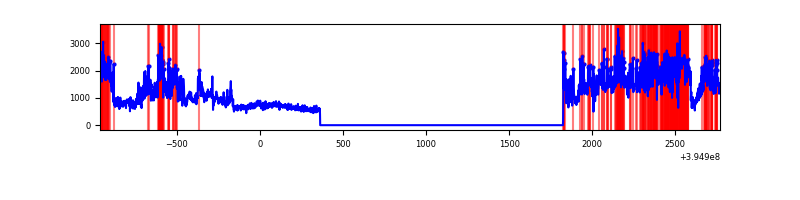 |
| C | 3732 | 2270 | 43 | 43 | 1.15% | 1.89% | 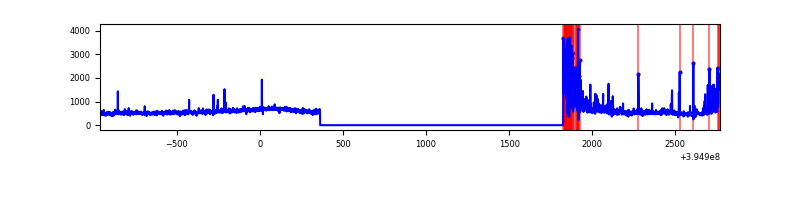 |
| D | 3732 | 2270 | 589 | 589 | 15.78% | 25.95% | 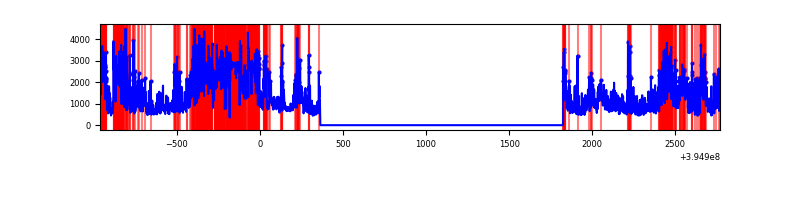 |
Top three noisy pixels from each quadrant. If the there are fewer than three noisy pixels in the level2.evt file, extra rows are filled as -1
| Pixel properties | Quadrant properties | ||||||
|---|---|---|---|---|---|---|---|
| Quadrant | DetID | PixID | Counts | Sigma | Mean | Median | Sigma |
| A | 10 | 83 | 97112 | 1480.29 | 306 | 302 | 65.4 |
| A | 15 | 223 | 78561 | 1196.63 | 306 | 302 | 65.4 |
| A | 0 | 8 | 71232 | 1084.57 | 306 | 302 | 65.4 |
| B | 5 | 200 | 1705052 | 34094.64 | 249 | 244 | 50.0 |
| B | 5 | 255 | 74771 | 1490.47 | 249 | 244 | 50.0 |
| B | 0 | 219 | 39285 | 780.79 | 249 | 244 | 50.0 |
| C | 0 | 10 | 239568 | 3501.27 | 281 | 283 | 68.3 |
| C | 15 | 214 | 96770 | 1411.82 | 281 | 283 | 68.3 |
| C | 14 | 254 | 54880 | 798.88 | 281 | 283 | 68.3 |
| D | 12 | 17 | 1169785 | 17688.0 | 252 | 245 | 66.1 |
| D | 12 | 235 | 1093459 | 16533.65 | 252 | 245 | 66.1 |
| D | 13 | 171 | 29826 | 447.38 | 252 | 245 | 66.1 |
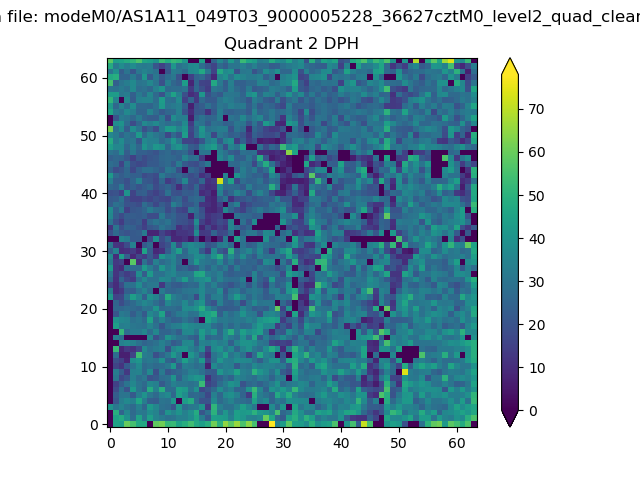
Histogram calculated using DETX and DETY for each event in the final _common_clean file
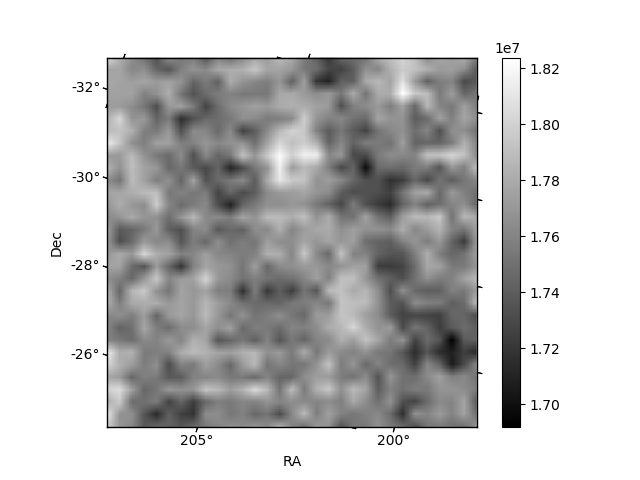
| Quadrant A | 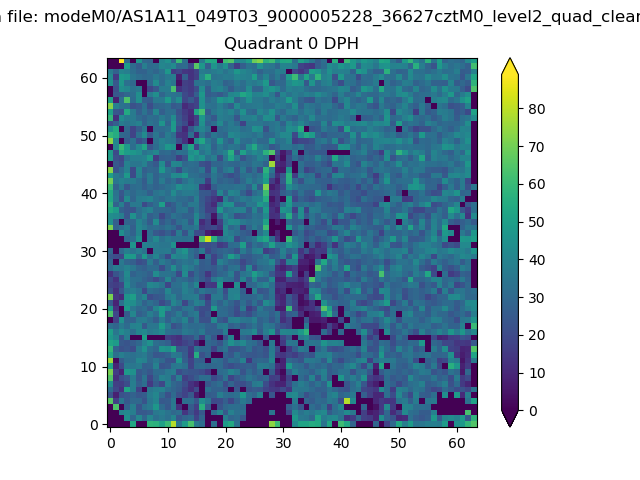 |
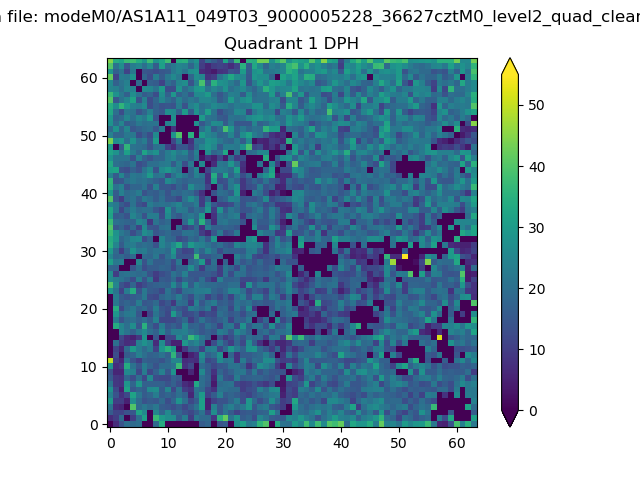 |
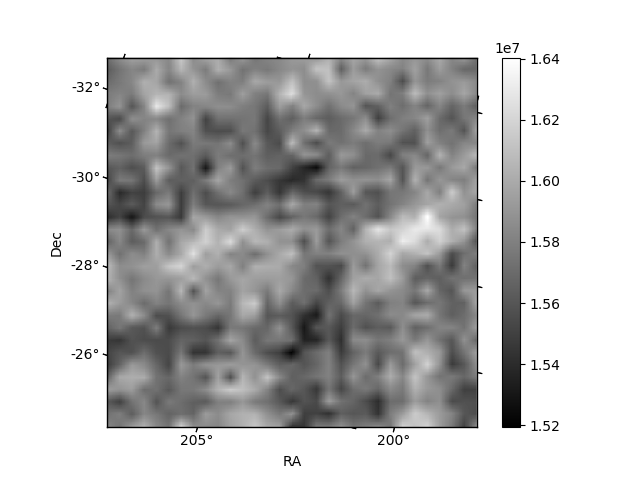
Quadrant B |
|---|---|---|---|
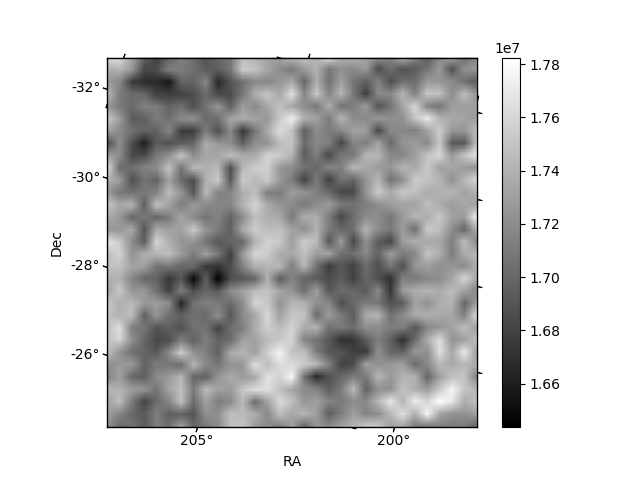
| Quadrant D | 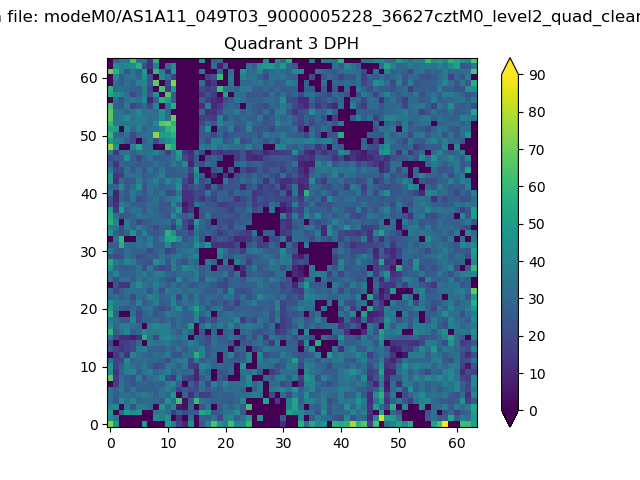 |
 |
Quadrant C |
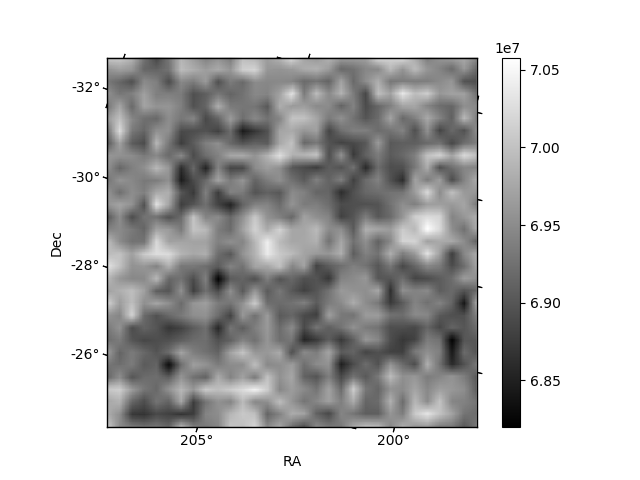
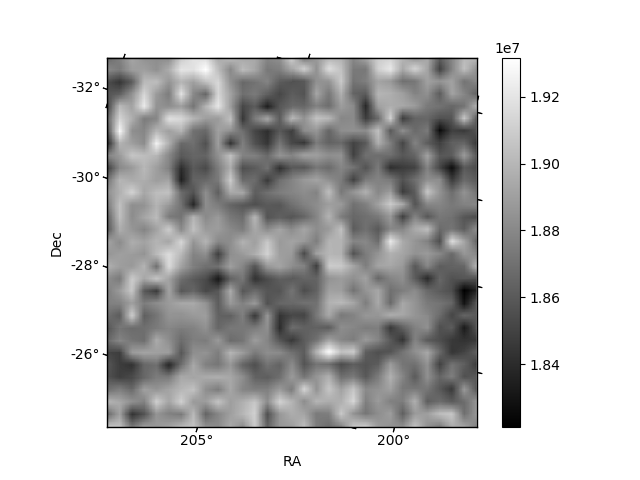
| Plot type | Count rate plots | Images |
|---|---|---|
| Comparison with Poisson distribution Blue bars denote a histogram of data divided into 1 sec bins. Red curve is a Poisson curve with rate = median count rate of data. |
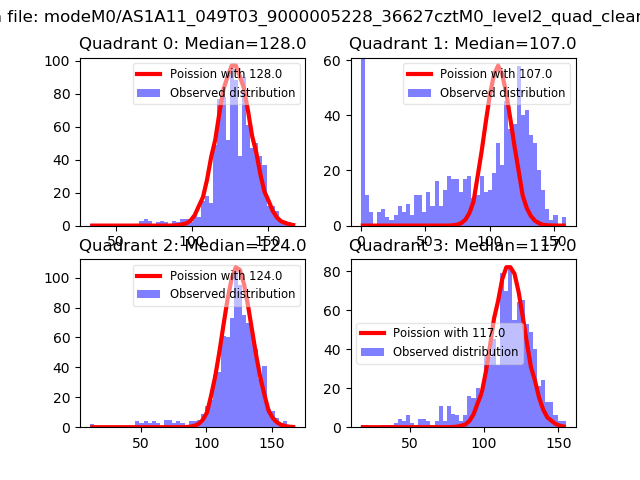 |
 |
| Quadrant-wise count rates Data is divided into 100 sec bins |
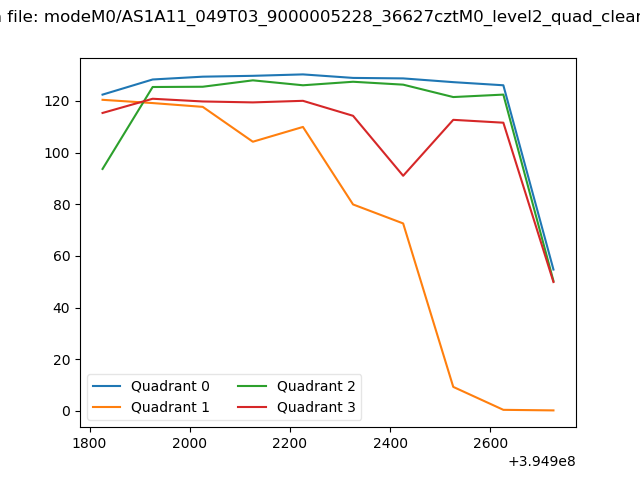 |
|
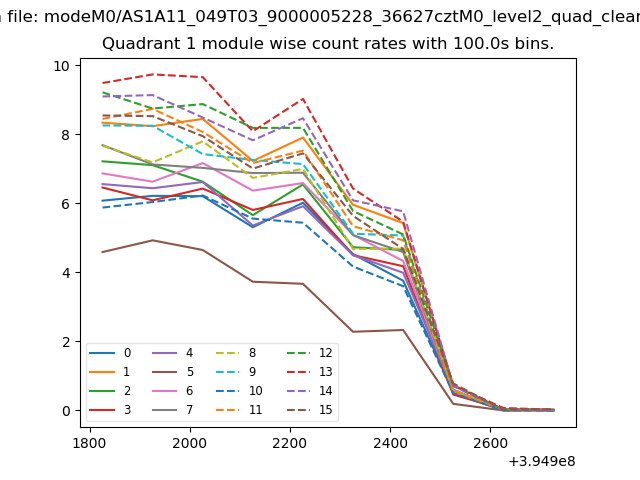
| Module-wise count rates for Quadrant A Data is divided into 100 sec bins |
 |
 |
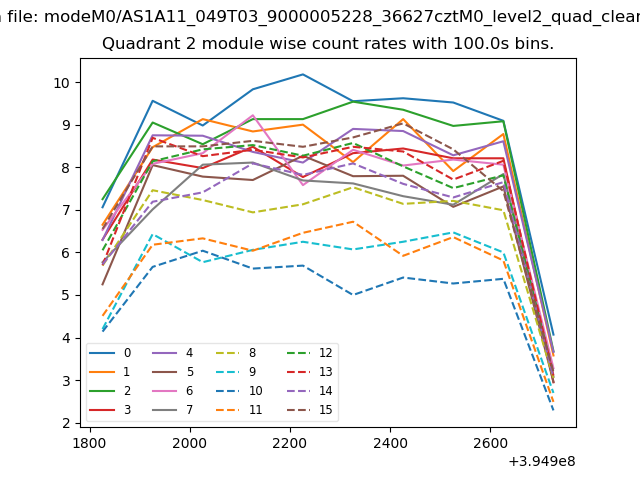
| Module-wise count rates for Quadrant B Data is divided into 100 sec bins |
 |
 |
| Module-wise count rates for Quadrant C Data is divided into 100 sec bins |
 |
 |
| Module-wise count rates for Quadrant D Data is divided into 100 sec bins |
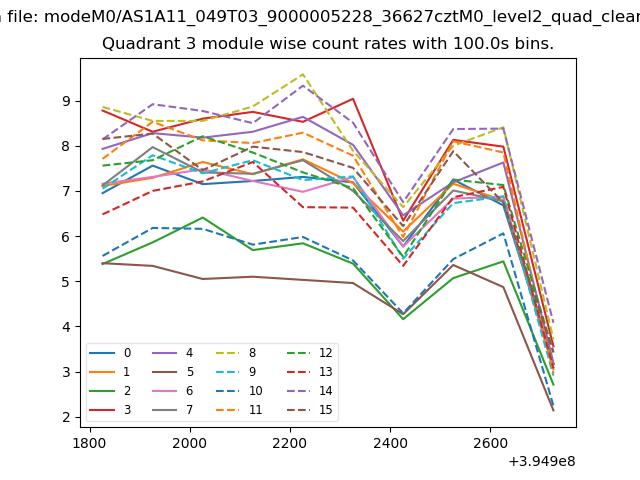 |
 |
| Parameter | Plot |
|---|---|
| CZT HV Monitor |  |
| D_VDD | 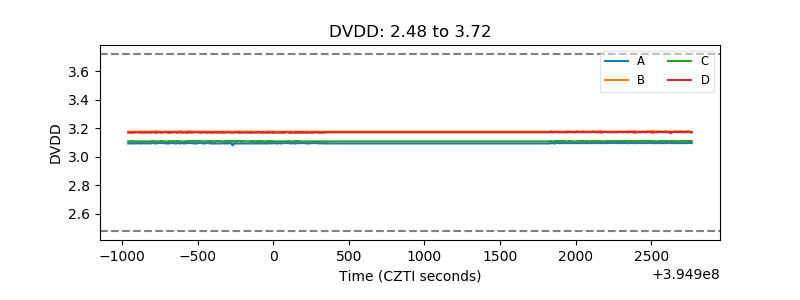 |
| Temperature 1 | 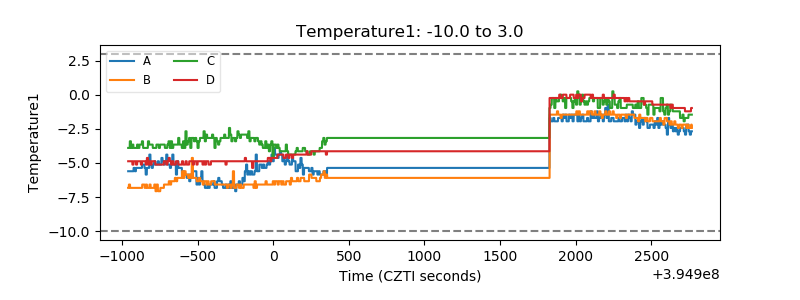 |
| Veto HV Monitor | 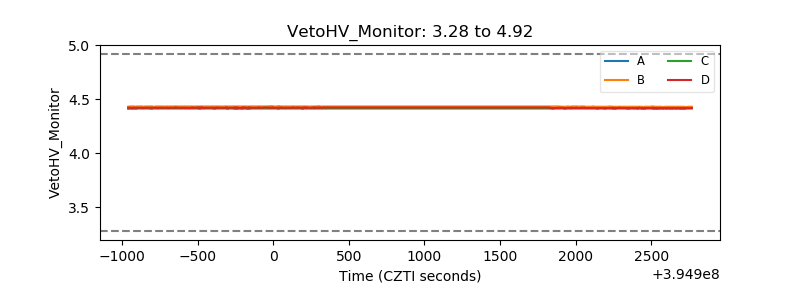 |
| Veto LLD | 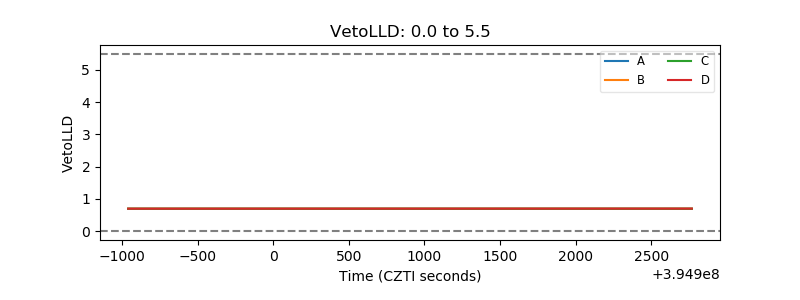 |
| Alpha Counter | 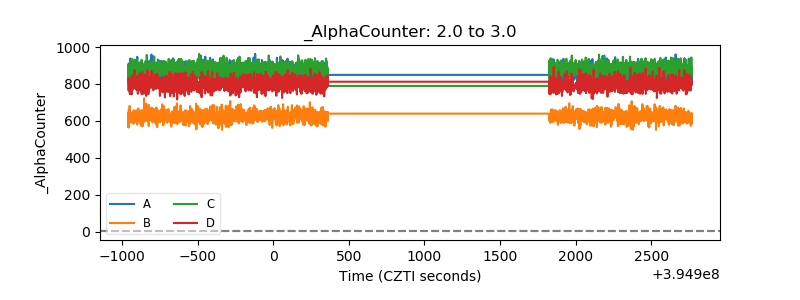 |
| _CPM_Rate | 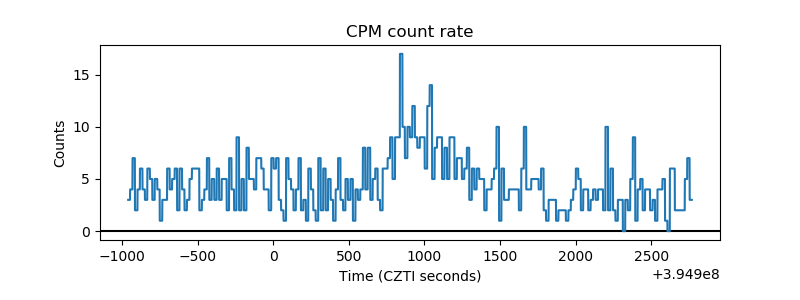 |
| CZT Counter | 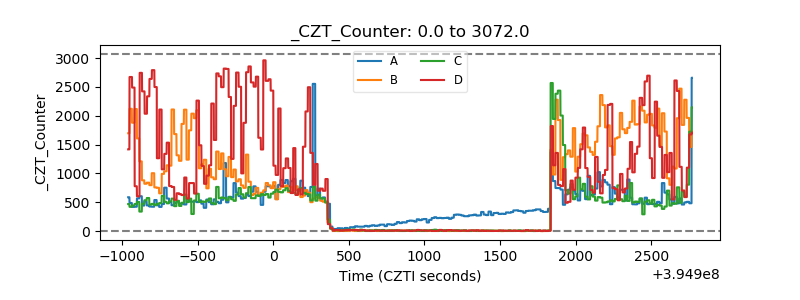 |
| +2.5 Volts monitor |  |
| +5 Volts monitor |  |
| _ROLL_ROT | 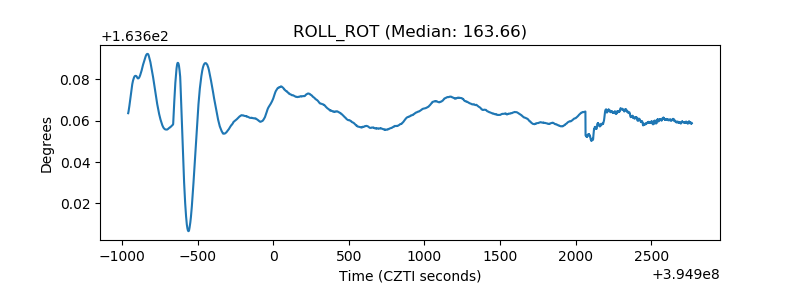 |
| _Roll_DEC | 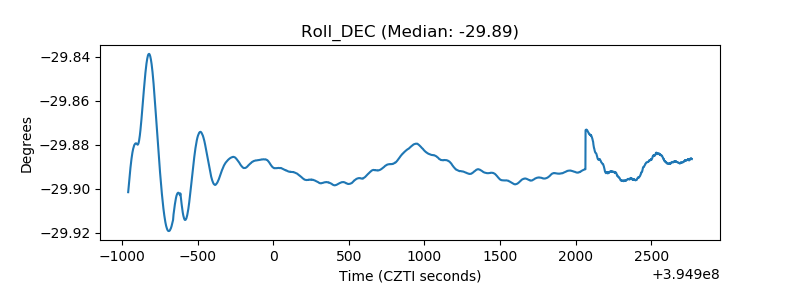 |
| _Roll_RA | 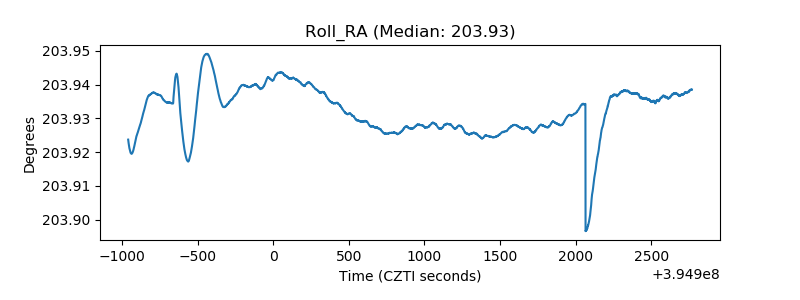 |
| Veto Counter | 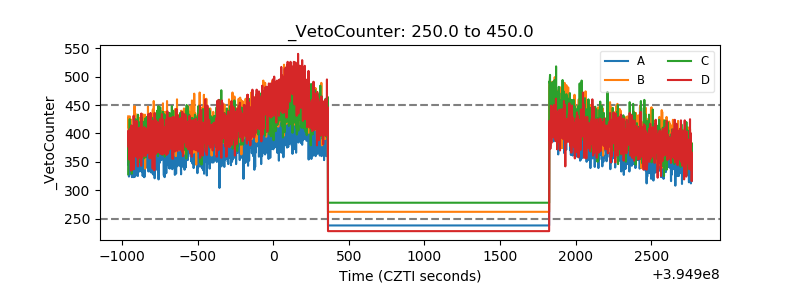 |