| Param | Original file | Final file |
|---|---|---|
| Filename | modeM0/AS1A11_049T03_9000005228_36628cztM0_level2.evt | modeM0/AS1A11_049T03_9000005228_36628cztM0_level2_quad_clean.evt |
| Size (bytes) | 971,040,960 | 65,620,800 |
| Size | 926.1 MB | 62.6 MB |
| Events in quadrant A | 3,309,381 | 468,192 |
| Events in quadrant B | 10,428,533 | 286,933 |
| Events in quadrant C | 8,194,557 | 418,595 |
| Events in quadrant D | 7,077,483 | 397,241 |
| Mode SS | |||
|---|---|---|---|
| Quadrant | BADHDUFLAG | Total packets | Discarded packets |
| A | 0 | 120 | 0 |
| B | 0 | 120 | 0 |
| C | 0 | 120 | 0 |
| D | 0 | 120 | 0 |
| Mode M9 | |||
|---|---|---|---|
| Quadrant | BADHDUFLAG | Total packets | Discarded packets |
| A | 0 | 19 | 0 |
| B | 0 | 19 | 0 |
| C | 0 | 19 | 0 |
| D | 0 | 20 | 0 |
| Mode M0 | |||
|---|---|---|---|
| Quadrant | BADHDUFLAG | Total packets | Discarded packets |
| A | 0 | 13665 | 3 |
| B | 0 | 35095 | 2 |
| C | 0 | 28357 | 2 |
| D | 0 | 25122 | 2 |
| Quadrant | Total seconds | Saturated seconds | Saturation percentage |
|---|---|---|---|
| A | 5929 | 67 | 1.130039% |
| B | 5929 | 3234 | 54.545455% |
| C | 5929 | 2016 | 34.002361% |
| D | 5929 | 993 | 16.748187% |
Noise dominated data is calculated using 1-second bins in cleaned event files. If a bin has >2000 counts, and if more than 50% of those come from <1% of pixels, then it is considered to be noise-dominated and hence unusable.
| Quadrant | # 1 sec bins | Bins with >0 counts | Bins with >2000 counts | High rate bins dominated by noise | Noise dominated (total time) | Noise dominated (detector-on time) | Marked lightcurve |
|---|---|---|---|---|---|---|---|
| A | 7242 | 5930 | 43 | 43 | 0.59% | 0.73% | 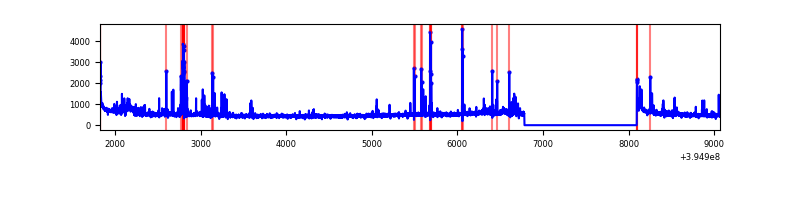 |
| B | 7242 | 5930 | 2340 | 2340 | 32.31% | 39.46% | 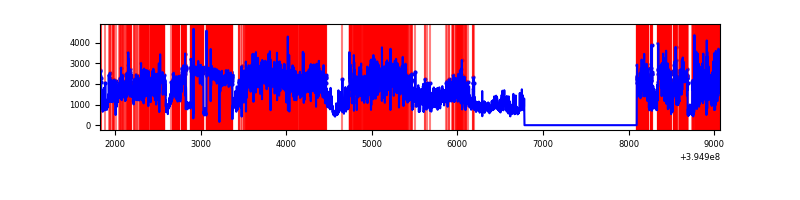 |
| C | 7242 | 5930 | 1481 | 1481 | 20.45% | 24.97% | 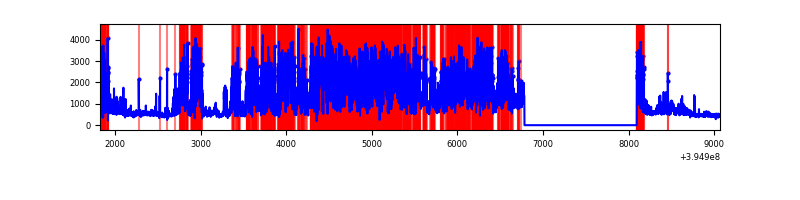 |
| D | 7242 | 5930 | 895 | 895 | 12.36% | 15.09% | 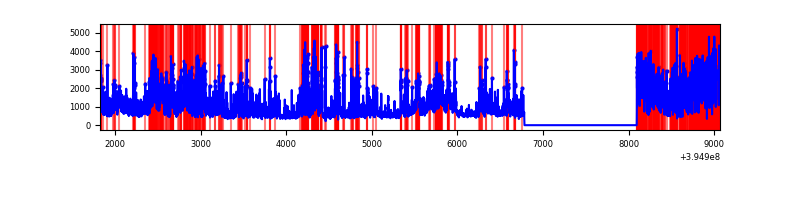 |
Top three noisy pixels from each quadrant. If the there are fewer than three noisy pixels in the level2.evt file, extra rows are filled as -1
| Pixel properties | Quadrant properties | ||||||
|---|---|---|---|---|---|---|---|
| Quadrant | DetID | PixID | Counts | Sigma | Mean | Median | Sigma |
| A | 15 | 223 | 244236 | 1744.17 | 688 | 673 | 139.6 |
| A | 10 | 83 | 232936 | 1663.25 | 688 | 673 | 139.6 |
| A | 0 | 8 | 76568 | 543.49 | 688 | 673 | 139.6 |
| B | 5 | 200 | 7989844 | 81555.6 | 507 | 495 | 98.0 |
| B | 5 | 255 | 121165 | 1231.8 | 507 | 495 | 98.0 |
| B | 0 | 219 | 89655 | 910.15 | 507 | 495 | 98.0 |
| C | 14 | 254 | 5249429 | 39109.75 | 575 | 578 | 134.2 |
| C | 0 | 10 | 402121 | 2991.94 | 575 | 578 | 134.2 |
| C | 15 | 214 | 225965 | 1679.38 | 575 | 578 | 134.2 |
| D | 12 | 235 | 3124574 | 19938.74 | 628 | 610 | 156.7 |
| D | 12 | 17 | 383074 | 2441.08 | 628 | 610 | 156.7 |
| D | 2 | 250 | 381423 | 2430.54 | 628 | 610 | 156.7 |
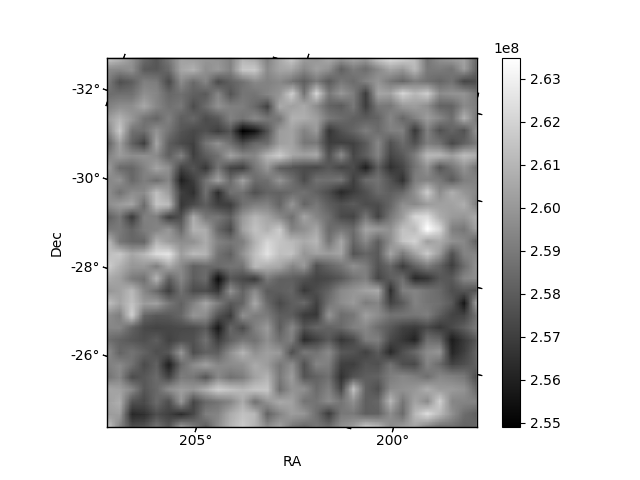
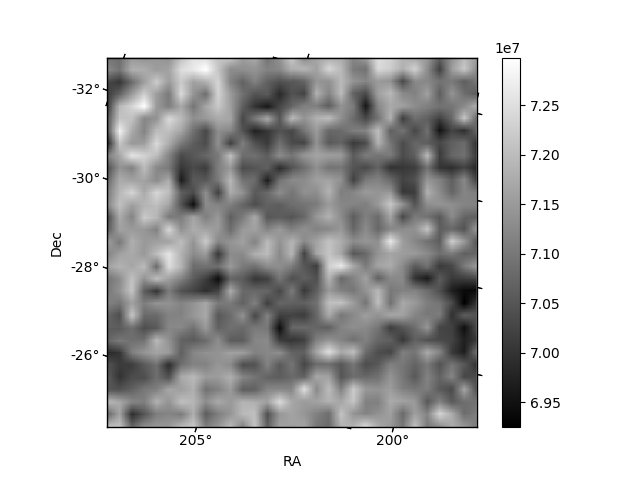
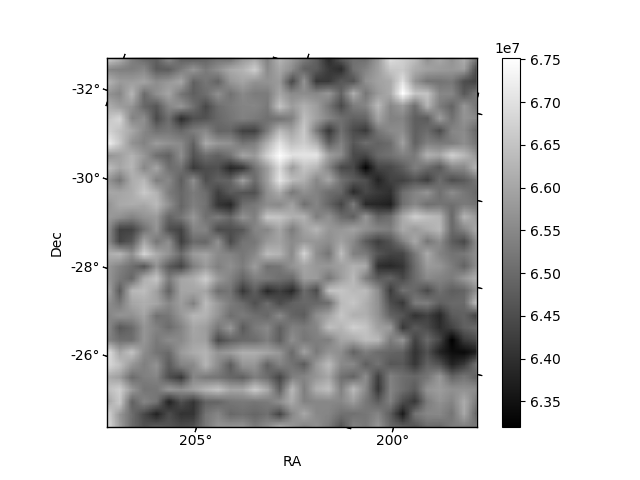
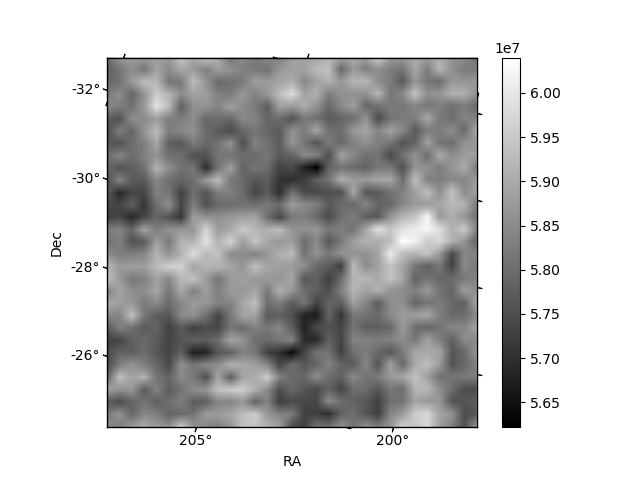
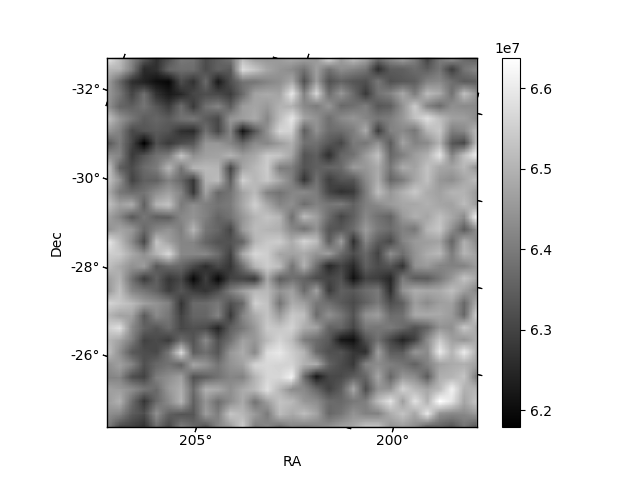
Histogram calculated using DETX and DETY for each event in the final _common_clean file
| Quadrant A | 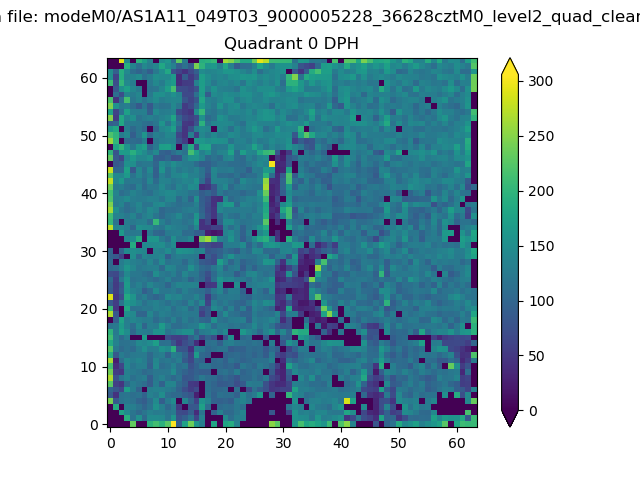 |
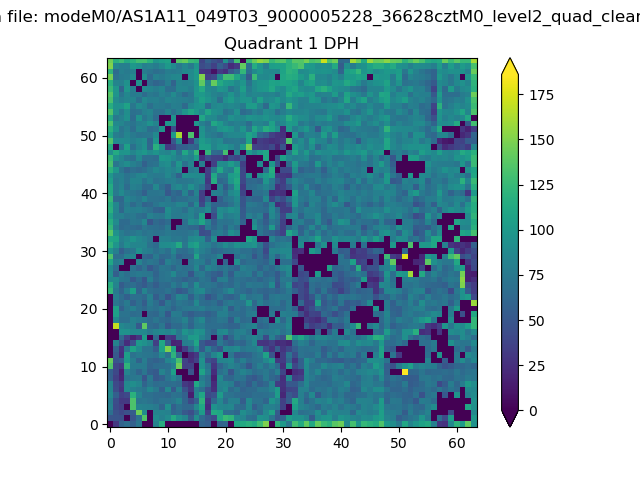 |
Quadrant B |
|---|---|---|---|
| Quadrant D |  |
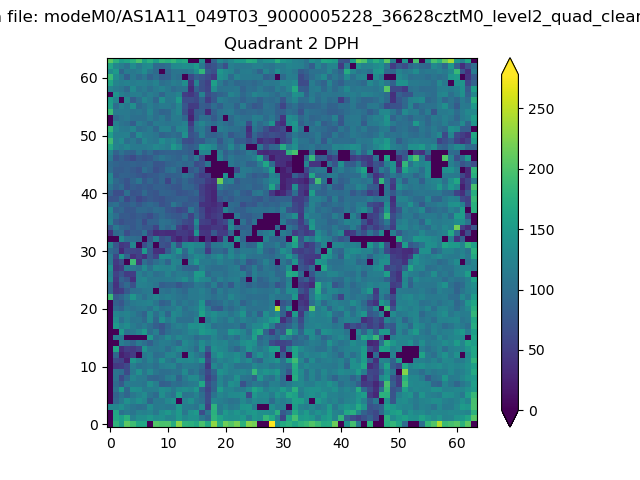 |
Quadrant C |
| Plot type | Count rate plots | Images |
|---|---|---|
| Comparison with Poisson distribution Blue bars denote a histogram of data divided into 1 sec bins. Red curve is a Poisson curve with rate = median count rate of data. |
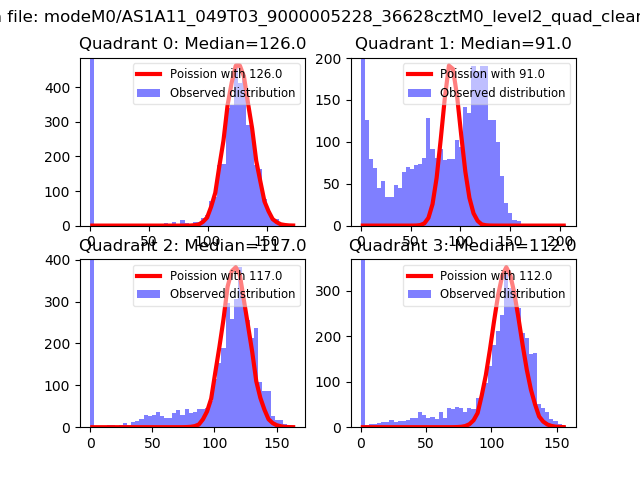 |
 |
| Quadrant-wise count rates Data is divided into 100 sec bins |
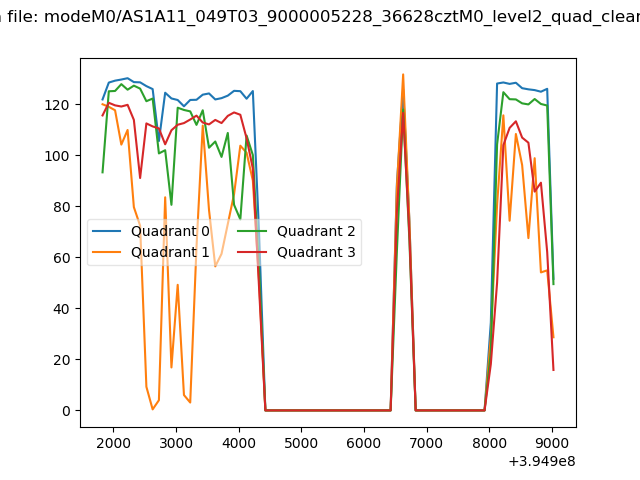 |
|
| Module-wise count rates for Quadrant A Data is divided into 100 sec bins |
 |
 |
| Module-wise count rates for Quadrant B Data is divided into 100 sec bins |
 |
 |
| Module-wise count rates for Quadrant C Data is divided into 100 sec bins |
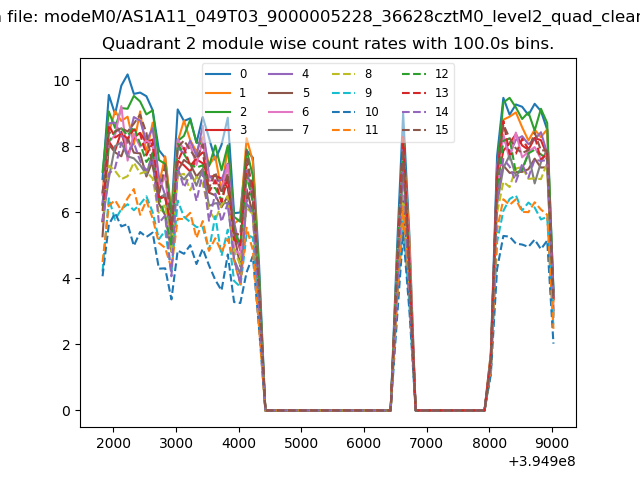 |
 |
| Module-wise count rates for Quadrant D Data is divided into 100 sec bins |
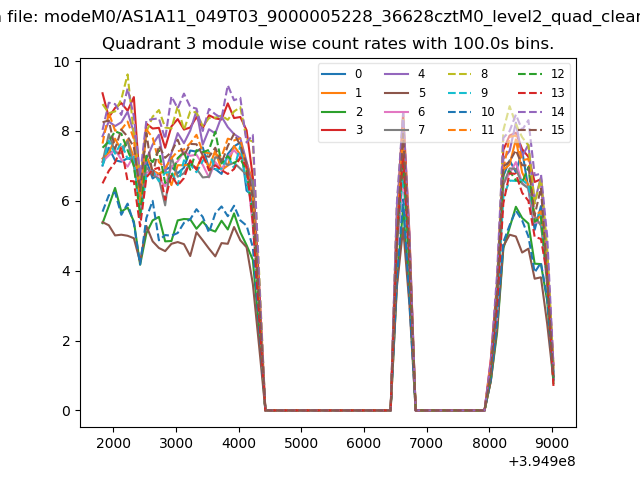 |
 |
| Parameter | Plot |
|---|---|
| CZT HV Monitor | 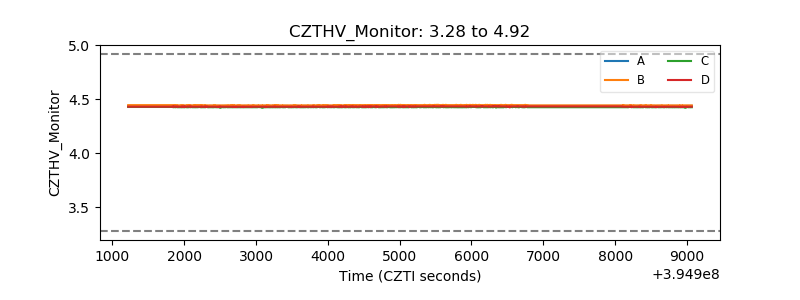 |
| D_VDD | 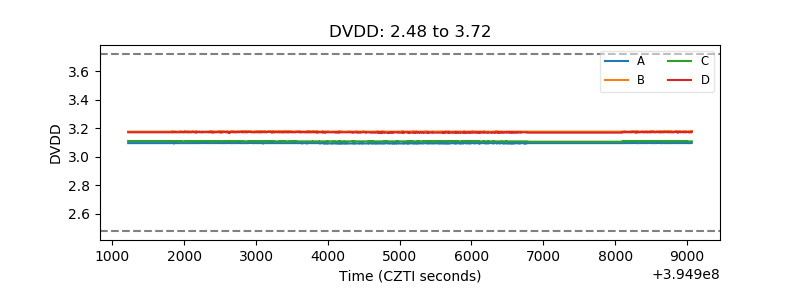 |
| Temperature 1 | 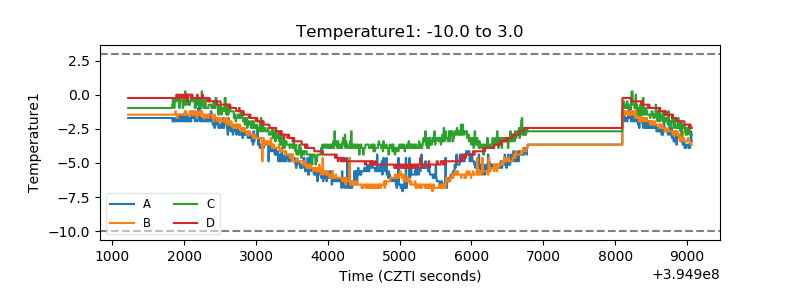 |
| Veto HV Monitor | 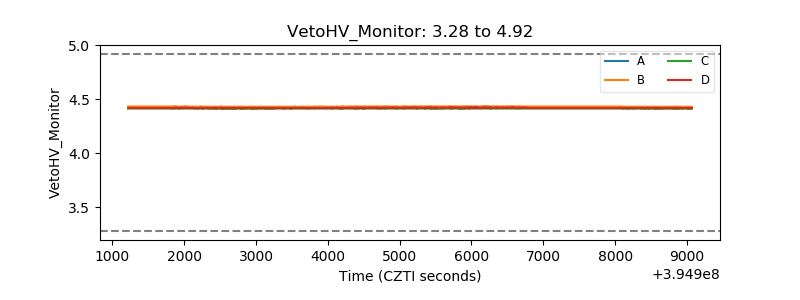 |
| Veto LLD | 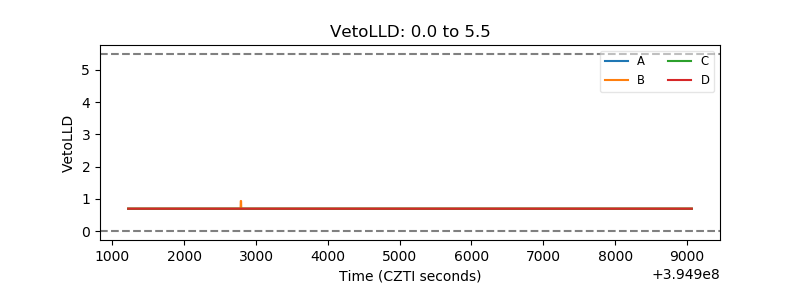 |
| Alpha Counter | 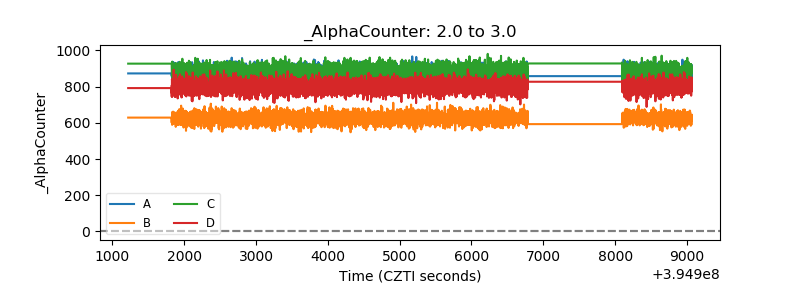 |
| _CPM_Rate | 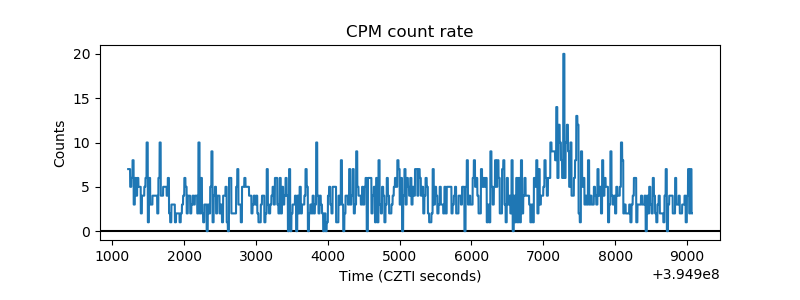 |
| CZT Counter | 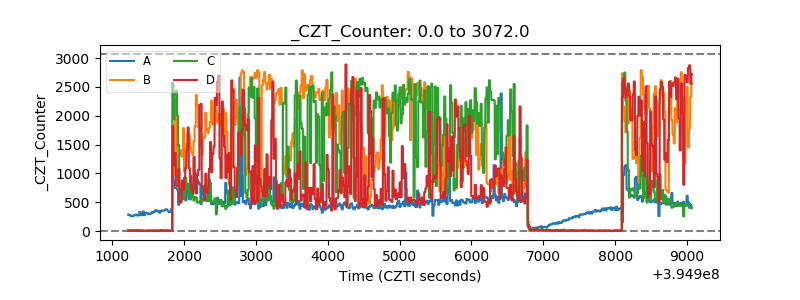 |
| +2.5 Volts monitor |  |
| +5 Volts monitor | 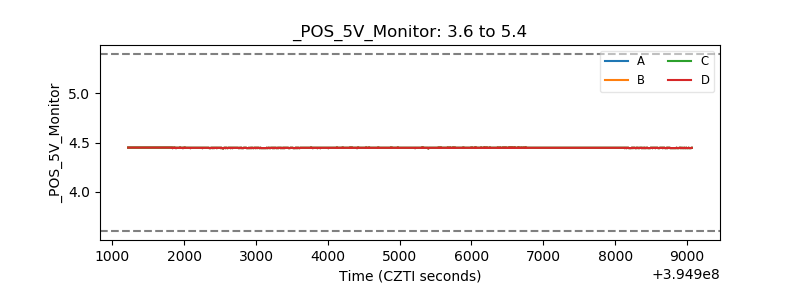 |
| _ROLL_ROT | 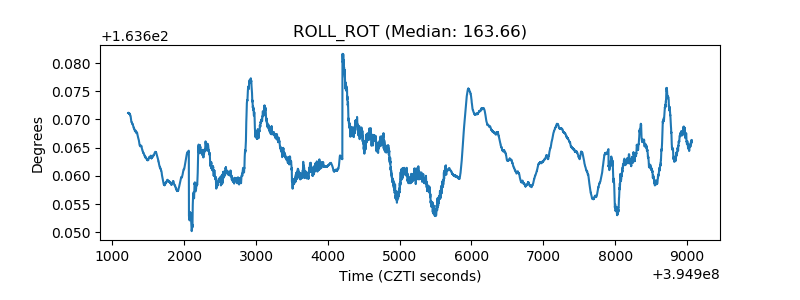 |
| _Roll_DEC | 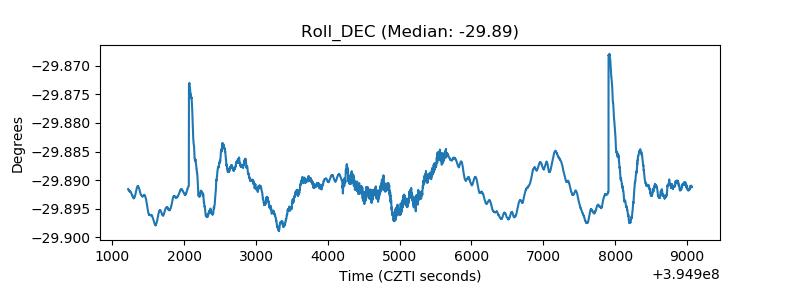 |
| _Roll_RA | 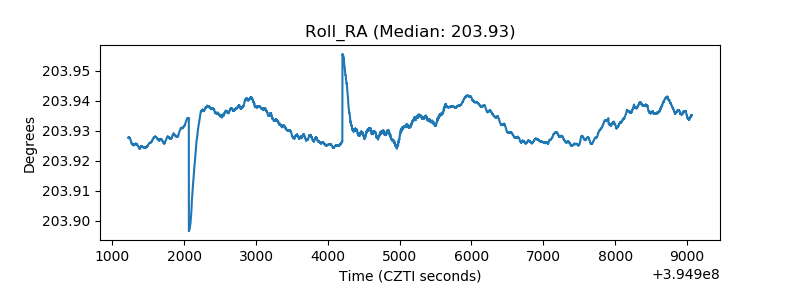 |
| Veto Counter | 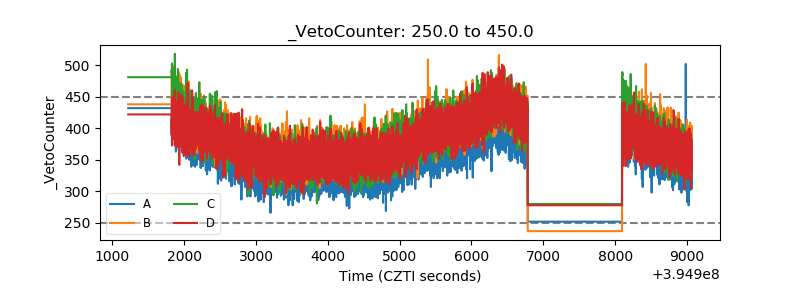 |