| Param | Original file | Final file |
|---|---|---|
| Filename | modeM0/AS1A11_049T03_9000005228_36631cztM0_level2.evt | modeM0/AS1A11_049T03_9000005228_36631cztM0_level2_quad_clean.evt |
| Size (bytes) | 1,335,502,080 | 117,063,360 |
| Size | 1.2 GB | 111.6 MB |
| Events in quadrant A | 5,256,366 | 794,013 |
| Events in quadrant B | 15,617,486 | 564,564 |
| Events in quadrant C | 6,029,675 | 761,721 |
| Events in quadrant D | 12,824,264 | 683,684 |
| Mode SS | |||
|---|---|---|---|
| Quadrant | BADHDUFLAG | Total packets | Discarded packets |
| A | 0 | 216 | 0 |
| B | 0 | 216 | 0 |
| C | 0 | 216 | 0 |
| D | 0 | 216 | 0 |
| Mode M9 | |||
|---|---|---|---|
| Quadrant | BADHDUFLAG | Total packets | Discarded packets |
| A | 0 | 37 | 0 |
| B | 0 | 37 | 0 |
| C | 0 | 37 | 0 |
| D | 0 | 38 | 0 |
| Mode M0 | |||
|---|---|---|---|
| Quadrant | BADHDUFLAG | Total packets | Discarded packets |
| A | 0 | 22414 | 4 |
| B | 0 | 53519 | 3 |
| C | 0 | 24600 | 3 |
| D | 0 | 45630 | 3 |
| Quadrant | Total seconds | Saturated seconds | Saturation percentage |
|---|---|---|---|
| A | 10678 | 18 | 0.168571% |
| B | 10678 | 4642 | 43.472560% |
| C | 10678 | 237 | 2.219517% |
| D | 10678 | 1887 | 17.671849% |
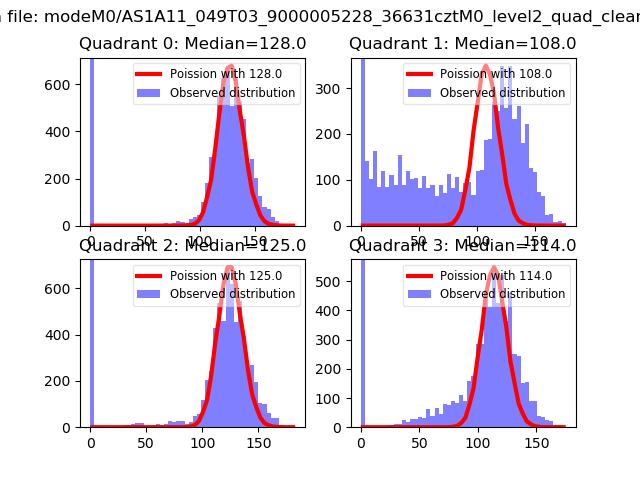
Noise dominated data is calculated using 1-second bins in cleaned event files. If a bin has >2000 counts, and if more than 50% of those come from <1% of pixels, then it is considered to be noise-dominated and hence unusable.
| Quadrant | # 1 sec bins | Bins with >0 counts | Bins with >2000 counts | High rate bins dominated by noise | Noise dominated (total time) | Noise dominated (detector-on time) | Marked lightcurve |
|---|---|---|---|---|---|---|---|
| A | 13544 | 10680 | 10 | 10 | 0.07% | 0.09% | 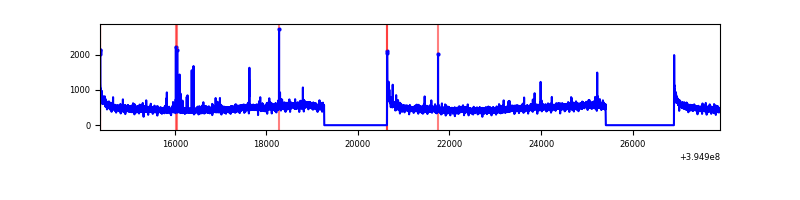 |
| B | 13544 | 10679 | 3752 | 3752 | 27.70% | 35.13% | 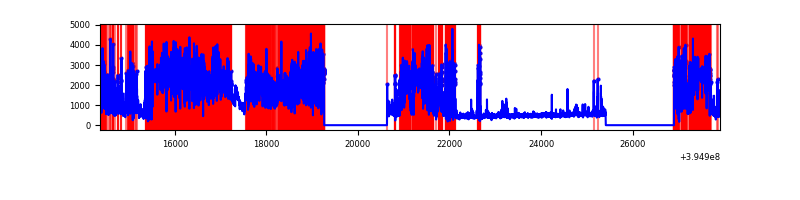 |
| C | 13544 | 10680 | 183 | 183 | 1.35% | 1.71% | 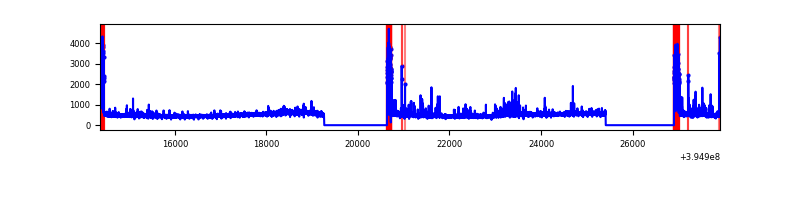 |
| D | 13544 | 10680 | 1749 | 1749 | 12.91% | 16.38% | 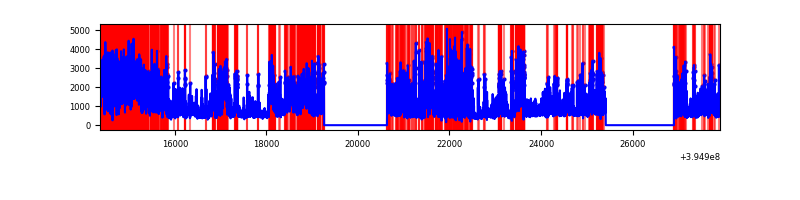 |
Top three noisy pixels from each quadrant. If the there are fewer than three noisy pixels in the level2.evt file, extra rows are filled as -1
| Pixel properties | Quadrant properties | ||||||
|---|---|---|---|---|---|---|---|
| Quadrant | DetID | PixID | Counts | Sigma | Mean | Median | Sigma |
| A | 10 | 83 | 368954 | 1467.76 | 1241 | 1214 | 250.5 |
| A | 9 | 143 | 48902 | 190.33 | 1241 | 1214 | 250.5 |
| A | 13 | 6 | 18959 | 70.82 | 1241 | 1214 | 250.5 |
| B | 5 | 200 | 10596525 | 55969.83 | 981 | 954 | 189.3 |
| B | 0 | 190 | 326223 | 1718.19 | 981 | 954 | 189.3 |
| B | 5 | 255 | 288546 | 1519.17 | 981 | 954 | 189.3 |
| C | 0 | 10 | 773978 | 2798.93 | 1187 | 1197 | 276.1 |
| C | 15 | 214 | 443919 | 1603.49 | 1187 | 1197 | 276.1 |
| C | 14 | 254 | 156785 | 563.52 | 1187 | 1197 | 276.1 |
| D | 12 | 235 | 5435929 | 19779.23 | 1128 | 1098 | 274.8 |
| D | 2 | 250 | 911865 | 3314.6 | 1128 | 1098 | 274.8 |
| D | 12 | 17 | 786805 | 2859.46 | 1128 | 1098 | 274.8 |
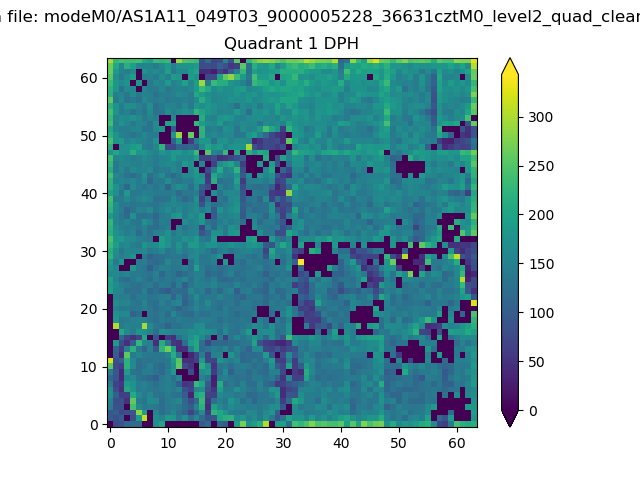
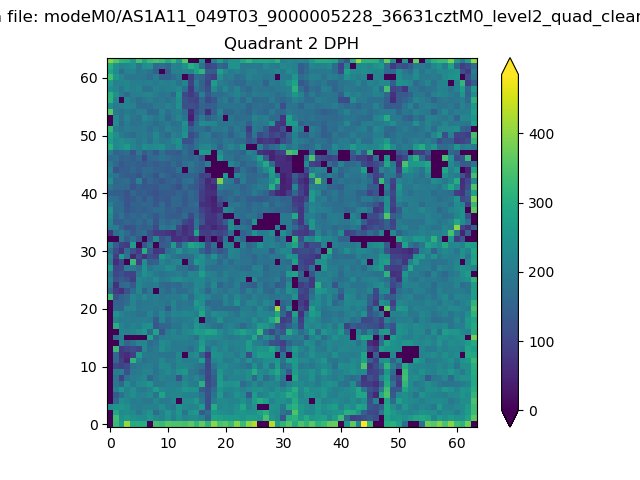
Histogram calculated using DETX and DETY for each event in the final _common_clean file
| Quadrant A |  |
 |
Quadrant B |
|---|---|---|---|
| Quadrant D | 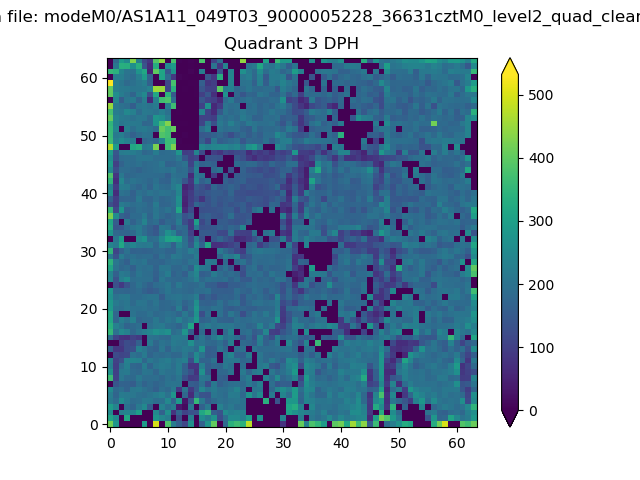 |
 |
Quadrant C |
| Plot type | Count rate plots | Images |
|---|---|---|
| Comparison with Poisson distribution Blue bars denote a histogram of data divided into 1 sec bins. Red curve is a Poisson curve with rate = median count rate of data. |
 |
 |
| Quadrant-wise count rates Data is divided into 100 sec bins |
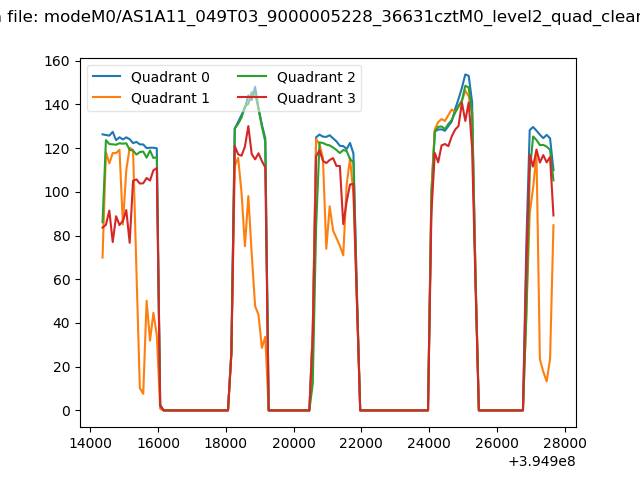 |
|
| Module-wise count rates for Quadrant A Data is divided into 100 sec bins |
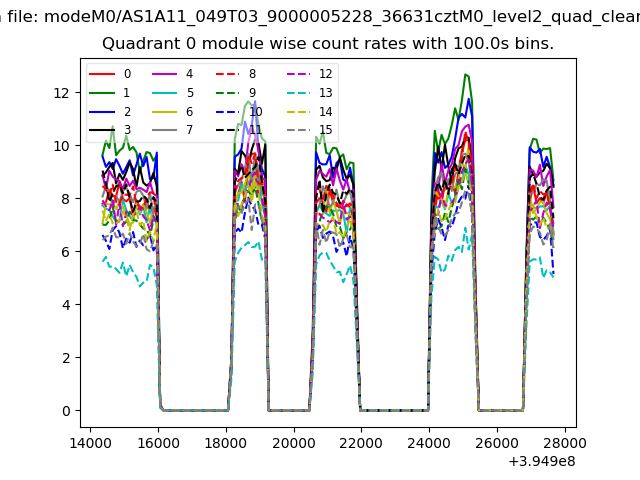 |
 |
| Module-wise count rates for Quadrant B Data is divided into 100 sec bins |
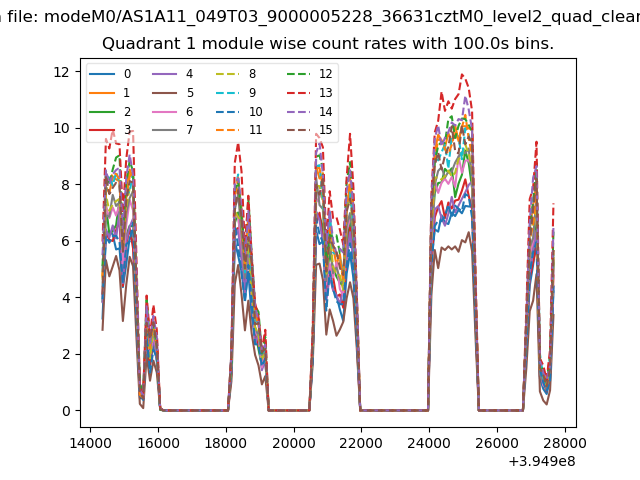 |
 |
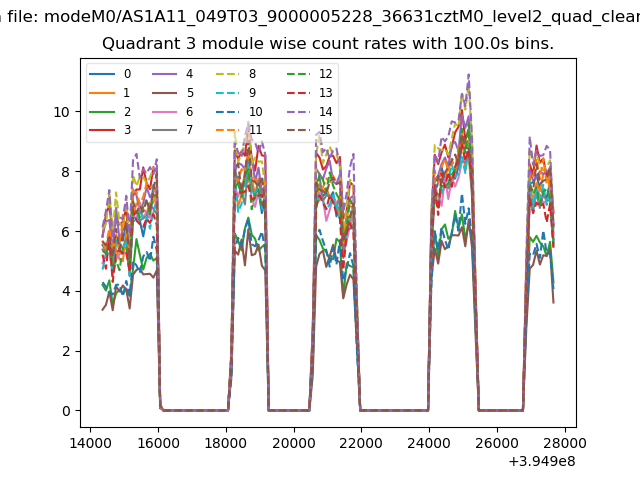
| Module-wise count rates for Quadrant C Data is divided into 100 sec bins |
 |
 |
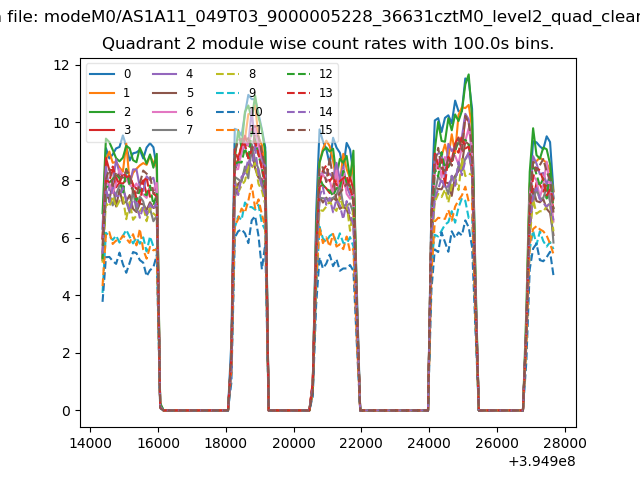
| Module-wise count rates for Quadrant D Data is divided into 100 sec bins |
 |
 |
| Parameter | Plot |
|---|---|
| CZT HV Monitor | 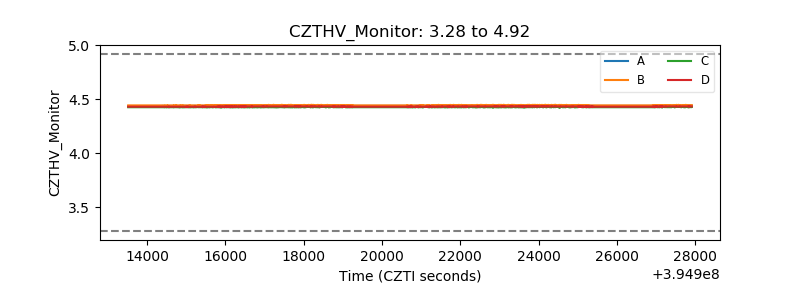 |
| D_VDD | 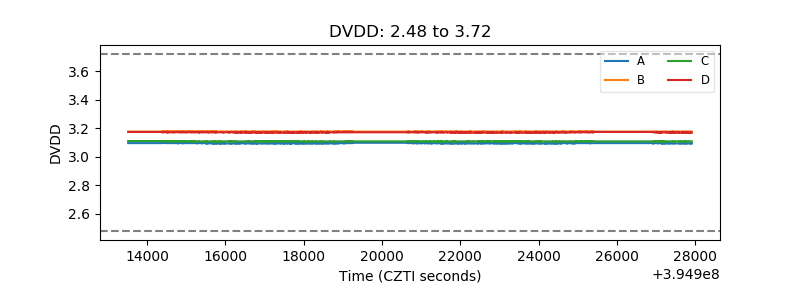 |
| Temperature 1 | 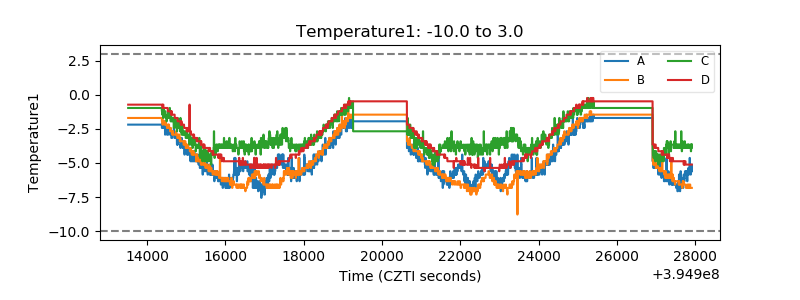 |
| Veto HV Monitor | 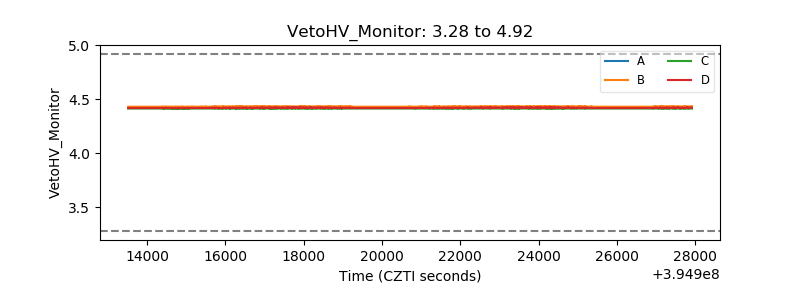 |
| Veto LLD |  |
| Alpha Counter | 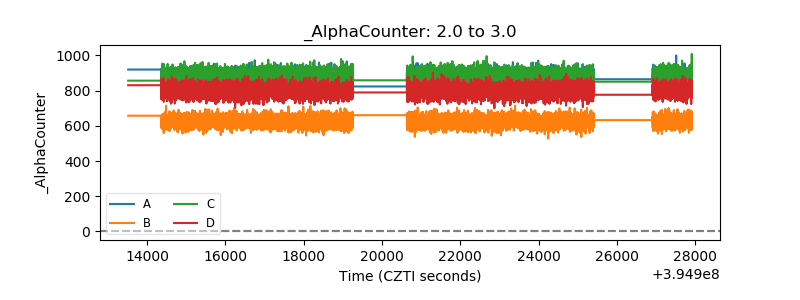 |
| _CPM_Rate | 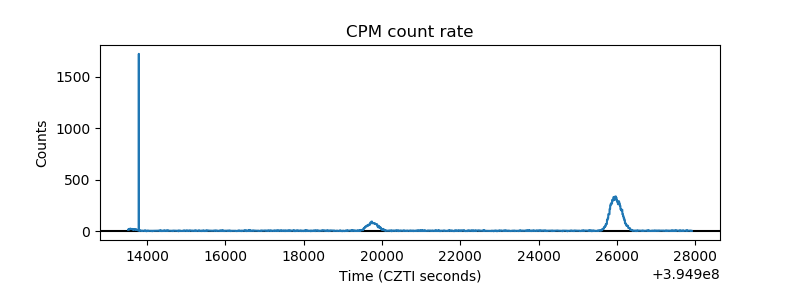 |
| CZT Counter | 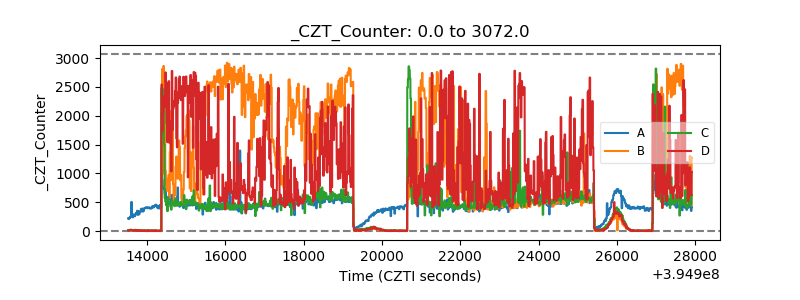 |
| +2.5 Volts monitor |  |
| +5 Volts monitor | 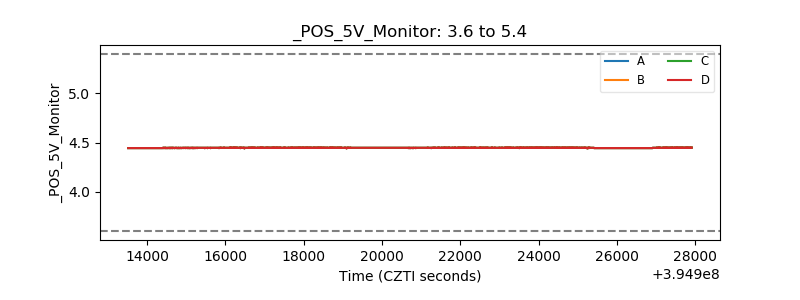 |
| _ROLL_ROT | 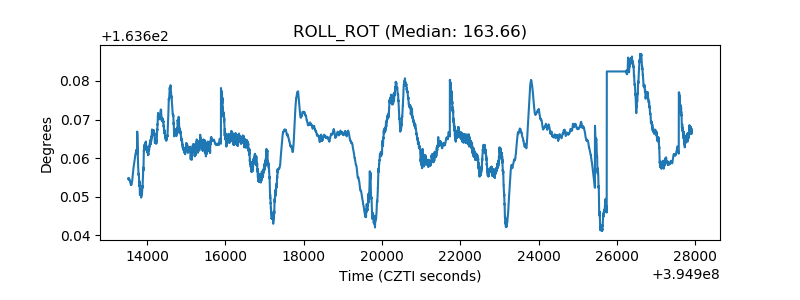 |
| _Roll_DEC | 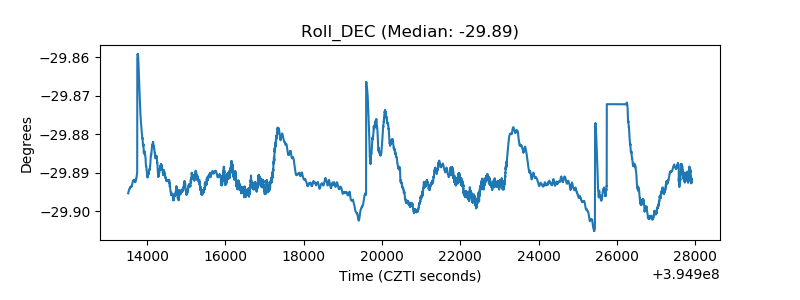 |
| _Roll_RA |  |
| Veto Counter | 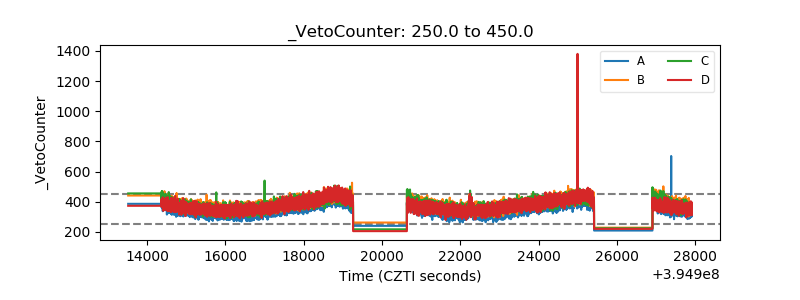 |