| Param | Original file | Final file |
|---|---|---|
| Filename | modeM0/AS1A11_049T03_9000005228_36632cztM0_level2.evt | modeM0/AS1A11_049T03_9000005228_36632cztM0_level2_quad_clean.evt |
| Size (bytes) | 562,242,240 | 59,192,640 |
| Size | 536.2 MB | 56.5 MB |
| Events in quadrant A | 2,728,824 | 382,164 |
| Events in quadrant B | 5,123,582 | 318,480 |
| Events in quadrant C | 3,482,271 | 364,193 |
| Events in quadrant D | 5,317,010 | 338,108 |
| Mode SS | |||
|---|---|---|---|
| Quadrant | BADHDUFLAG | Total packets | Discarded packets |
| A | 0 | 114 | 0 |
| B | 0 | 114 | 0 |
| C | 0 | 114 | 0 |
| D | 0 | 114 | 0 |
| Mode M9 | |||
|---|---|---|---|
| Quadrant | BADHDUFLAG | Total packets | Discarded packets |
| A | 0 | 18 | 0 |
| B | 0 | 18 | 0 |
| C | 0 | 18 | 0 |
| D | 0 | 19 | 0 |
| Mode M0 | |||
|---|---|---|---|
| Quadrant | BADHDUFLAG | Total packets | Discarded packets |
| A | 0 | 11585 | 3 |
| B | 0 | 18941 | 2 |
| C | 0 | 13709 | 2 |
| D | 0 | 19642 | 2 |
| Quadrant | Total seconds | Saturated seconds | Saturation percentage |
|---|---|---|---|
| A | 5549 | 6 | 0.108128% |
| B | 5549 | 812 | 14.633267% |
| C | 5549 | 190 | 3.424040% |
| D | 5549 | 488 | 8.794377% |
Noise dominated data is calculated using 1-second bins in cleaned event files. If a bin has >2000 counts, and if more than 50% of those come from <1% of pixels, then it is considered to be noise-dominated and hence unusable.
| Quadrant | # 1 sec bins | Bins with >0 counts | Bins with >2000 counts | High rate bins dominated by noise | Noise dominated (total time) | Noise dominated (detector-on time) | Marked lightcurve |
|---|---|---|---|---|---|---|---|
| A | 7162 | 5550 | 0 | 0 | 0.00% | 0.00% | 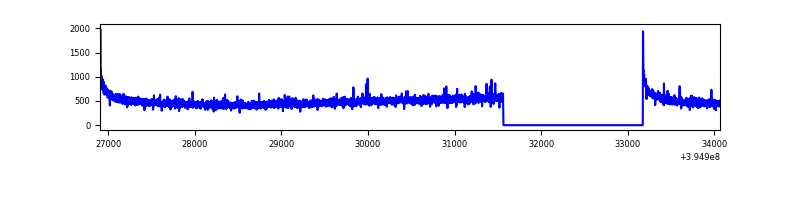 |
| B | 7162 | 5550 | 660 | 660 | 9.22% | 11.89% | 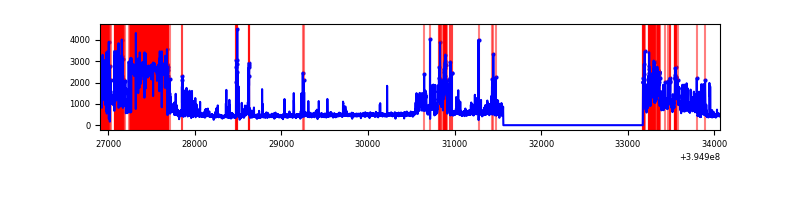 |
| C | 7162 | 5550 | 147 | 147 | 2.05% | 2.65% | 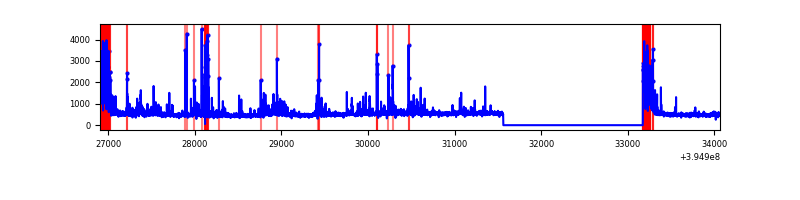 |
| D | 7162 | 5550 | 428 | 428 | 5.98% | 7.71% | 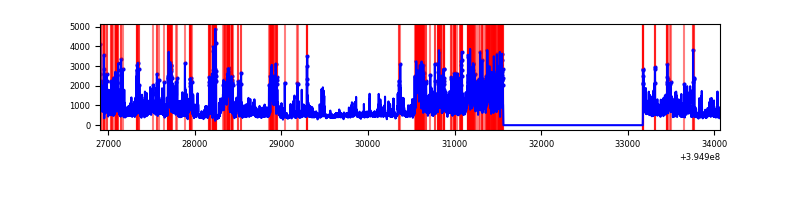 |
Top three noisy pixels from each quadrant. If the there are fewer than three noisy pixels in the level2.evt file, extra rows are filled as -1
| Pixel properties | Quadrant properties | ||||||
|---|---|---|---|---|---|---|---|
| Quadrant | DetID | PixID | Counts | Sigma | Mean | Median | Sigma |
| A | 10 | 83 | 207420 | 1589.79 | 644 | 630 | 130.1 |
| A | 13 | 6 | 15735 | 116.13 | 644 | 630 | 130.1 |
| A | 9 | 143 | 9794 | 70.45 | 644 | 630 | 130.1 |
| B | 5 | 200 | 2414680 | 21256.16 | 589 | 573 | 113.6 |
| B | 5 | 255 | 207741 | 1824.11 | 589 | 573 | 113.6 |
| B | 0 | 190 | 64568 | 563.47 | 589 | 573 | 113.6 |
| C | 0 | 10 | 448191 | 3099.04 | 613 | 616 | 144.4 |
| C | 14 | 254 | 397109 | 2745.35 | 613 | 616 | 144.4 |
| C | 15 | 214 | 234848 | 1621.84 | 613 | 616 | 144.4 |
| D | 12 | 235 | 1773813 | 11910.25 | 603 | 586 | 148.9 |
| D | 12 | 17 | 331530 | 2222.85 | 603 | 586 | 148.9 |
| D | 2 | 153 | 318451 | 2135.01 | 603 | 586 | 148.9 |
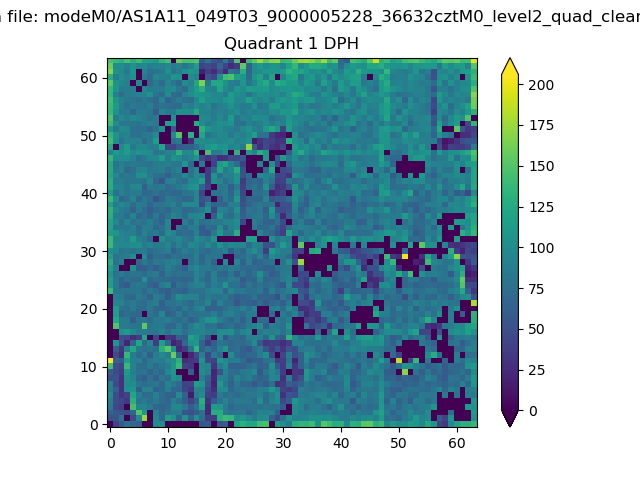
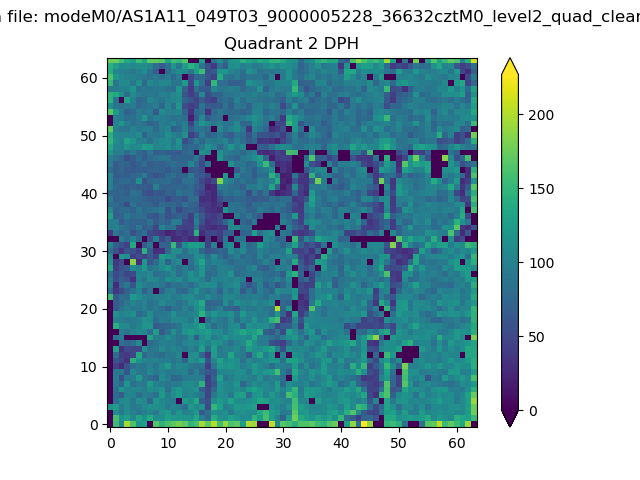
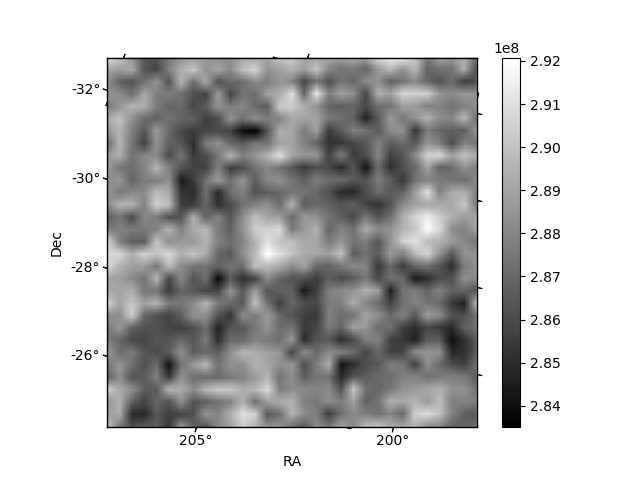
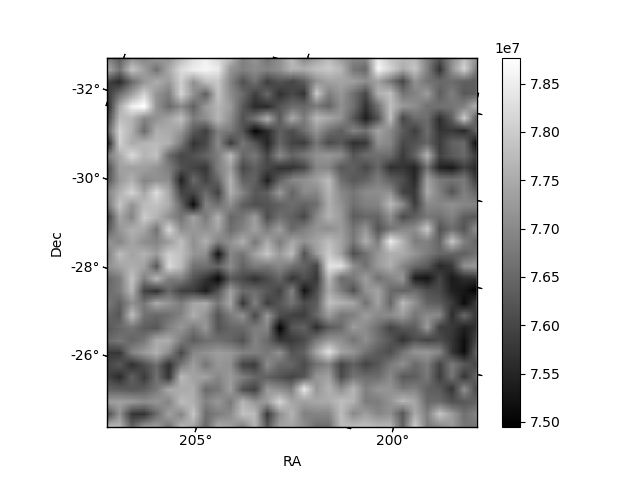
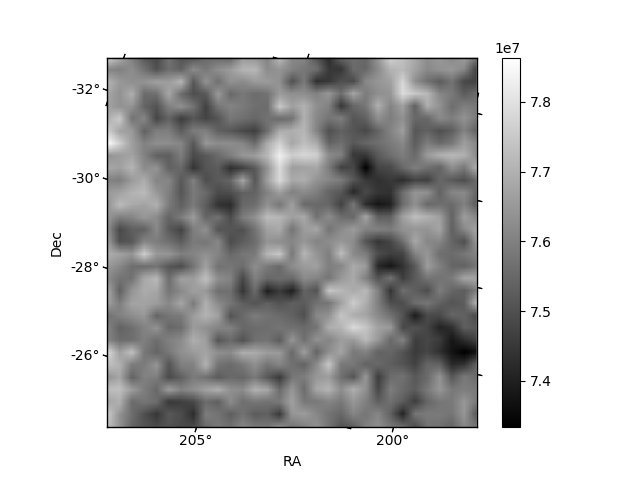
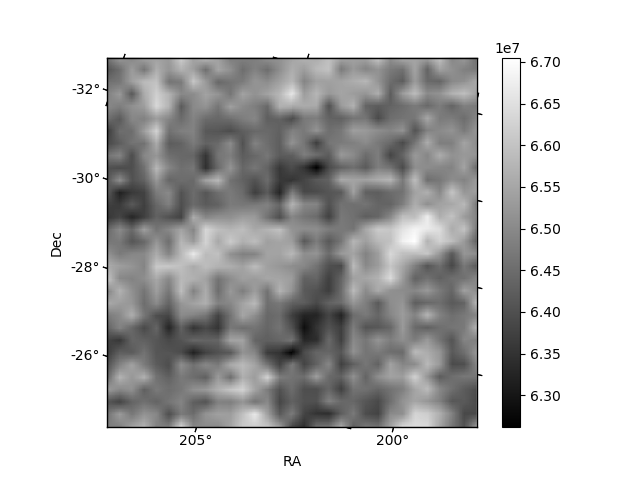
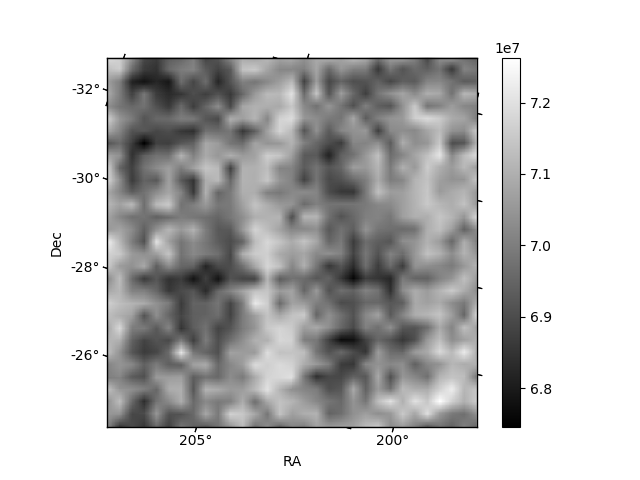
Histogram calculated using DETX and DETY for each event in the final _common_clean file
| Quadrant A |  |
 |
Quadrant B |
|---|---|---|---|
| Quadrant D | 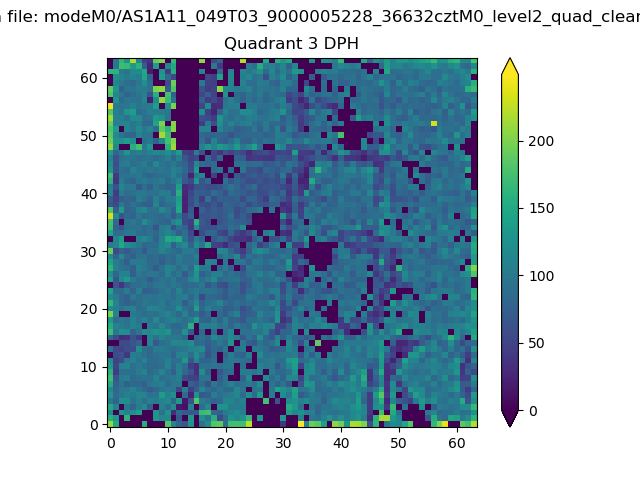 |
 |
Quadrant C |
| Plot type | Count rate plots | Images |
|---|---|---|
| Comparison with Poisson distribution Blue bars denote a histogram of data divided into 1 sec bins. Red curve is a Poisson curve with rate = median count rate of data. |
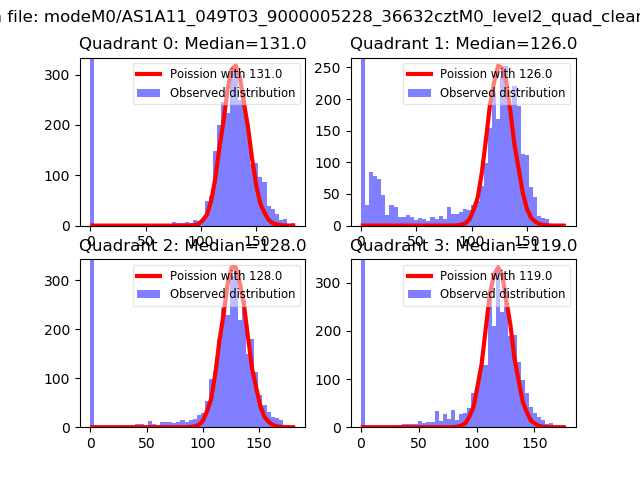 |
 |
| Quadrant-wise count rates Data is divided into 100 sec bins |
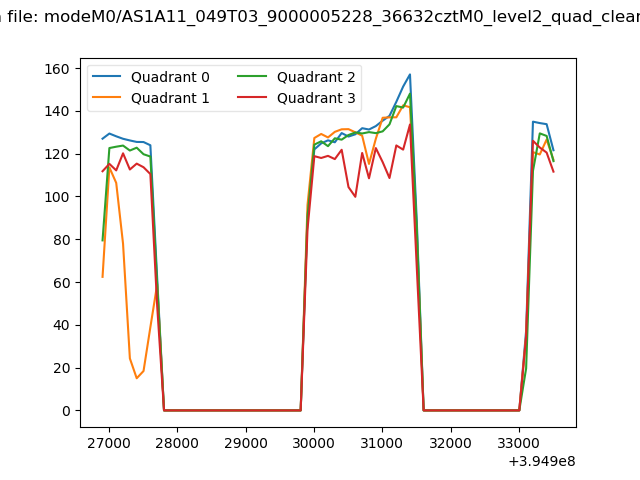 |
|
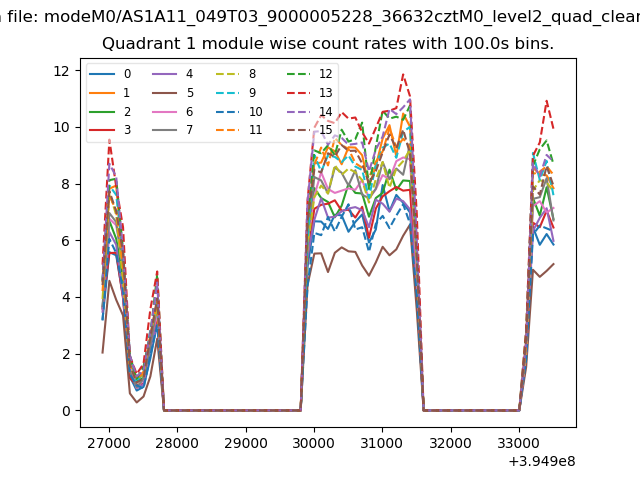
| Module-wise count rates for Quadrant A Data is divided into 100 sec bins |
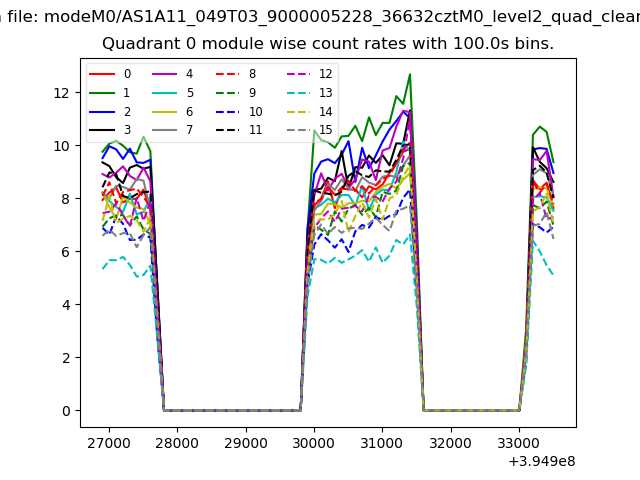 |
 |
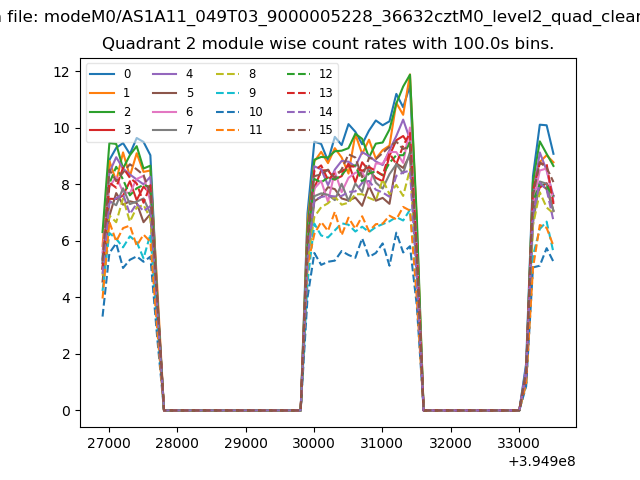
| Module-wise count rates for Quadrant B Data is divided into 100 sec bins |
 |
 |
| Module-wise count rates for Quadrant C Data is divided into 100 sec bins |
 |
 |
| Module-wise count rates for Quadrant D Data is divided into 100 sec bins |
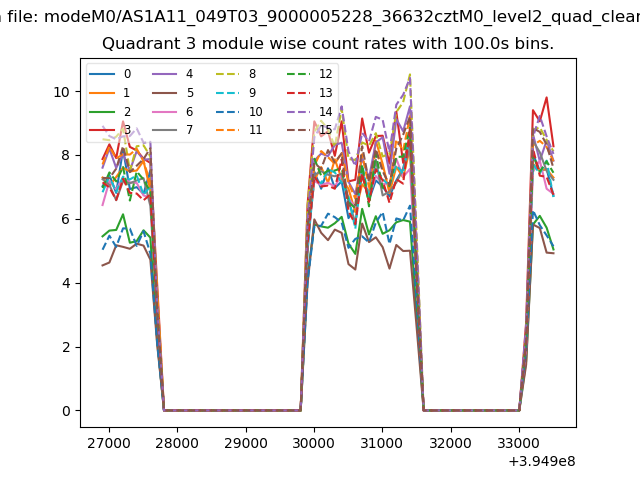 |
 |
| Parameter | Plot |
|---|---|
| CZT HV Monitor | 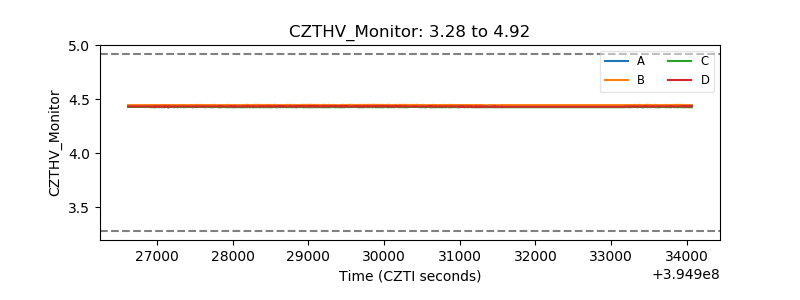 |
| D_VDD | 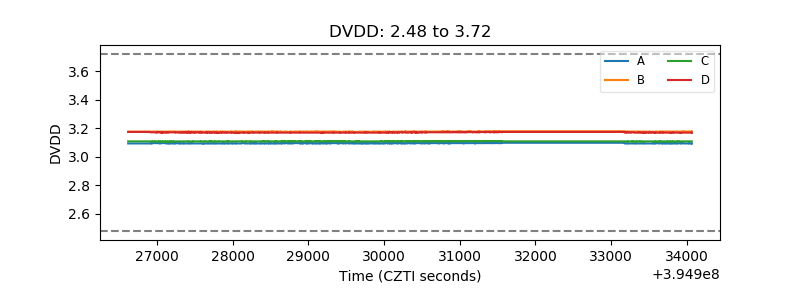 |
| Temperature 1 | 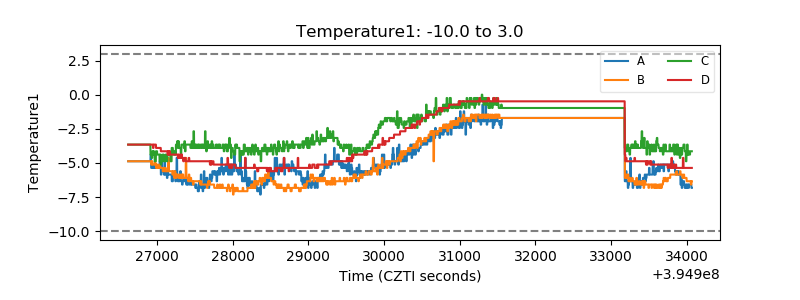 |
| Veto HV Monitor | 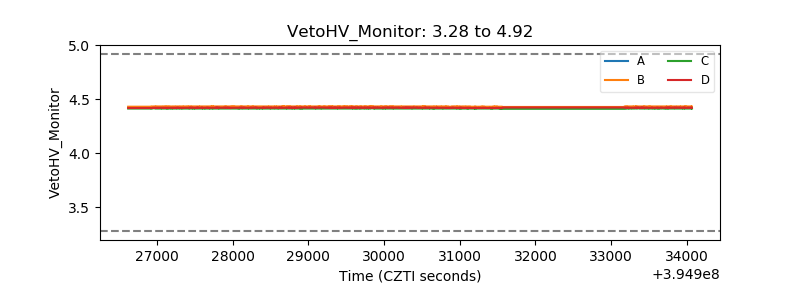 |
| Veto LLD |  |
| Alpha Counter | 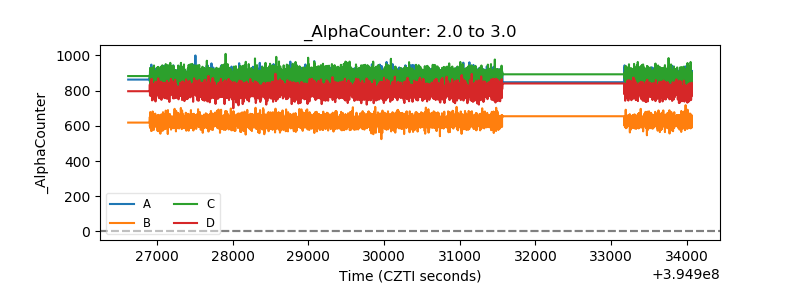 |
| _CPM_Rate | 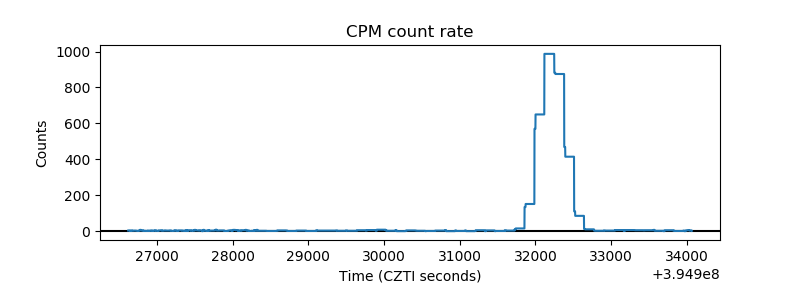 |
| CZT Counter | 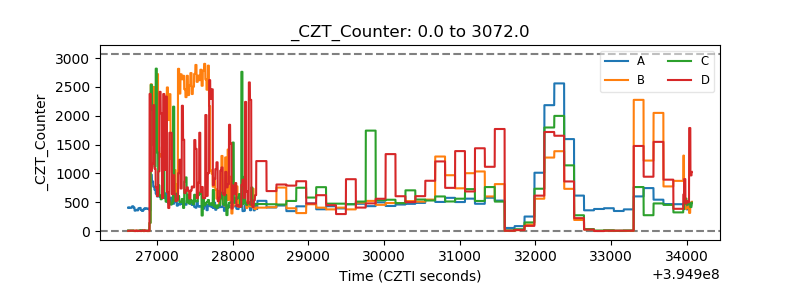 |
| +2.5 Volts monitor |  |
| +5 Volts monitor | 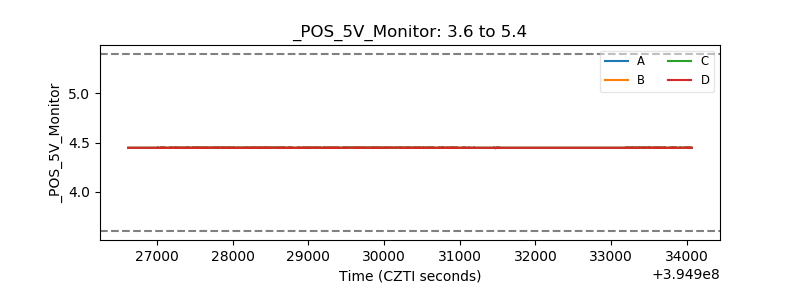 |
| _ROLL_ROT | 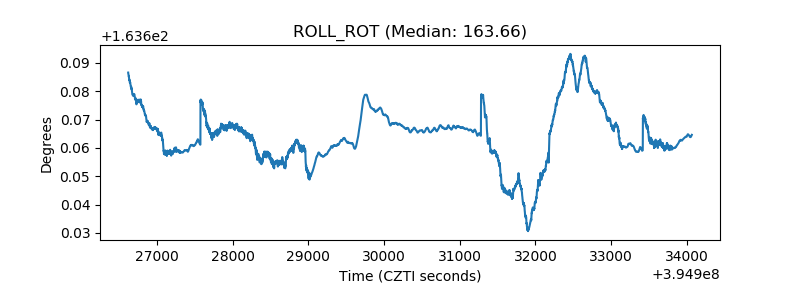 |
| _Roll_DEC | 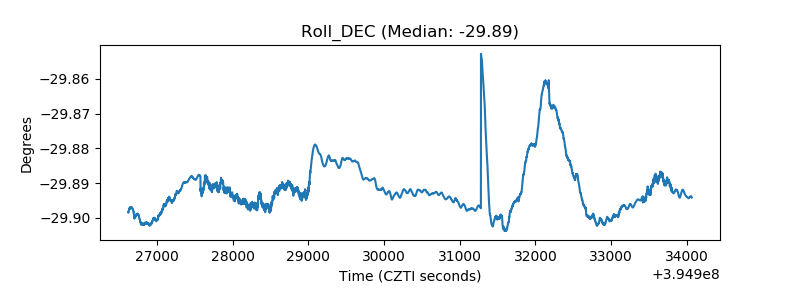 |
| _Roll_RA | 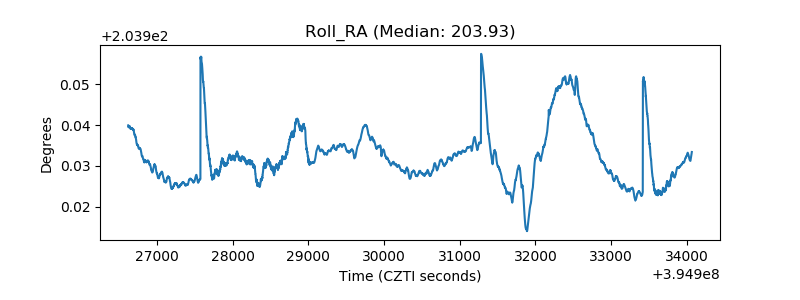 |
| Veto Counter | 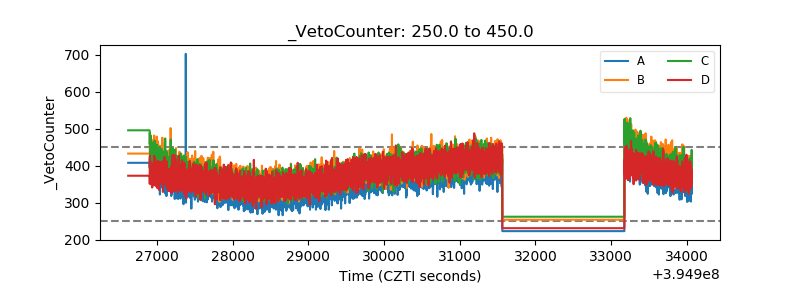 |