| Param | Original file | Final file |
|---|---|---|
| Filename | modeM0/AS1A11_049T03_9000005228_36633cztM0_level2.evt | modeM0/AS1A11_049T03_9000005228_36633cztM0_level2_quad_clean.evt |
| Size (bytes) | 530,867,520 | 51,572,160 |
| Size | 506.3 MB | 49.2 MB |
| Events in quadrant A | 2,705,933 | 309,004 |
| Events in quadrant B | 4,566,478 | 297,081 |
| Events in quadrant C | 3,135,146 | 297,595 |
| Events in quadrant D | 5,302,585 | 277,598 |
| Mode SS | |||
|---|---|---|---|
| Quadrant | BADHDUFLAG | Total packets | Discarded packets |
| A | 0 | 110 | 0 |
| B | 0 | 110 | 0 |
| C | 0 | 110 | 0 |
| D | 0 | 110 | 0 |
| Mode M9 | |||
|---|---|---|---|
| Quadrant | BADHDUFLAG | Total packets | Discarded packets |
| A | 0 | 28 | 0 |
| B | 0 | 28 | 0 |
| C | 0 | 28 | 0 |
| D | 0 | 29 | 0 |
| Mode M0 | |||
|---|---|---|---|
| Quadrant | BADHDUFLAG | Total packets | Discarded packets |
| A | 0 | 11338 | 3 |
| B | 0 | 17125 | 2 |
| C | 0 | 12533 | 2 |
| D | 0 | 19571 | 2 |
| Quadrant | Total seconds | Saturated seconds | Saturation percentage |
|---|---|---|---|
| A | 5426 | 9 | 0.165868% |
| B | 5426 | 524 | 9.657206% |
| C | 5426 | 110 | 2.027276% |
| D | 5426 | 288 | 5.307777% |
Noise dominated data is calculated using 1-second bins in cleaned event files. If a bin has >2000 counts, and if more than 50% of those come from <1% of pixels, then it is considered to be noise-dominated and hence unusable.
| Quadrant | # 1 sec bins | Bins with >0 counts | Bins with >2000 counts | High rate bins dominated by noise | Noise dominated (total time) | Noise dominated (detector-on time) | Marked lightcurve |
|---|---|---|---|---|---|---|---|
| A | 7160 | 5427 | 0 | 0 | 0.00% | 0.00% | 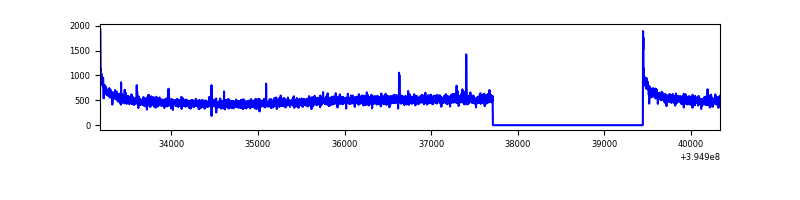 |
| B | 7160 | 5427 | 340 | 340 | 4.75% | 6.26% | 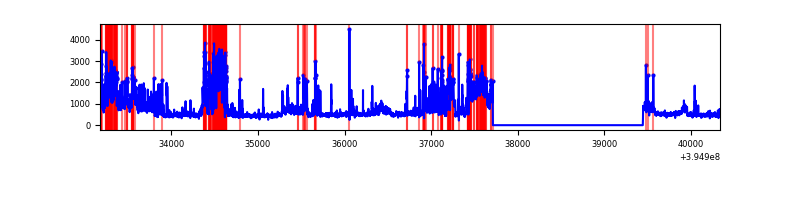 |
| C | 7160 | 5427 | 89 | 89 | 1.24% | 1.64% | 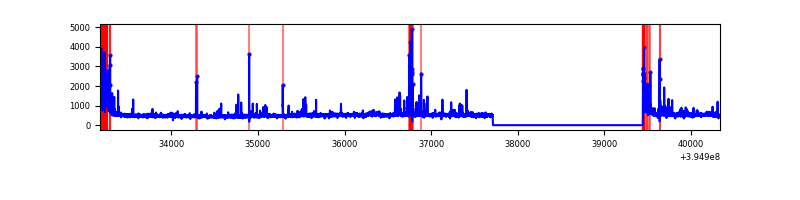 |
| D | 7160 | 5427 | 259 | 259 | 3.62% | 4.77% | 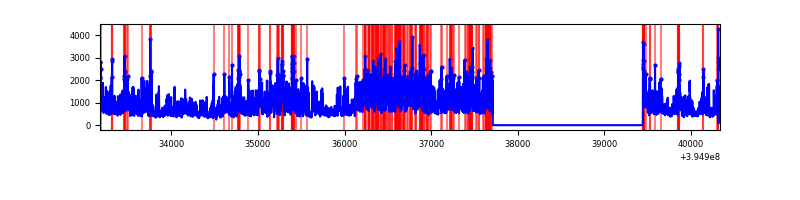 |
Top three noisy pixels from each quadrant. If the there are fewer than three noisy pixels in the level2.evt file, extra rows are filled as -1
| Pixel properties | Quadrant properties | ||||||
|---|---|---|---|---|---|---|---|
| Quadrant | DetID | PixID | Counts | Sigma | Mean | Median | Sigma |
| A | 10 | 83 | 205270 | 1585.3 | 638 | 626 | 129.1 |
| A | 13 | 6 | 19514 | 146.32 | 638 | 626 | 129.1 |
| A | 15 | 223 | 9508 | 68.81 | 638 | 626 | 129.1 |
| B | 5 | 200 | 1793554 | 15260.36 | 617 | 601 | 117.5 |
| B | 5 | 255 | 176543 | 1497.49 | 617 | 601 | 117.5 |
| B | 0 | 213 | 79252 | 669.42 | 617 | 601 | 117.5 |
| C | 0 | 10 | 296190 | 2077.41 | 612 | 617 | 142.3 |
| C | 15 | 214 | 231611 | 1623.53 | 612 | 617 | 142.3 |
| C | 14 | 254 | 170494 | 1193.97 | 612 | 617 | 142.3 |
| D | 12 | 235 | 2367310 | 15893.08 | 606 | 589 | 148.9 |
| D | 12 | 17 | 291458 | 1953.25 | 606 | 589 | 148.9 |
| D | 13 | 171 | 58572 | 389.37 | 606 | 589 | 148.9 |
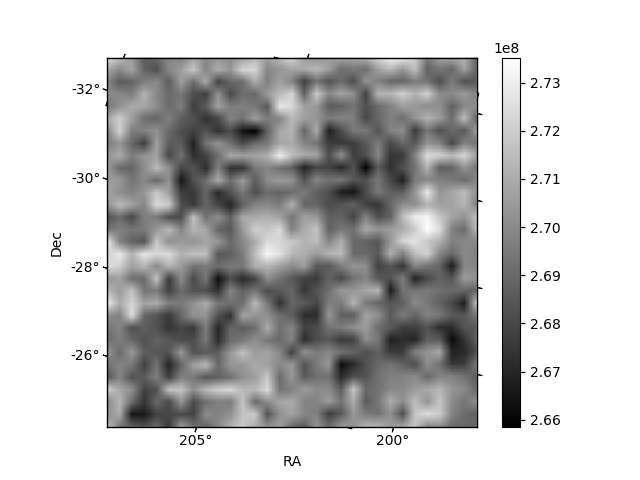
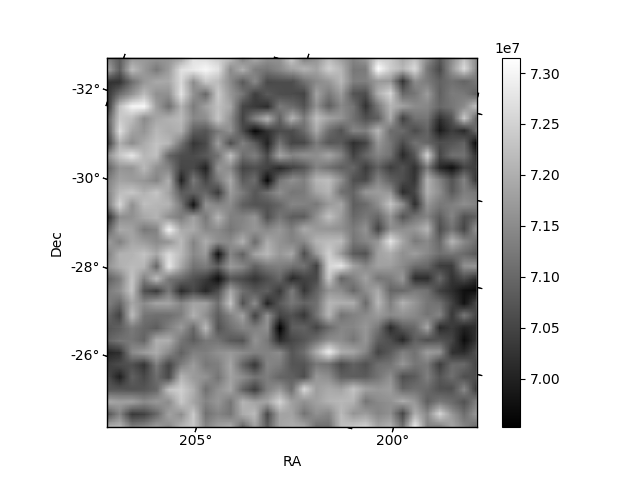
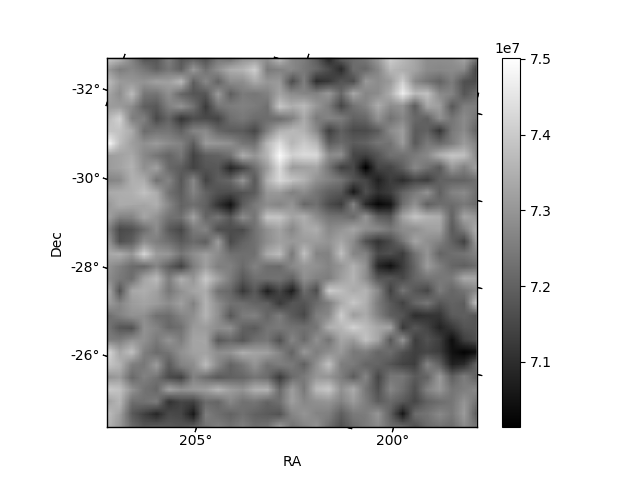
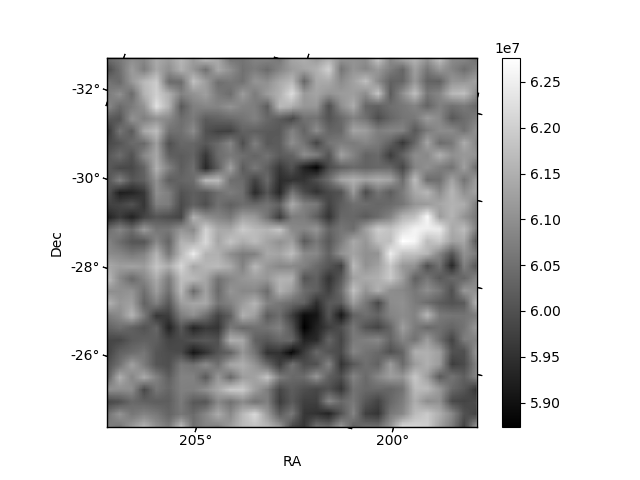
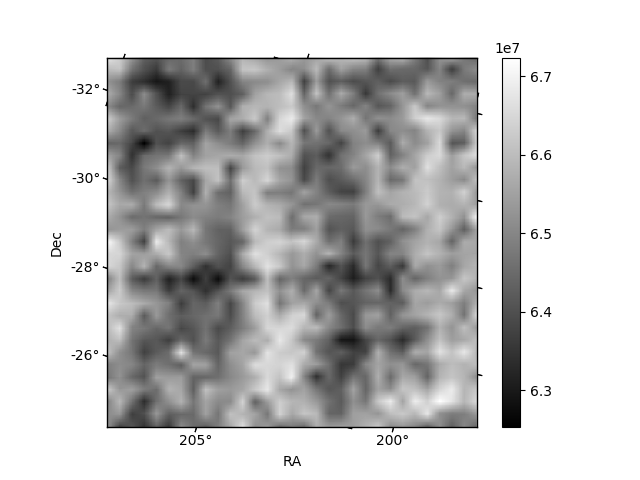
Histogram calculated using DETX and DETY for each event in the final _common_clean file
| Quadrant A | 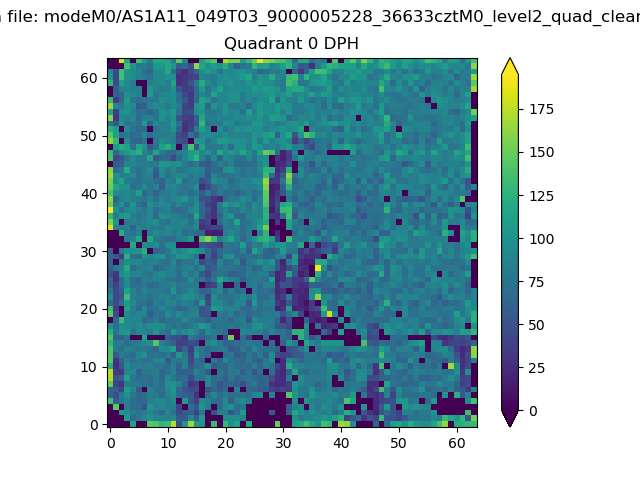 |
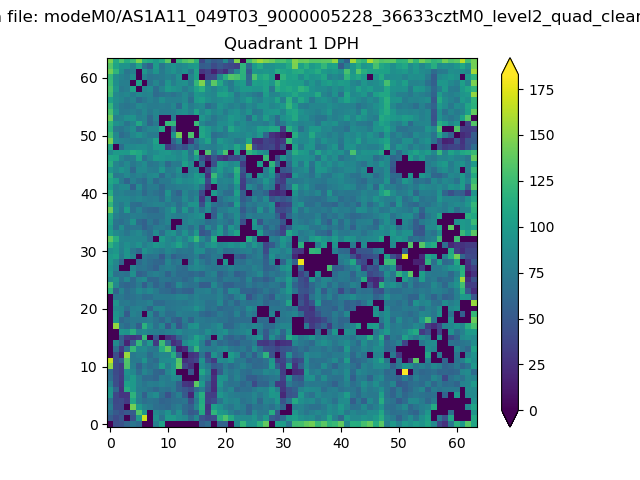 |
Quadrant B |
|---|---|---|---|
| Quadrant D |  |
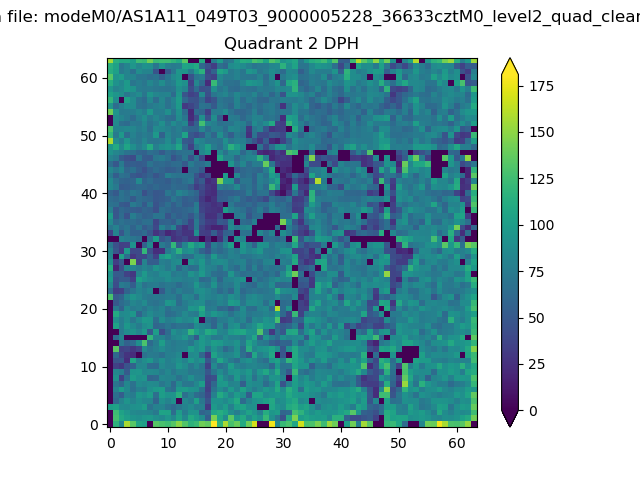 |
Quadrant C |
| Plot type | Count rate plots | Images |
|---|---|---|
| Comparison with Poisson distribution Blue bars denote a histogram of data divided into 1 sec bins. Red curve is a Poisson curve with rate = median count rate of data. |
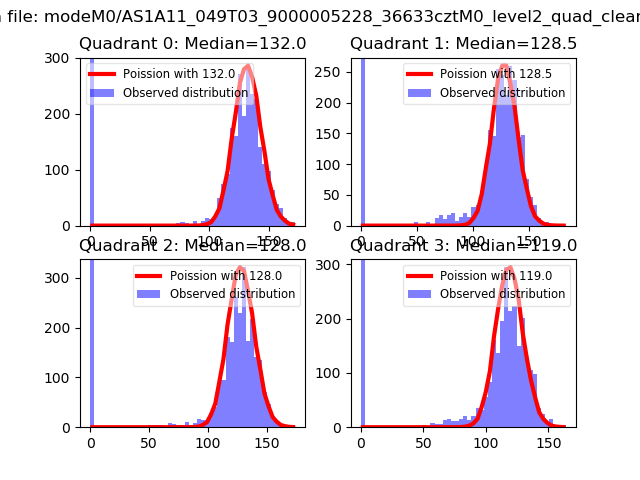 |
 |
| Quadrant-wise count rates Data is divided into 100 sec bins |
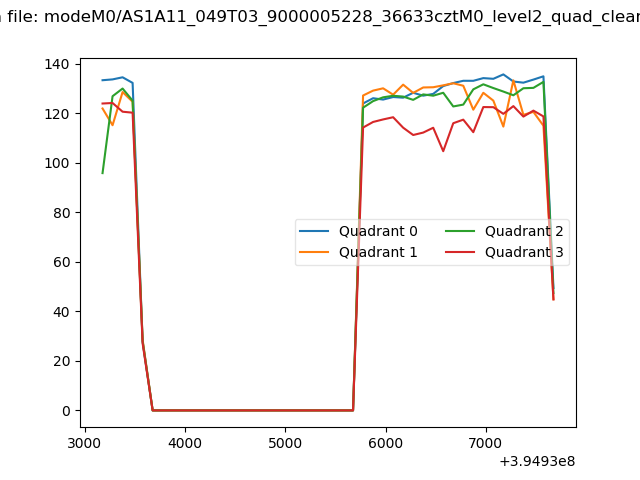 |
|
| Module-wise count rates for Quadrant A Data is divided into 100 sec bins |
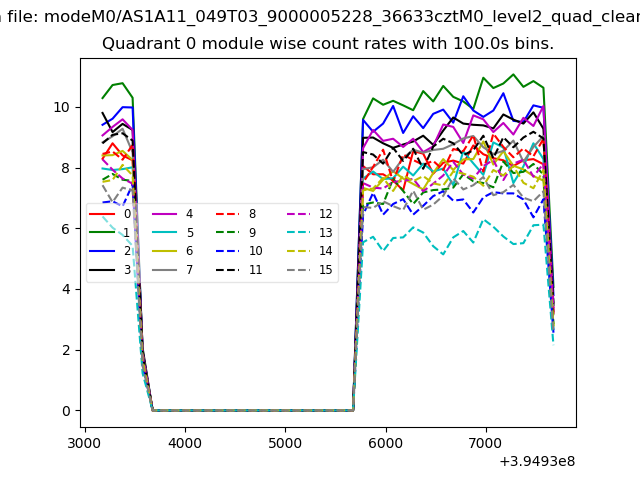 |
 |
| Module-wise count rates for Quadrant B Data is divided into 100 sec bins |
 |
 |
| Module-wise count rates for Quadrant C Data is divided into 100 sec bins |
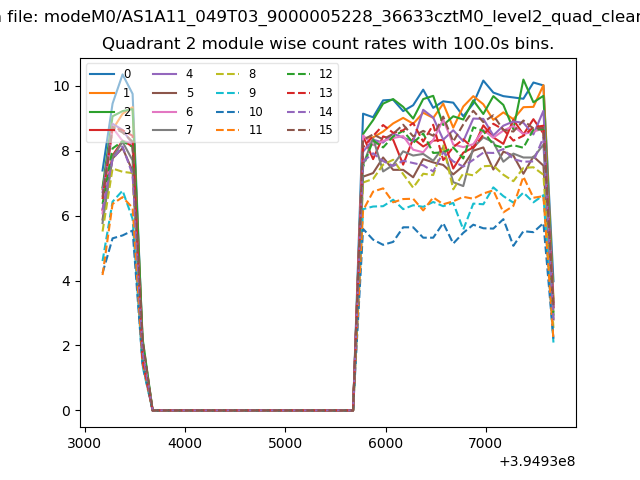 |
 |
| Module-wise count rates for Quadrant D Data is divided into 100 sec bins |
 |
 |
| Parameter | Plot |
|---|---|
| CZT HV Monitor | 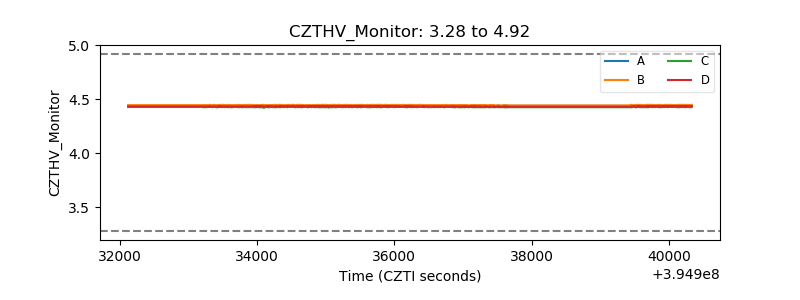 |
| D_VDD | 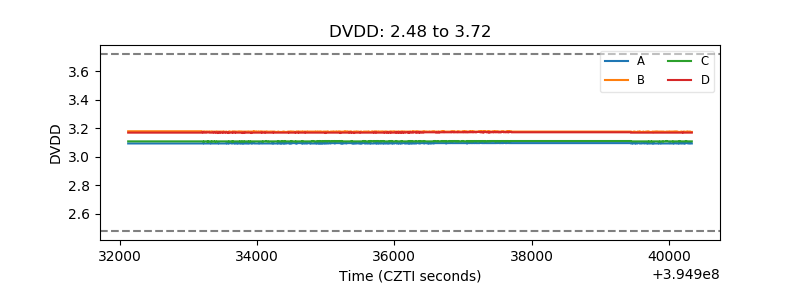 |
| Temperature 1 | 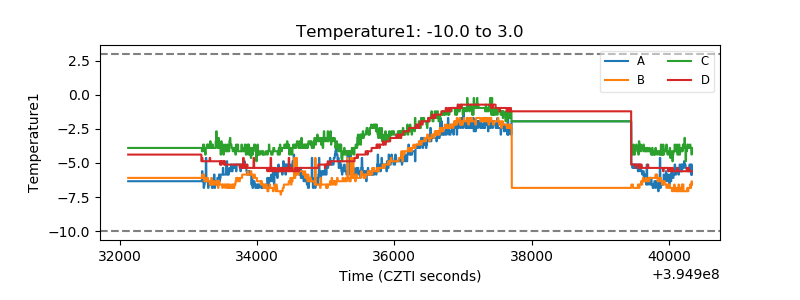 |
| Veto HV Monitor | 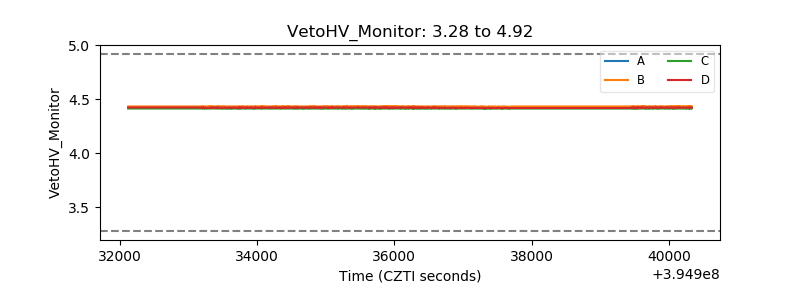 |
| Veto LLD |  |
| Alpha Counter | 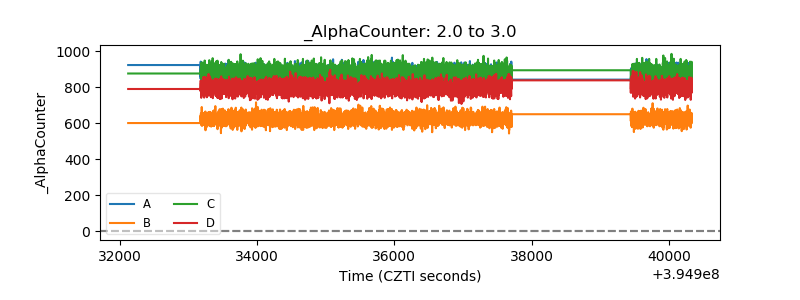 |
| _CPM_Rate | 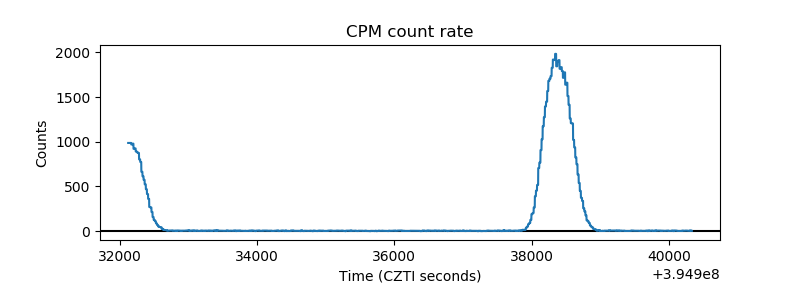 |
| CZT Counter | 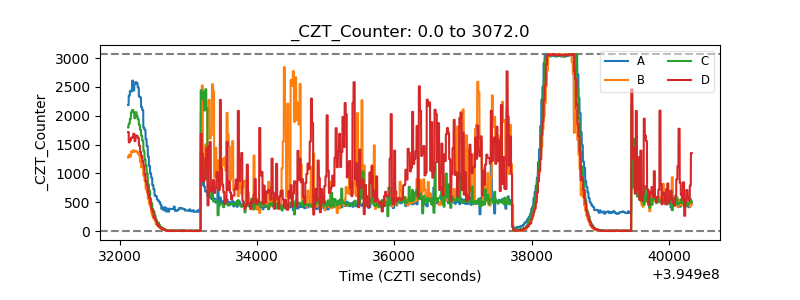 |
| +2.5 Volts monitor |  |
| +5 Volts monitor |  |
| _ROLL_ROT | 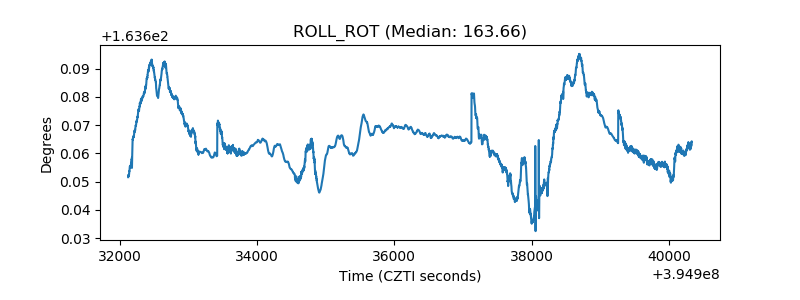 |
| _Roll_DEC | 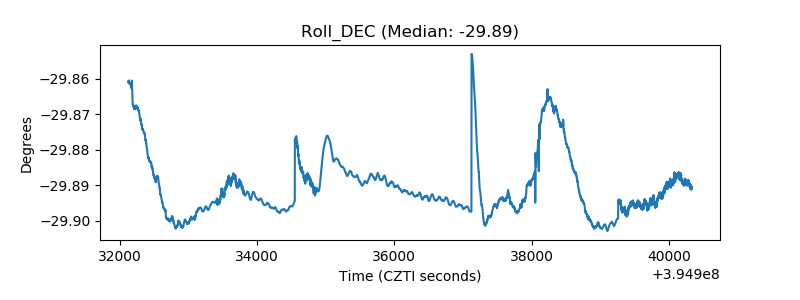 |
| _Roll_RA | 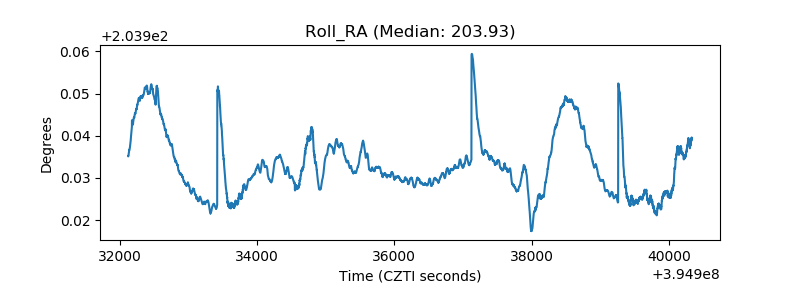 |
| Veto Counter | 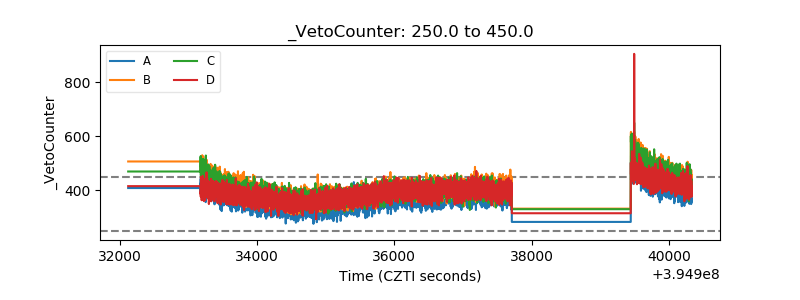 |