| Param | Original file | Final file |
|---|---|---|
| Filename | modeM0/AS1A11_049T03_9000005228_36635cztM0_level2.evt | modeM0/AS1A11_049T03_9000005228_36635cztM0_level2_quad_clean.evt |
| Size (bytes) | 503,686,080 | 52,444,800 |
| Size | 480.4 MB | 50.0 MB |
| Events in quadrant A | 2,883,530 | 308,934 |
| Events in quadrant B | 3,667,572 | 307,919 |
| Events in quadrant C | 3,542,293 | 303,462 |
| Events in quadrant D | 4,788,148 | 282,295 |
| Mode SS | |||
|---|---|---|---|
| Quadrant | BADHDUFLAG | Total packets | Discarded packets |
| A | 0 | 114 | 0 |
| B | 0 | 114 | 0 |
| C | 0 | 114 | 0 |
| D | 0 | 114 | 0 |
| Mode M9 | |||
|---|---|---|---|
| Quadrant | BADHDUFLAG | Total packets | Discarded packets |
| A | 0 | 36 | 0 |
| B | 0 | 36 | 0 |
| C | 0 | 36 | 0 |
| D | 0 | 36 | 0 |
| Mode M0 | |||
|---|---|---|---|
| Quadrant | BADHDUFLAG | Total packets | Discarded packets |
| A | 0 | 11719 | 3 |
| B | 0 | 14368 | 2 |
| C | 0 | 13768 | 2 |
| D | 0 | 18015 | 2 |
| Quadrant | Total seconds | Saturated seconds | Saturation percentage |
|---|---|---|---|
| A | 5499 | 12 | 0.218221% |
| B | 5499 | 191 | 3.473359% |
| C | 5499 | 127 | 2.309511% |
| D | 5499 | 217 | 3.946172% |
Noise dominated data is calculated using 1-second bins in cleaned event files. If a bin has >2000 counts, and if more than 50% of those come from <1% of pixels, then it is considered to be noise-dominated and hence unusable.
| Quadrant | # 1 sec bins | Bins with >0 counts | Bins with >2000 counts | High rate bins dominated by noise | Noise dominated (total time) | Noise dominated (detector-on time) | Marked lightcurve |
|---|---|---|---|---|---|---|---|
| A | 9087 | 5501 | 5 | 5 | 0.06% | 0.09% | 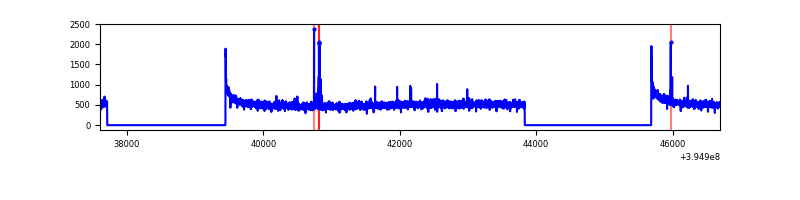 |
| B | 9087 | 5501 | 112 | 112 | 1.23% | 2.04% | 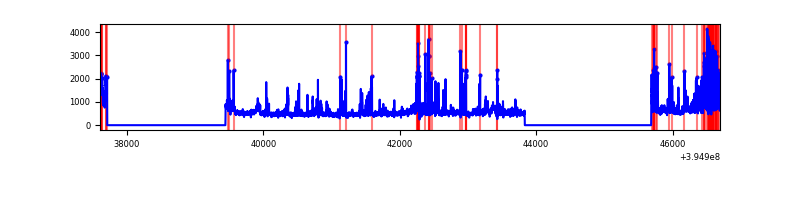 |
| C | 9087 | 5501 | 101 | 101 | 1.11% | 1.84% | 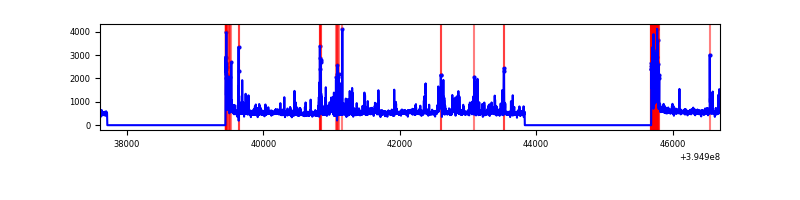 |
| D | 9087 | 5501 | 192 | 192 | 2.11% | 3.49% | 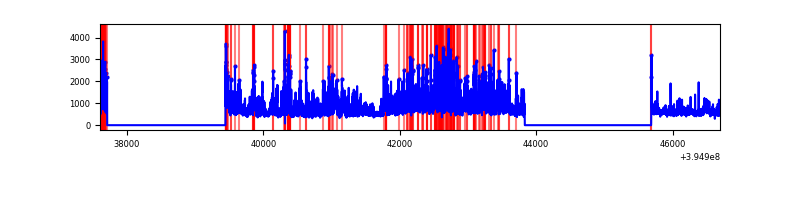 |
Top three noisy pixels from each quadrant. If the there are fewer than three noisy pixels in the level2.evt file, extra rows are filled as -1
| Pixel properties | Quadrant properties | ||||||
|---|---|---|---|---|---|---|---|
| Quadrant | DetID | PixID | Counts | Sigma | Mean | Median | Sigma |
| A | 10 | 83 | 207465 | 1524.62 | 675 | 663 | 135.6 |
| A | 15 | 223 | 36130 | 261.48 | 675 | 663 | 135.6 |
| A | 13 | 6 | 25430 | 182.59 | 675 | 663 | 135.6 |
| B | 5 | 200 | 685437 | 5445.24 | 665 | 649 | 125.8 |
| B | 5 | 255 | 235279 | 1865.71 | 665 | 649 | 125.8 |
| B | 0 | 213 | 43948 | 344.3 | 665 | 649 | 125.8 |
| C | 14 | 254 | 347258 | 2322.09 | 647 | 654 | 149.3 |
| C | 0 | 10 | 334816 | 2238.73 | 647 | 654 | 149.3 |
| C | 15 | 214 | 233755 | 1561.67 | 647 | 654 | 149.3 |
| D | 12 | 235 | 1882509 | 11941.07 | 643 | 624 | 157.6 |
| D | 4 | 239 | 85406 | 537.96 | 643 | 624 | 157.6 |
| D | 13 | 171 | 75706 | 476.42 | 643 | 624 | 157.6 |
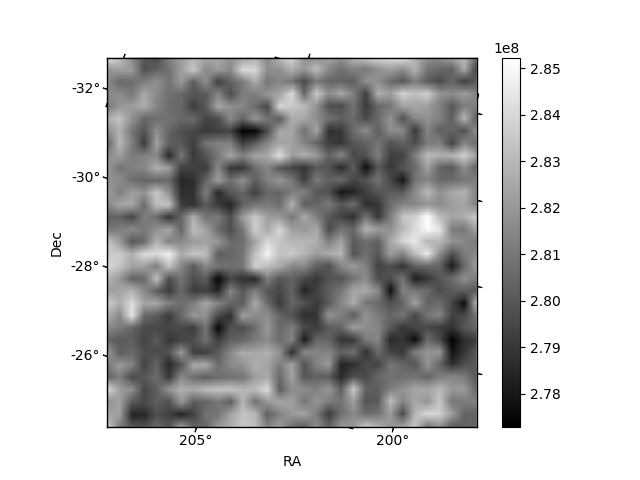
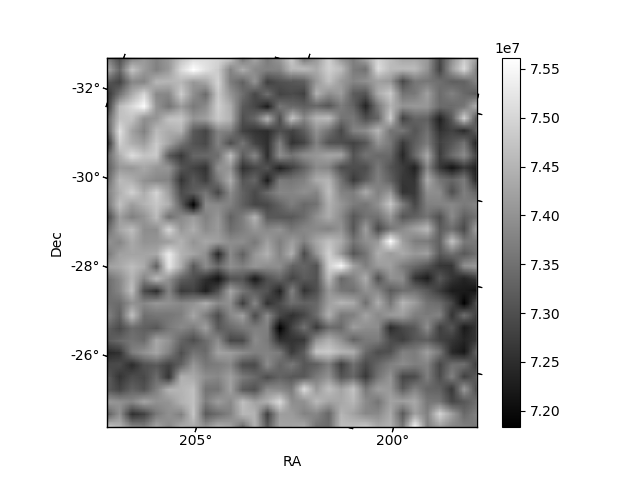
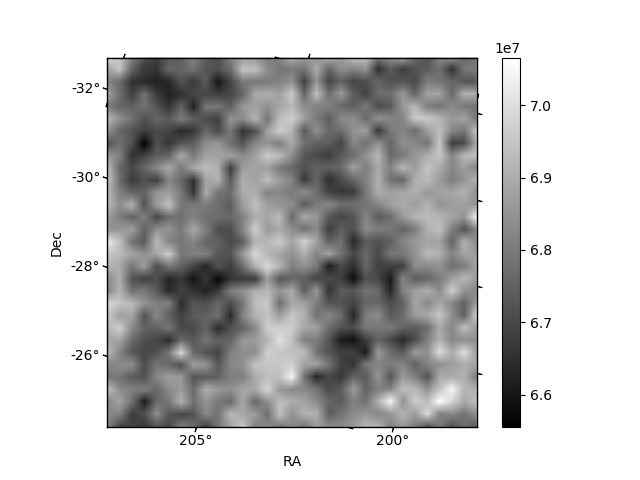
Histogram calculated using DETX and DETY for each event in the final _common_clean file
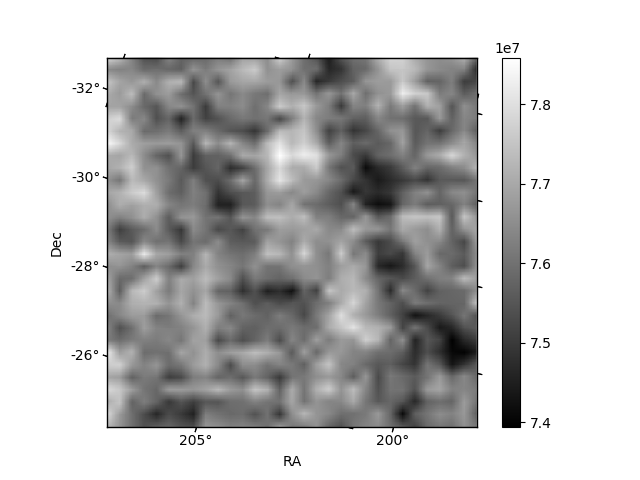
| Quadrant A | 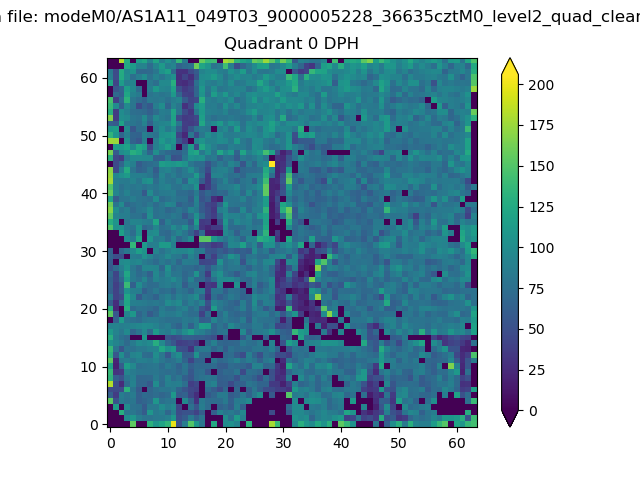 |
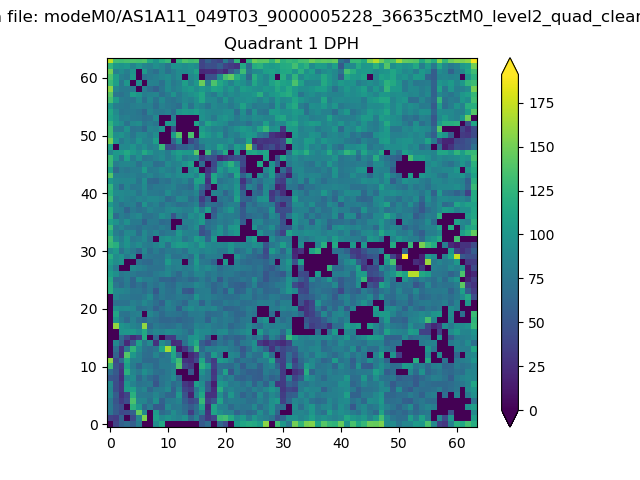 |
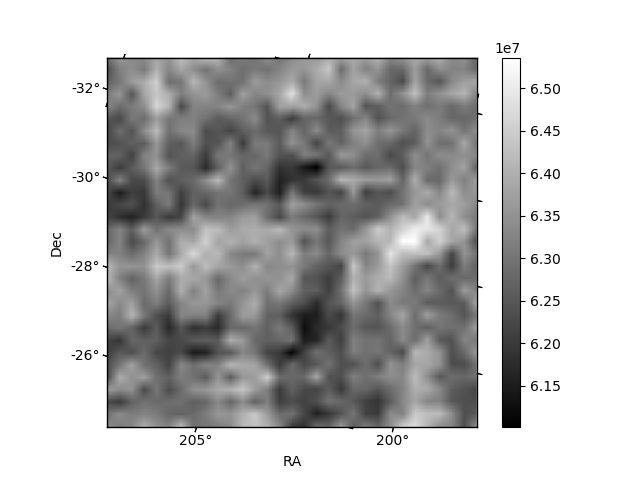
Quadrant B |
|---|---|---|---|
| Quadrant D | 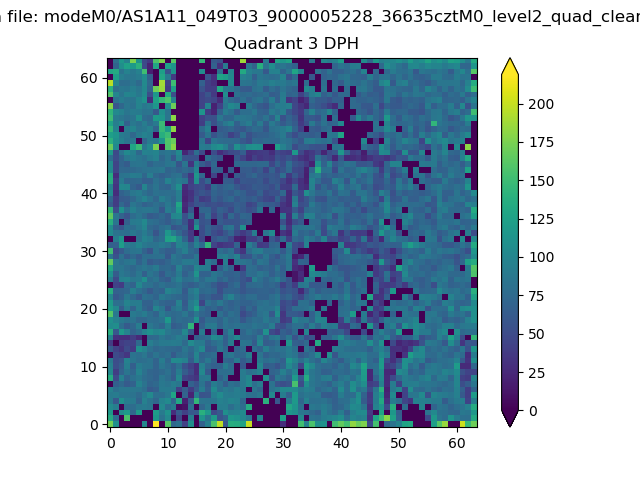 |
 |
Quadrant C |
| Plot type | Count rate plots | Images |
|---|---|---|
| Comparison with Poisson distribution Blue bars denote a histogram of data divided into 1 sec bins. Red curve is a Poisson curve with rate = median count rate of data. |
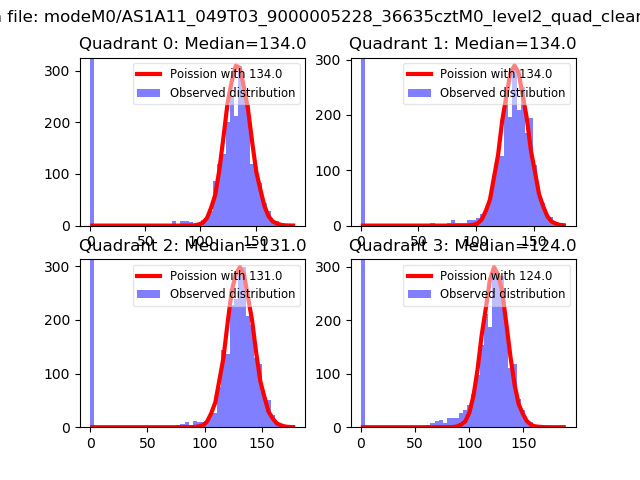 |
 |
| Quadrant-wise count rates Data is divided into 100 sec bins |
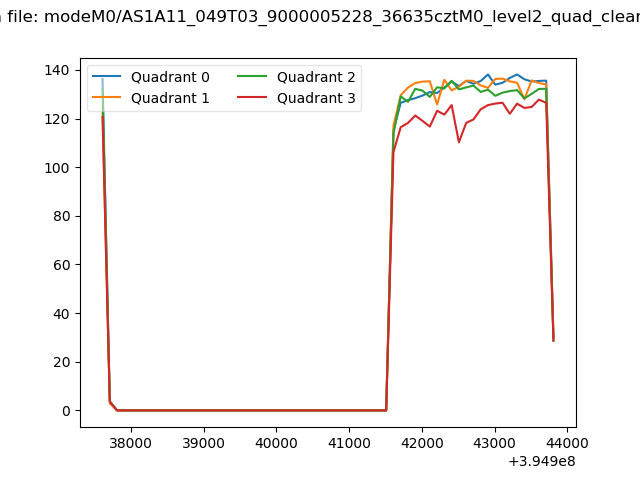 |
|
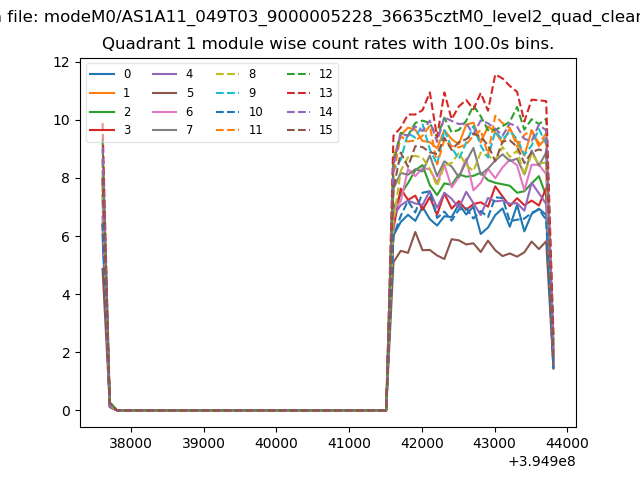
| Module-wise count rates for Quadrant A Data is divided into 100 sec bins |
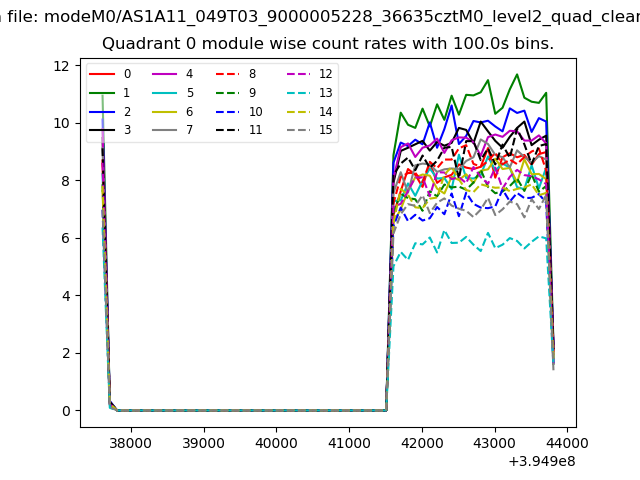 |
 |
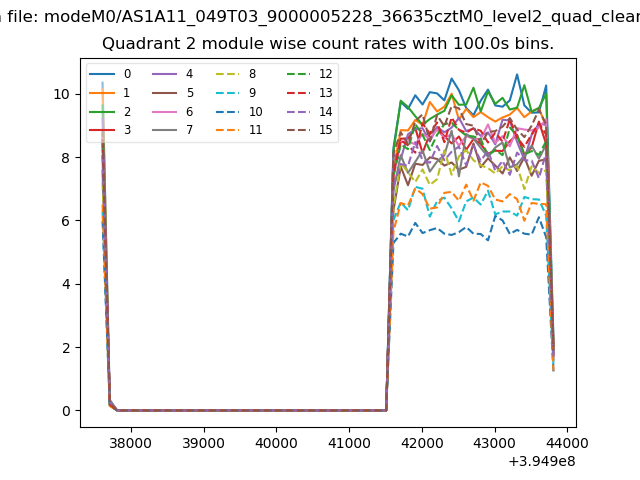
| Module-wise count rates for Quadrant B Data is divided into 100 sec bins |
 |
 |
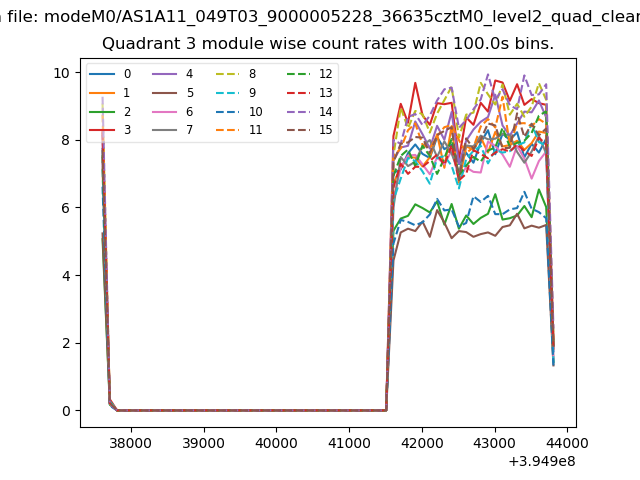
| Module-wise count rates for Quadrant C Data is divided into 100 sec bins |
 |
 |
| Module-wise count rates for Quadrant D Data is divided into 100 sec bins |
 |
 |
| Parameter | Plot |
|---|---|
| CZT HV Monitor | 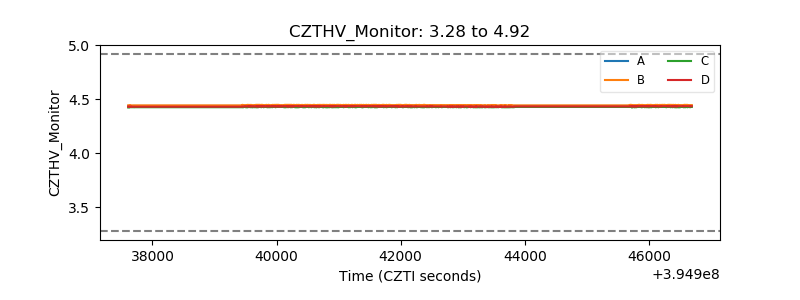 |
| D_VDD | 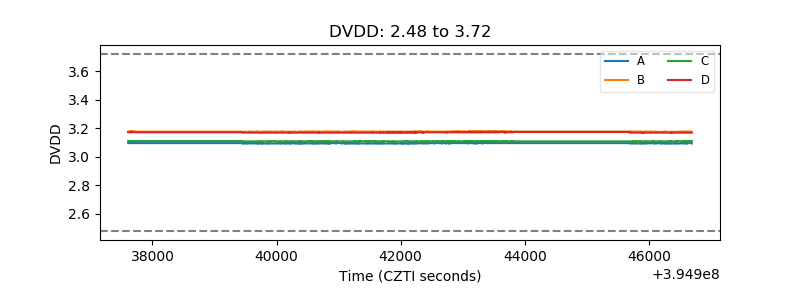 |
| Temperature 1 | 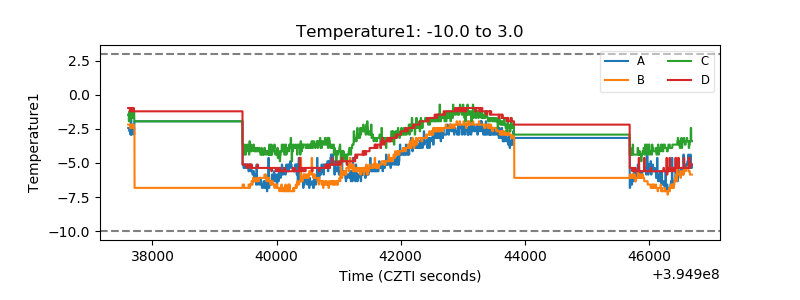 |
| Veto HV Monitor | 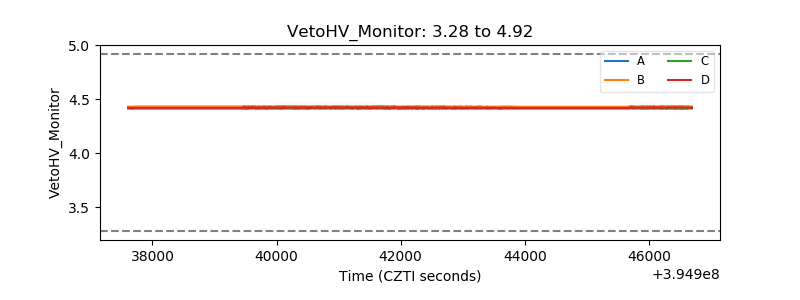 |
| Veto LLD | 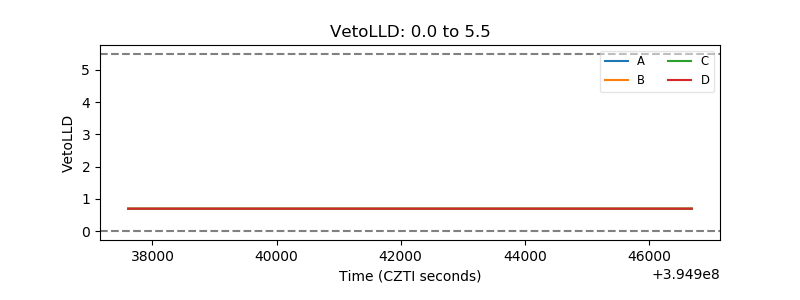 |
| Alpha Counter | 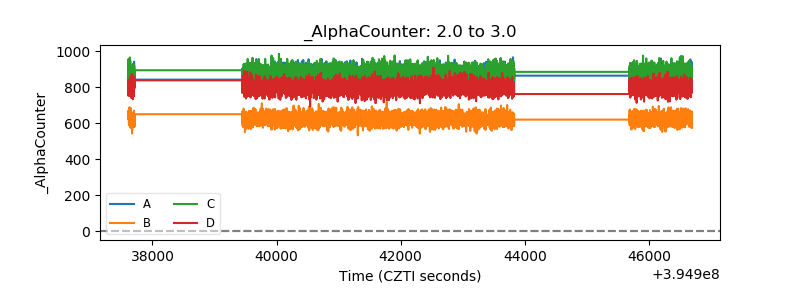 |
| _CPM_Rate | 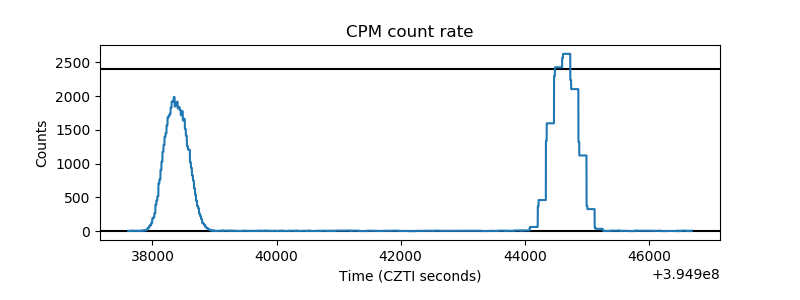 |
| CZT Counter | 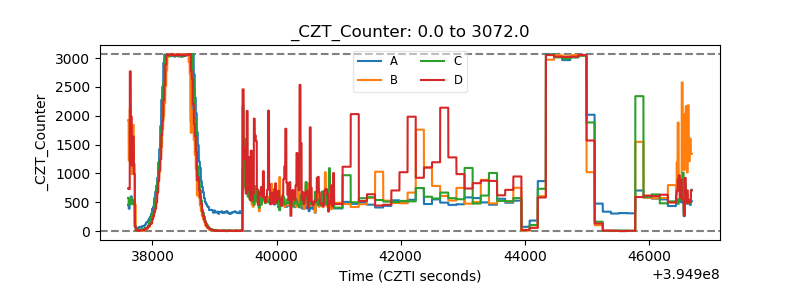 |
| +2.5 Volts monitor |  |
| +5 Volts monitor | 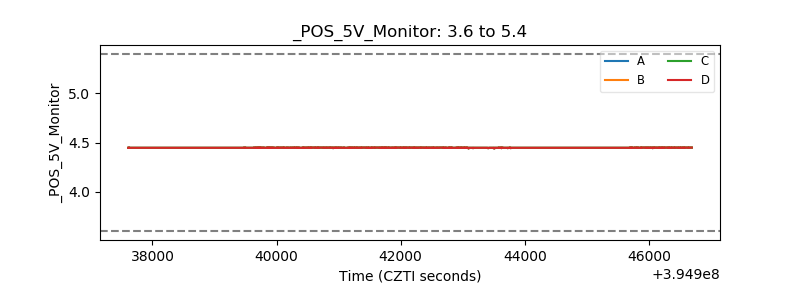 |
| _ROLL_ROT | 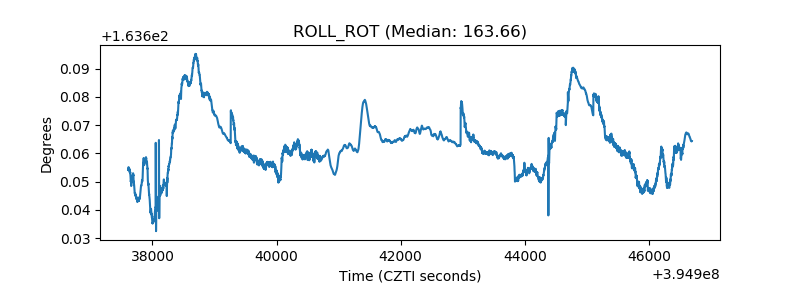 |
| _Roll_DEC | 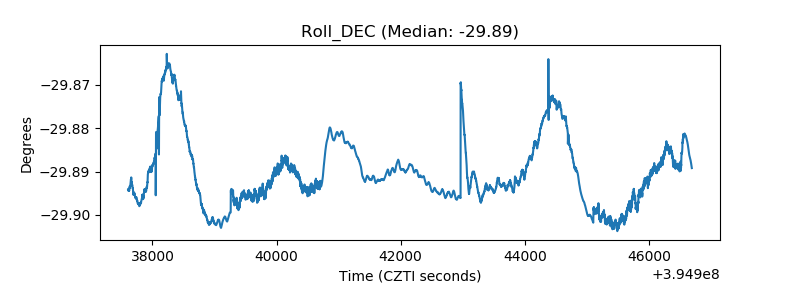 |
| _Roll_RA | 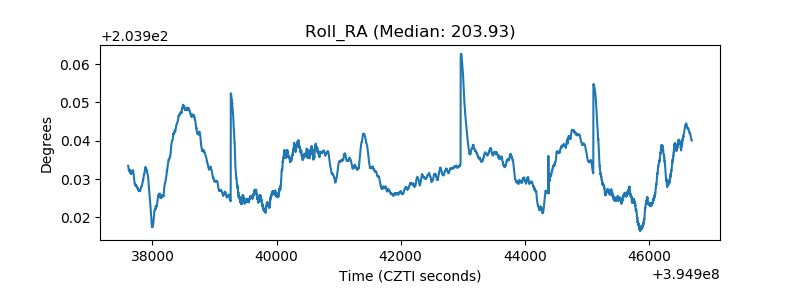 |
| Veto Counter | 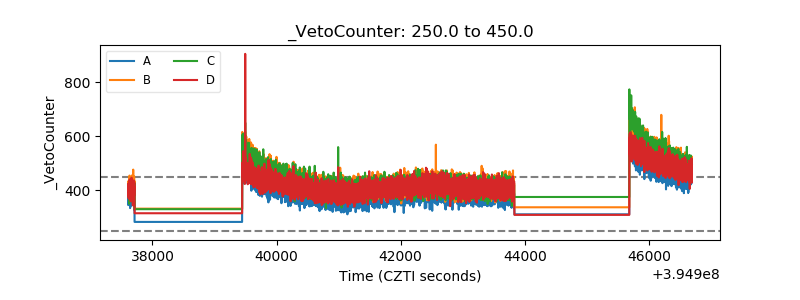 |